


- XAUUSD
- XAGUSD
- WTI
- USDX


Markets
Analysis
User
24/7
Economic Calendar
Education
Data
- Names
- Latest
- Prev







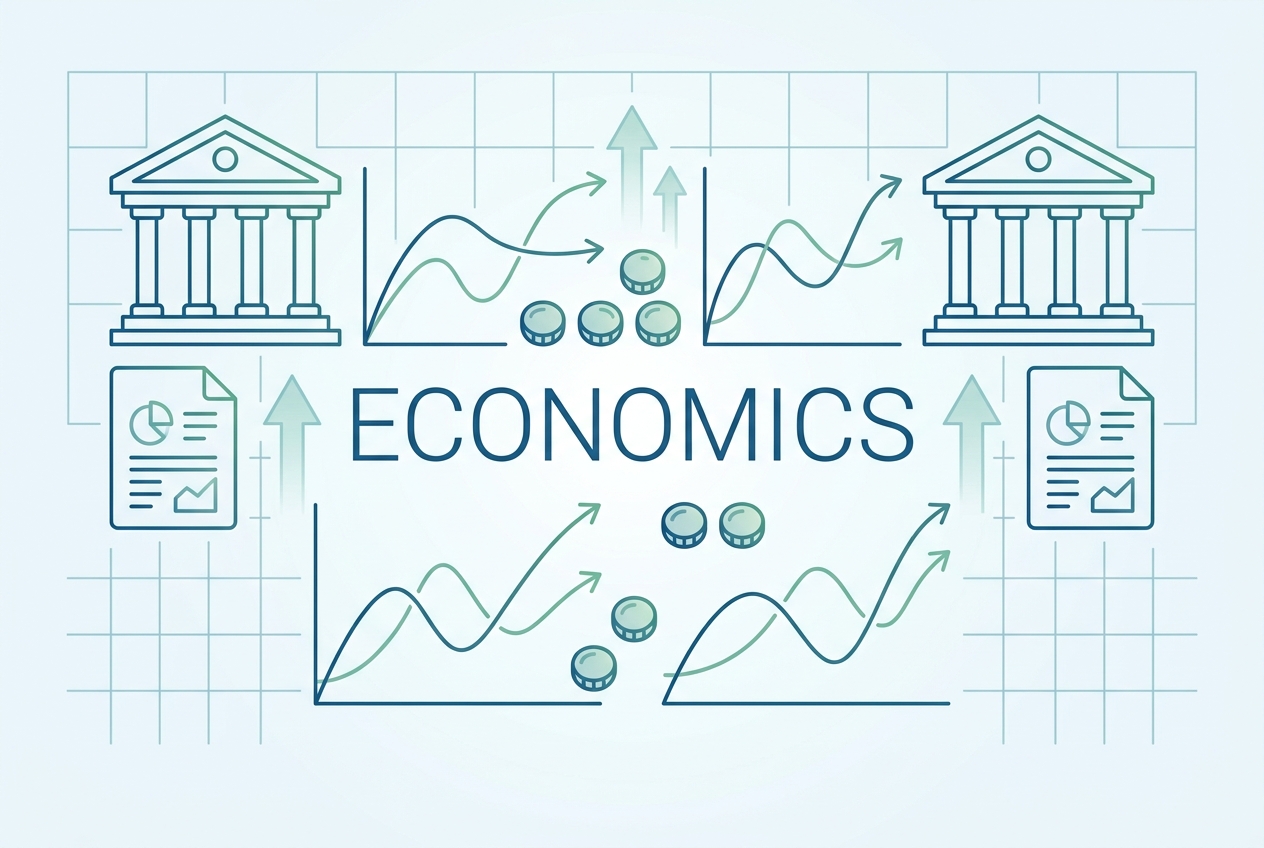
Beyond the balance sheet lies the market’s tide. Master fundamental analysis macroeconomics to link interest rates and GDP to precise asset valuations.
For investors looking to value assets accurately, mastering fundamental analysis macroeconomics is essential. This guide explains how broad economic indicators—such as GDP, inflation, and central bank policy—drive global asset valuations. You will learn to use top-down analysis to map economic cycles and adjust your portfolio to changing market conditions effectively.
Macroeconomics provides the broader economic context in which individual companies operate. Even a well-managed business with a strong balance sheet will struggle to grow revenues during a severe national recession. By analyzing the macroeconomic environment, investors can determine whether the economic tide is rising or falling.
This context is essential for building accurate financial models. Assumptions about a company’s future cash flows are inherently tied to consumer purchasing power, borrowing costs, and aggregate demand. Therefore, macroeconomic trends act as the baseline multiplier for all individual asset valuations.
Top-down analysis starts by evaluating the global and national economy before narrowing down to specific sectors and, finally, individual companies. Investors examine broad economic health to decide on asset allocation, such as the weighting of equities versus fixed income.
Once the macro environment is understood, investors filter out sectors likely to underperform. This systematic approach helps analysts identify resilient sectors, making it easier to pinpoint the best stocks to buy now for long term holding. By starting wide and narrowing the focus, investors reduce exposure to systemic risks that micro-analysis alone might miss.
Gross Domestic Product (GDP) represents the total economic output of a country. Data from official agencies, such as the U.S. Bureau of Economic Analysis (BEA), helps investors track whether an economy is expanding or contracting.
Consistent GDP growth typically translates directly into higher corporate revenues and stronger aggregate earnings. In these expansionary phases, risk appetite increases, and investors often look for the best growth stocks to buy now to capitalize on expanding profit margins. Conversely, shrinking GDP signals tighter corporate budgets and lower consumer spending.
Inflation metrics, such as the Consumer Price Index (CPI) published by the Bureau of Labor Statistics (BLS), measure the rate at which purchasing power is eroding. High inflation increases input costs for businesses and forces central banks to raise interest rates to cool the economy.
Higher interest rates increase the discount rate applied to future corporate earnings, lowering present-day equity valuations. When inflation cools and rates stabilize, future cash flows become more valuable. During these periods, screening for the best tech stocks to buy now becomes a popular strategy, as technology valuations are highly sensitive to discount rates.
Employment reports, such as Non-Farm Payrolls, provide critical insight into the health of the labor market. Strong employment ensures stable wage growth, which directly fuels consumer spending. Because consumer spending accounts for the majority of GDP in developed nations, this data is vital for forecasting retail and service sector performance.
However, investors must treat employment as a lagging indicator. Companies usually wait for confirmed economic weakness before cutting jobs, and wait for confirmed recovery before hiring. Therefore, employment data confirms the current phase of the business cycle rather than predicting the next one.
Central banks, such as the Federal Reserve and the European Central Bank, control the baseline cost of capital in their respective economies. The policy rates set by these institutions serve as the "risk-free rate" in fundamental valuation models like the Discounted Cash Flow (DCF) model.
When central banks raise rates, borrowing becomes more expensive for companies, which stunts expansion and reduces net income. Additionally, a higher risk-free rate means investors require a higher expected return from riskier assets like equities, suppressing stock prices broadly.
Interest rate shifts trigger immediate repricing across all major asset classes. Fixed income markets react mechanically; as new bonds are issued with higher yields, the prices of existing, lower-yielding bonds fall.
In equity markets, higher rates disproportionately hurt growth stocks, while value stocks with immediate cash flows may hold steady. In currency markets, higher interest rates tend to attract foreign capital seeking higher yields, which strengthens the domestic currency.
| Asset Class | Reaction to Rising Interest Rates | Reaction to Falling Interest Rates |
|---|---|---|
| Bonds | Prices drop as yields rise. | Prices rise as yields fall. |
| Equities | Valuations generally contract (Growth suffers most). | Valuations generally expand. |
| Currencies | Domestic currency usually strengthens. | Domestic currency usually weakens. |
Different sectors of the economy historically outperform during specific phases of the business cycle.
During an economic slowdown, defensive investors might rotate capital into the best dividend stocks to buy now to secure reliable income streams. Understanding these cycles allows investors to overweight sectors with tailwinds and avoid those facing macroeconomic headwinds.
A robust fundamental analysis requires dynamic modeling. When macro conditions change, analysts must revise their assumptions for revenue growth, profit margins, and the weighted average cost of capital (WACC).
When markets overreact to pessimistic macro data, broad sell-offs frequently drag down fundamentally sound companies. This creates opportunities for astute analysts to find high-quality undervalued stocks to buy now. For highly risk-tolerant portfolios, macro dislocations can even present asymmetric opportunities to identify the best stocks to buy now under $10, provided the underlying businesses have the balance sheets to survive the cycle.
While vital for context, macroeconomic data is almost exclusively backward-looking. Official GDP, CPI, and employment reports reflect economic activity that has already occurred, often weeks or months prior. Financial markets, by contrast, are forward-looking mechanisms that price in expectations rather than past realities.
Furthermore, macroeconomic analysis struggles to account for sudden, systemic shocks, such as geopolitical conflicts or natural disasters. It also ignores market sentiment and behavioral economics, meaning an asset's price can remain detached from its macroeconomic fundamentals for extended periods.
It is the evaluation of broad economic data—like GDP, inflation, and employment—to assess the overall health of an economy. Investors use it to determine how sweeping macroeconomic forces will influence asset prices and direct global market trends.
The core principles include evaluating revenue growth, analyzing profit margins, assessing debt levels, understanding competitive market share, and analyzing macroeconomic conditions. Together, these elements determine the intrinsic, long-term value of a financial asset.
The most critical indicators are Gross Domestic Product (GDP), the Consumer Price Index (CPI), central bank interest rates, and employment data. These metrics directly influence corporate earnings forecasts and dictate the discount rates used in valuation multiples.
Interest rates dictate the cost of corporate borrowing and establish the risk-free rate used to discount future cash flows. When rates rise, borrowing becomes expensive and the present value of future earnings drops, generally lowering overall asset valuations.
Integrating fundamental analysis macroeconomics into your investment strategy provides a clearer picture of market realities. By tracking core economic indicators and interest rate cycles, investors can adjust their valuations accurately and confidently. While macro data has limitations, blending it with rigorous company-level research ensures more resilient and informed portfolio decisions.

728 RM B 7/F GEE LOK IND BLDG NO 34 HUNG TO RD KWUN TONG KLN HONG KONG


The risk of loss in trading financial instruments such as stocks, FX, commodities, futures, bonds, ETFs and crypto can be substantial. You may sustain a total loss of the funds that you deposit with your broker. Therefore, you should carefully consider whether such trading is suitable for you in light of your circumstances and financial resources.
No decision to invest should be made without thoroughly conducting due diligence by yourself or consulting with your financial advisors. Our web content might not suit you since we don't know your financial conditions and investment needs. Our financial information might have latency or contain inaccuracy, so you should be fully responsible for any of your trading and investment decisions. The company will not be responsible for your capital loss.
Without getting permission from the website, you are not allowed to copy the website's graphics, texts, or trademarks. Intellectual property rights in the content or data incorporated into this website belong to its providers and exchange merchants.
Not Logged In
Log in to access more features


Log In
Sign Up


