


- USDX
- XAUUSD
- XAGUSD
- WTI



Markets
Analysis
User
24/7
Economic Calendar
Education
Data
- Names
- Latest
- Prev












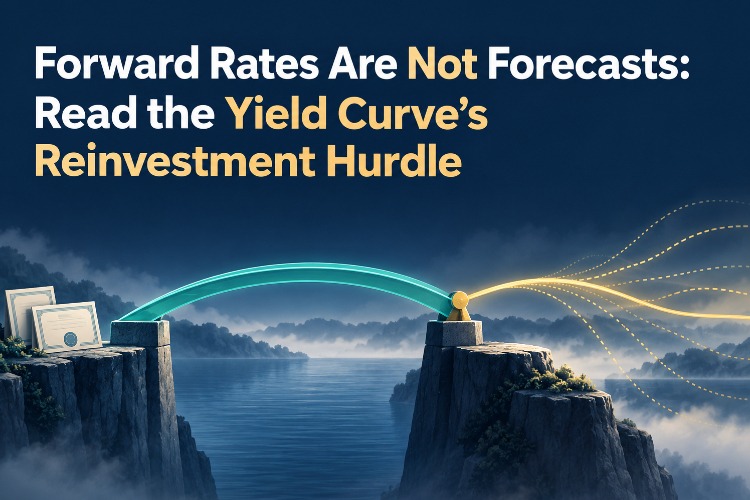
A downward yield curve does not tell you where policy rates must go. A worked zero-coupon example turns the implied forward rate into a reinvestment hurdle, then tests costs, curve shifts and quotation conventions.
A one-year zero-coupon rate of 4% and a two-year rate of 3.5% can both be correct. The shorter investment pays more per year, but it guarantees that rate for only half the investment horizon. To compare the alternatives, the useful question is not “Which displayed yield is higher?” It is “What return would I need in the second year for rolling short investments to match locking in two years?”
In the simplified example below, that hurdle is 3.0024%. It is a rate implied by today’s prices, not a promise that next year’s policy rate, deposit rate or bond yield will equal it. This distinction matters when a yield-curve chart is used to justify either staying in cash or extending maturity.
Assume the same currency, the same credit quality and zero-coupon instruments held to maturity. Rates compound annually; dates are exactly one and two years away. There are no taxes, fees, defaults or bid–ask spreads. These are invented inputs for calculation, not current market quotations.
Investing 10,000 for two years at 3.5% produces 10,000 × 1.035² = 10,712.25. Investing for one year at 4% produces 10,400. The second investment must turn that 10,400 into 10,712.25. Therefore the one-year rate starting one year from today is:
f₁,₂ = 1.035² ÷ 1.04 − 1 = 3.0024038…%
Subtracting 4% from 3.5% gives a slope of minus 0.5 percentage points, not the forward rate. Nor is 3.5% simply the arithmetic average of the two one-year rates: the first year’s interest is reinvested.
A forward fixes terms now for a future period. Rolling a one-year holding without a hedge leaves that future rate unknown. The two choices have different risk even when the initial curve makes their projected proceeds look identical.
| Second-year rate actually obtained | Proceeds from rolling 10,000 | Difference versus the two-year holding |
|---|---|---|
| 2% | 10,608.00 | −104.25 |
| 3% | 10,712.00 | −0.25 |
| 3.0024038…% | 10,712.25 | 0.00 |
| 4% | 10,816.00 | +103.75 |
The 25-cent shortfall at 3% is rounding, not a market inefficiency. A realized second-year rate above the unrounded hurdle makes the rolling strategy outperform in this example; a lower rate makes it underperform. That comparison does not require a forecast. It tells you what forecast would have to prove correct.
If the money is needed after one year, however, the comparison no longer holds. The two-year instrument would have to be sold before maturity at an unknown price. Matching the horizon is essential: certainty of the maturity payment is not certainty of the resale value.
Let P(0,T) be today’s price of one unit paid at date T. Here P(0,1) = 1/1.04 = 0.96153846 and P(0,2) = 1/1.035² = 0.93351070. For a one-year future interval, 1 + f₁,₂ = P(0,1)/P(0,2).
A synthetic forward loan makes the economics tangible. Buy a claim paying 10,000 in year one for 9,615.38 today. Finance that purchase with a two-year borrowing whose single repayment is 10,300.24. Initial cash flows offset; the remaining schedule is a receipt of 10,000 in year one and repayment of 10,300.24 in year two. The implied interest is approximately 3.0024%.
This replication assumes borrowing and investing are available on the same curve. A household deposit and an unsecured corporate loan do not meet that condition. Funding spreads, collateral and transaction costs can prevent the theoretical schedule from being executable. A calculated forward is therefore not automatically a quote you can trade.
Bond prices reflect expectations, but also compensation for bearing interest-rate risk and the supply and demand for particular maturities. Central-bank term-structure models try to separate expected short rates from term premia; that separation is model-dependent, not another observable price on the screen. Liquidity and credit differences can add further distortions when instruments are mixed.
Even an overnight-indexed swap curve needs careful interpretation. A rate covering an interval is not necessarily the policy rate immediately after a particular central-bank meeting. Mapping it into a meeting outcome requires the instrument’s averaging or compounding rules, calendar and assumptions about other possible rate paths.
The same interpretive problem appears in breakeven inflation rates: a market-implied number can be useful without being a pure forecast. The question is what else is priced into the instruments used to construct it.
Keep the two-year spot rate at 3.5%, but lower the one-year spot rate from 4% to 3.75%. The second-year implied rate becomes 1.035²/1.0375 − 1 = 3.2506%. It rises by roughly 24.82 basis points even though the one-year rate has fallen by 25 basis points.
There is no contradiction: with the two-year compounded return unchanged, a smaller return in year one must be offset by a larger implied return in year two. This is a controlled arithmetic comparison, not a prediction of how an actual market would respond to a rate cut. Reading a forward move without checking both ends of its interval can reverse the economic story.
The defensible conclusion is narrow and useful: today’s curve supplies a break-even reinvestment rate under specified assumptions. It does not settle which strategy will win, and it does not convert a bond-market price into certainty about the central bank.

728 RM B 7/F GEE LOK IND BLDG NO 34 HUNG TO RD KWUN TONG KLN HONG KONG





The risk of loss in trading financial instruments such as stocks, FX, commodities, futures, bonds, ETFs and crypto can be substantial. You may sustain a total loss of the funds that you deposit with your broker. Therefore, you should carefully consider whether such trading is suitable for you in light of your circumstances and financial resources.
No decision to invest should be made without thoroughly conducting due diligence by yourself or consulting with your financial advisors. Our web content might not suit you since we don't know your financial conditions and investment needs. Our financial information might have latency or contain inaccuracy, so you should be fully responsible for any of your trading and investment decisions. The company will not be responsible for your capital loss.
Without getting permission from the website, you are not allowed to copy the website's graphics, texts, or trademarks. Intellectual property rights in the content or data incorporated into this website belong to its providers and exchange merchants.
Not Logged In
Log in to access more features


Log In
Sign Up


