• Trade
  • Markets
  • Copy
  • Contests
  • 24/7
  • Calendar
  • Q&A
  • Chats
Screeners
SYMBOL
LAST
BID
ASK
HIGH
LOW
NET CHG.
%CHG.
SPREAD
SOURCE
SPX
S&P 500 Index
7578.71
7578.71
7578.71
7588.70
7545.39
+37.31
+ 0.49%
--
--
DJI
Dow Jones Industrial Average
51744.52
51744.52
51744.52
51932.63
51593.16
-239.46
-0.46%
--
--
IXIC
NASDAQ Composite Index
25413.66
25413.66
25413.66
25442.63
25246.64
+249.35
+ 0.99%
--
--
USDX
US Dollar Index
101.658
101.658
101.738
101.775
101.448
+0.015
+ 0.01%
--
--
EURUSD
Euro / US Dollar
1.11920
1.11920
1.11929
1.12062
1.11741
+0.00058
+ 0.05%
--
--
GBPUSD
Pound Sterling / US Dollar
1.34156
1.34156
1.34168
1.34321
1.33957
+0.00103
+ 0.08%
--
--
XAUUSD
Gold / US Dollar
3929.06
3929.06
3929.47
3971.05
3895.34
-17.71
-0.45%
--
--
WTI
Light Sweet Crude Oil
95.240
95.240
95.270
97.883
92.913
-0.090
-0.09%
--
--

Community Accounts

Signal Accounts
--
Profit Accounts
--
Loss Accounts
--
View More

Become a signal provider

Sell trading signals to earn additional income

View More

Guide to Copy Trading

Get started with ease and confidence

View More

Signal Accounts for Members

All Signal Accounts

Best Return
  • Best Return
  • Best P/L
  • Best MDD
Past 1W
  • Past 1W
  • Past 1M
  • Past 1Y

All Contests

  • All
  • Recommend
  • Stocks
  • Cryptocurrencies
  • Central Banks
  • Trump Updates
  • Featured News
Top News Only
Share

Qatar's Ministry Of Foreign Affairs: Qatar Supports All Diplomatic Efforts And Related Initiatives, Is Committed To Reaching A Solution That Guarantees Freedom Of Navigation At Sea, And Paves The Way For A Comprehensive Agreement That Will Bring Lasting Peace To The Region

Share

Qatar's Ministry Of Foreign Affairs: The Prime Minister Of Qatar Spoke With EU High Representative For Foreign Affairs And Security Policy Karas Kalas, Discussing Qatar's Cooperative Relationship With The EU And Ways To Strengthen Cooperation. They Also Exchanged Views On The Latest Situation In The Region, Diplomatic Efforts To De-escalate The Situation, And Coordination To Enhance Regional Security And Stability

Share

The Russian Ministry Of Defense Stated That In The Past Day, Russian Air Defense Forces Shot Down 13 Ukrainian Drones In Several Regions Of The Russian Federation

Share

Houthi Rebels: Since The Escalation Of The Conflict In Our Country, The Saudi-led Coalition Has Launched A Total Of 4,032 Airstrikes And Missile Attacks

Share

Trump Stated That The Republican Party Had Already Declared Guam The Victor

Share

The Houthi Rebels Claimed That Saudi Warplanes Carried Out 93 Airstrikes On Civilian Targets In The Capital Sana'a, As Well As The Provinces Of Al-Jawf, Taiz, Saada, Marib, Amran, Lahj, And Hajj, In The Past 24 Hours. These Airstrikes, Conducted By F-15 And Typhoon Fighter Jets From The Khamis Mushait And Taif Military Bases, Caused Numerous Civilian Casualties, Including Women And Children. The Houthis Stated That This Brings The Total Number Of Airstrikes And Missile Strikes Launched By The Saudi-led Coalition Since The Escalation Of The Conflict In Yemen To 4,032

Share

Ukrainian President Volodymyr Zelensky: Sometimes We Don't Even Understand How Powerful We Are. Europe Is Very Powerful. Yes, There Are Internal Problems, But In Any Case, Europe Is United. With This Unity, Europe Is Many Times Stronger Than Russia Is Today

Share

Ukrainian President Volodymyr Zelensky: Russian President Vladimir Putin Doesn't Understand This Form Of Dialogue, And That's Not Enough. He Prefers Pressure And Tough Measures, So Sometimes We Need To Talk To Him In His Own Language

Share

Israeli Prime Minister Benjamin Netanyahu Retweeted A Statement From The Likud Party, Calling For An Investigation Into Foreign Interference In The Israeli Elections And Accusing The Attorney General Of Obstructing The Shin Bet Investigation

Share

Ukrainian President Zelensky: If The Sanctions Are 100% Effective, And If No One Plays These Tricks, Such As Lifting Sanctions On Some Oligarchs, Russia Will Not Be Able To Survive

Share

The Israeli Supreme Court Rejected A Petition Against The Speaker Of Parliament, Refusing To Require Him To Set A Date For The Election Of The State Comptroller

Share

The United States And Venezuela Are Negotiating A New Shipment Of Aluminum Goods In The Process Of Resuming Trade

Share

Lufthansa: The Acquisition Of TAP Air Portugal Is Expected To Generate Synergies Of Up To €450 Million

Share

Lufthansa AG: The Lufthansa Group Has Signed An Agreement With The Portuguese Government To Acquire A Minority Stake In TAP Air Portugal For €1.025 Billion, Initially Acquiring 44.9% Of The Shares

Share

A Spokesperson For The Qatari Foreign Ministry Said That The Talks On Monday Evening Were Initially Scheduled To Last One Hour, But Were Extended To Three Hours As Iranian Officials Reviewed Proposals Aimed At Ending The Escalation Of The Regional Situation

Share

Yemen Denied Saudi Arabia's Accusations Of Drone Attacks On Mecca, Calling Them "slander."

Share

The Conservative Justices Of The U.S. Supreme Court Appear To Sympathize With A Request For An Exemption From A Colorado Law That Prohibits Anti-LGBT Discrimination In Publicly Funded Kindergartens

Share

Market News: The Trump Administration Facilitated $838 Billion In Trade And Investment Through The Commerce Department’s Global Markets Division

Share

Ukrainian President Volodymyr Zelensky: For The Past 80 Years, The United States Has Been The Guarantor Of Global Security, But That America No Longer Exists. The People Of The Gulf Region Once Had The Strongest Belief In The Security Guarantees Provided By The United States, But Now, All They Are Thinking About Is How To Prevent Another Full-scale War

Share

Ukrainian President Zelensky: Different Countries Are Now Building Their Own Versions Of Starlink. This Is The Right Thing To Do, Because The Key Question Is Who Controls The Switch

TIME
ACT
FCST
PREV
IMPACT
India HSBC Manufacturing PMI Final (Oct)

A:--

F: --

P: --

XAUUSD
  • XAUUSD
  • XAGUSD
  • WTI
  • USDX
Australia Commodity Price YoY (Oct)

A:--

F: --

P: --

AUDUSD
  • AUDUSD
  • XAUUSD
  • XAGUSD
  • WTI
  • USDX
Russia IHS Markit Manufacturing PMI (Oct)

A:--

F: --

P: --

WTI
  • WTI
  • XAUUSD
  • XAGUSD
  • USDX
Germany Actual Retail Sales MoM (Sept)

A:--

F: --

P: --
EURUSD
  • EURUSD
  • XAUUSD
  • XAGUSD
  • WTI
  • USDX
Turkey Manufacturing PMI (Oct)

A:--

F: --

P: --

XAUUSD
  • XAUUSD
  • XAGUSD
  • WTI
  • USDX
Italy Manufacturing PMI (SA) (Oct)

A:--

F: --

P: --

EURUSD
  • EURUSD
  • XAUUSD
  • XAGUSD
  • WTI
  • USDX
South Africa Manufacturing PMI (Oct)

A:--

F: --

P: --

XAUUSD
  • XAUUSD
  • XAGUSD
  • WTI
  • USDX
Euro Zone Manufacturing PMI Final (Oct)

A:--

F: --

P: --

EURUSD
  • EURUSD
  • XAUUSD
  • XAGUSD
  • WTI
  • USDX
U.K. Manufacturing PMI Prelim (Oct)

A:--

F: --

P: --

GBPUSD
  • GBPUSD
  • XAUUSD
  • XAGUSD
  • WTI
  • USDX
Canada National Economic Confidence Index

A:--

F: --

P: --

USDCAD
  • USDCAD
  • XAUUSD
  • XAGUSD
  • WTI
  • USDX
Canada Manufacturing PMI (SA) (Oct)

A:--

F: --

P: --

USDCAD
  • USDCAD
  • XAUUSD
  • XAGUSD
  • WTI
  • USDX
U.S. IHS Markit Manufacturing PMI Final (Oct)

A:--

F: --

P: --

USDX
  • USDX
  • XAUUSD
  • XAGUSD
  • WTI
U.S. ISM Inventories Index (Oct)

A:--

F: --

P: --

USDX
  • USDX
  • XAUUSD
  • XAGUSD
  • WTI
U.S. Construction Spending MoM (Sept)

A:--

F: --

P: --
USDX
  • USDX
  • XAUUSD
  • XAGUSD
  • WTI
U.S. ISM Output Index (Oct)

A:--

F: --

P: --

USDX
  • USDX
  • XAUUSD
  • XAGUSD
  • WTI
U.S. ISM Manufacturing Employment Index (Oct)

A:--

F: --

P: --

USDX
  • USDX
  • XAUUSD
  • XAGUSD
  • WTI
U.S. ISM Manufacturing PMI (Oct)

A:--

F: --

P: --

USDX
  • USDX
  • XAUUSD
  • XAGUSD
  • WTI
U.S. ISM Manufacturing New Orders Index (Oct)

A:--

F: --

P: --

USDX
  • USDX
  • XAUUSD
  • XAGUSD
  • WTI
South Korea CPI YoY (Oct)

A:--

F: --

P: --

XAUUSD
  • XAUUSD
  • XAGUSD
  • WTI
Australia Overnight (Borrowing) Key Rate

A:--

F: --

P: --

AUDUSD
  • AUDUSD
  • XAUUSD
  • XAGUSD
  • WTI
  • USDX
RBA Rate Statement
Saudi Arabia IHS Markit Composite PMI (Oct)

A:--

F: --

P: --

WTI
  • WTI
  • XAUUSD
  • XAGUSD
  • USDX
RBA Press Conference
Turkey CPI YoY (Oct)

A:--

F: --

P: --

XAUUSD
  • XAUUSD
  • XAGUSD
  • WTI
  • USDX
Turkey PPI YoY (Oct)

A:--

F: --

P: --

XAUUSD
  • XAUUSD
  • XAGUSD
  • WTI
  • USDX
Brazil IHS Markit Manufacturing PMI (Oct)

A:--

F: --

P: --

XAUUSD
  • XAUUSD
  • XAGUSD
  • WTI
  • USDX
U.S. Weekly Redbook Index YoY

A:--

F: --

P: --

XAUUSD
  • XAUUSD
  • XAGUSD
  • WTI
  • USDX
U.S. JOLTS Job Openings (SA) (Sept)

A:--

F: --

P: --
XAUUSD
  • XAUUSD
  • XAGUSD
  • WTI
  • USDX
U.S. Factory Orders MoM (Sept)

A:--

F: --

P: --
USDX
  • USDX
  • XAUUSD
  • XAGUSD
  • WTI
U.S. Factory Orders MoM (Excl. Defense) (Sept)

A:--

F: --

P: --

USDX
  • USDX
  • XAUUSD
  • XAGUSD
  • WTI
U.S. Factory Orders MoM (Excl. Transport) (Sept)

A:--

F: --

P: --
USDX
  • USDX
  • XAUUSD
  • XAGUSD
  • WTI
Mexico Manufacturing PMI (Oct)

A:--

F: --

P: --

XAUUSD
  • XAUUSD
  • XAGUSD
  • WTI
  • USDX
U.S. API Weekly Crude Oil Stocks

--

F: --

P: --

U.S. API Weekly Cushing Crude Oil Stocks

--

F: --

P: --

U.S. API Weekly Gasoline Stocks

--

F: --

P: --

U.S. API Weekly Refined Oil Stocks

--

F: --

P: --

Australia Services PMI Prelim (Oct)

--

F: --

P: --

Japan Monetary Base YoY (SA) (Oct)

--

F: --

P: --

China, Mainland Caixin Composite PMI (Oct)

--

F: --

P: --

China, Mainland Caixin Services PMI (Oct)

--

F: --

P: --

India HSBC Services PMI Final (Oct)

--

F: --

P: --

India IHS Markit Composite PMI (Oct)

--

F: --

P: --

Italy Services PMI (SA) (Oct)

--

F: --

P: --

Italy Composite PMI (Oct)

--

F: --

P: --

Germany Composite PMI Final (SA) (Oct)

--

F: --

P: --

Euro Zone Services PMI Final (Oct)

--

F: --

P: --

Euro Zone Composite PMI Final (Oct)

--

F: --

P: --

U.K. Services PMI Prelim (Oct)

--

F: --

P: --

U.K. Official Reserves Changes (Oct)

--

F: --

P: --

U.K. Composite PMI Prelim (Oct)

--

F: --

P: --

Euro Zone Core CPI Prelim YoY (Oct)

--

F: --

P: --

Euro Zone Core CPI Prelim MoM (Oct)

--

F: --

P: --

Euro Zone HICP Prelim YoY (Oct)

--

F: --

P: --

U.S. MBA Mortgage Application Activity Index WoW

--

F: --

P: --

Mexico Consumer Confidence Index (Oct)

--

F: --

P: --

U.S. ADP Employment (Oct)

--

F: --

P: --

ECB Chief Economist Lane Speaks
Canada Exports (SA) (Sept)

--

F: --

P: --

Q&A with Experts
    • All
    • Chatrooms
    • Groups
    • Friends
    Capri flag
    EuroTrader
    @Caprii use pure market structure in trading. Pure market structure of higher highs and higher lows
    @EuroTraderhow to identify confirm high and confirm Lows,this is real math of market structure
    EuroTrader flag
    @Matthewwhat were you looking at while learning about the spx today?
    "Capri" recalled a message
    Capri flag
    @Matthewfriend I always align two TF like H1 and H4, both should be in same direction for buying or selling ,if H1 shows bullish and H4 shows bearish I didn't trade at all
    EuroTrader flag
    Capri
    @EuroTraderhow to identify confirm high and confirm Lows,this is real math of market structure
    @Capriwe can't really identify the highs and the lows. We just use market turning point in the marksts
    Capri flag
    EuroTrader
    @Capriwe can't really identify the highs and the lows. We just use market turning point in the marksts
    we can friend
    EuroTrader flag
    Matthew
    @EuroTraderI was reading about spy and NQ today
    @Matthewspy is the s and p 500 index, that's what the spy actually is mate. Nq is the Nasdaq
    Olim flag
    EuroTrader
    @Matthewwhat were you looking at while learning about the spx today?
    @EuroTradersaw GU sell, I sold @1.3413 with stoploss @1.3434 Tp at daily FVG
    Capri flag
    c you friends
    EuroTrader flag
    Capri
    we can friend
    @Capriwhat tools do you make use of in identifying the highs and the lows of the markets
    EuroTrader flag
    Capri
    c you friends
    @Capriare you going off at the moment or you are off the charts
    Matthew flag
    Capri
    @Matthewfriend I always align two TF like H1 and H4, both should be in same direction for buying or selling ,if H1 shows bullish and H4 shows bearish I didn't trade at all
    @Capriokay I see
    Matthew flag
    EuroTrader
    @Matthewspy is the s and p 500 index, that's what the spy actually is mate. Nq is the Nasdaq
    @EuroTraderYes that is the index and I hear it is good to trade
    Matthew flag
    EuroTrader
    @Matthewwhat were you looking at while learning about the spx today?
    @EuroTraderIt is composed of the top 500 stocks in United States
    EuroTrader flag
    Matthew
    @EuroTraderYes that is the index and I hear it is good to trade
    @Matthewyes it's actually easy to get data for spy and the Nasdaq of you make payment and you get the right source
    EuroTrader flag
    Matthew
    @EuroTraderIt is composed of the top 500 stocks in United States
    @Matthewyes that's exactly what it is and it's one of the quite easy pies to trade if you understand orderflow
    EuroTrader flag
    EuroTrader flag
    EuroTrader
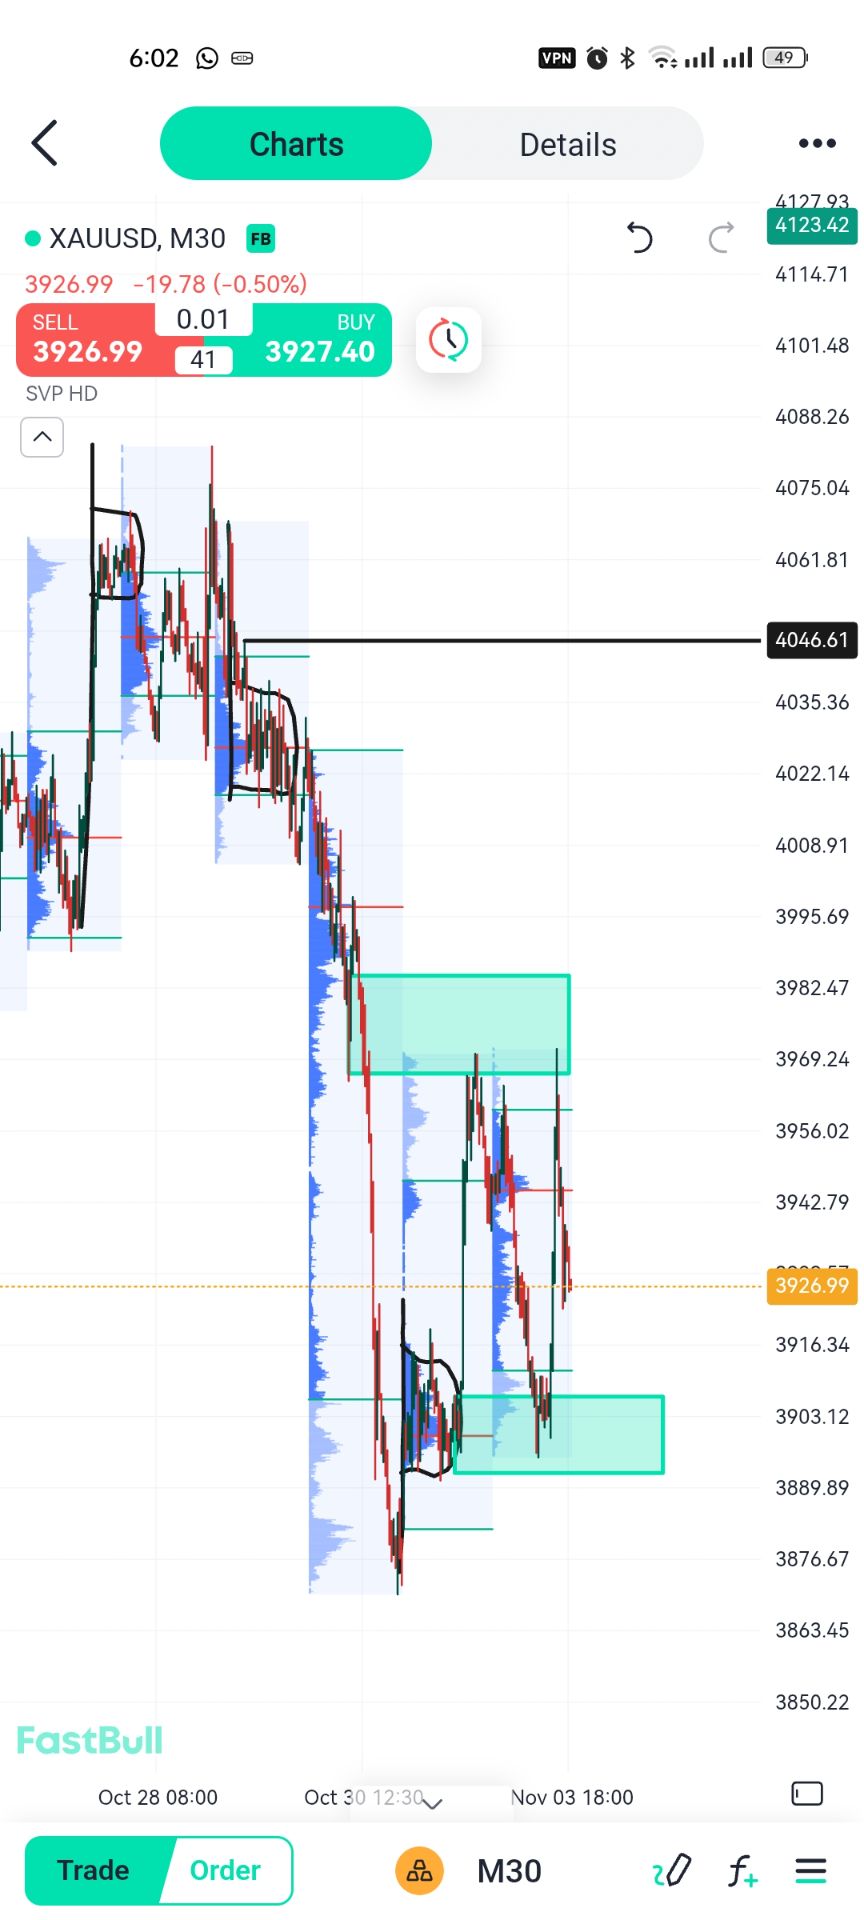
    I@Matthewthis is what I am expecting because this zones would most likely hold prices
    Areeba Mini❣️❣️ flag
    Areeba Mini❣️❣️ flag
    Type here...
    Add Symbol or Code

      No matching data

      All
      Recommend
      Stocks
      Cryptocurrencies
      Central Banks
      Trump Updates
      Featured News
      • All
      • Russia-Ukraine Conflict
      • Middle East Flashpoint
      • All
      • Russia-Ukraine Conflict
      • Middle East Flashpoint
      Search
      Products

      Charts Free Forever

      Chats Q&A with Experts
      Screeners Economic Calendar Data Tools
      Membership Features
      Data Warehouse Market Trends Institutional Data Policy Rates Macro

      Market Trends

      Market Sentiment Order Book Forex Correlations

      Top Indicators

      Charts Free Forever
      Markets

      News

      24/7 Analysis Education

      Latest Views

      Latest Update

      Signals

      Copy Rankings Latest Signals Become a signal provider AI Rating
      Contests
      Brokers

      Overview Brokers Assessment Rankings Regulators News Claims
      Broker listing Forex Brokers Comparison Tool Live Spread Comparison Scam
      Q&A Complaint Scam Alert Videos Tips to Detect Scam
      More

      Business
      Events
      Careers About Us Advertising Help Center

      White Label

      Broker API

      Data API

      Web Plug-ins

      Affiliate Program

      Awards Institution Evaluation IB Seminar Salon Event Exhibition
      Vietnam Thailand Singapore Dubai
      Fans Party Investment Sharing Session
      FastBull Summit BrokersView Expo
      Recent Searches
        Top Searches
          Markets
          Analysis
          User
          24/7
          Economic Calendar
          Education
          Data
          • Names
          • Latest
          • Prev

          View All

          No data

          Scan to Download

          Faster Charts, Chat Faster!

          Download
          English
          • English
          • Español
          • العربية
          • Bahasa Indonesia
          • Bahasa Melayu
          • Tiếng Việt
          • ภาษาไทย
          • Français
          • Italiano
          • Türkçe
          • Русский язык
          • 简中
          • 繁中
          Open Account
          Search
          Products
          Charts Free Forever
          Markets
          News
          Signals

          Copy Rankings Latest Signals Become a signal provider AI Rating
          Contests
          Brokers

          Overview Brokers Assessment Rankings Regulators News Claims
          Broker listing Forex Brokers Comparison Tool Live Spread Comparison Scam
          Q&A Complaint Scam Alert Videos Tips to Detect Scam
          More

          Business
          Events
          Careers About Us Advertising Help Center

          White Label

          Broker API

          Data API

          Web Plug-ins

          Affiliate Program

          Awards Institution Evaluation IB Seminar Salon Event Exhibition
          Vietnam Thailand Singapore Dubai
          Fans Party Investment Sharing Session
          FastBull Summit BrokersView Expo

          Forex Effective vs Realised Spread: Why a Negative Figure Is Not a Cash Refund

          Patrick Turner
          Summary:

          Rebuild quoted, effective and later-midpoint forex spread measures from signed EUR/USD fills. A negative realised spread can coexist with USD 4 of actual net profit; timestamps, doubling conventions and cash entries explain the difference.

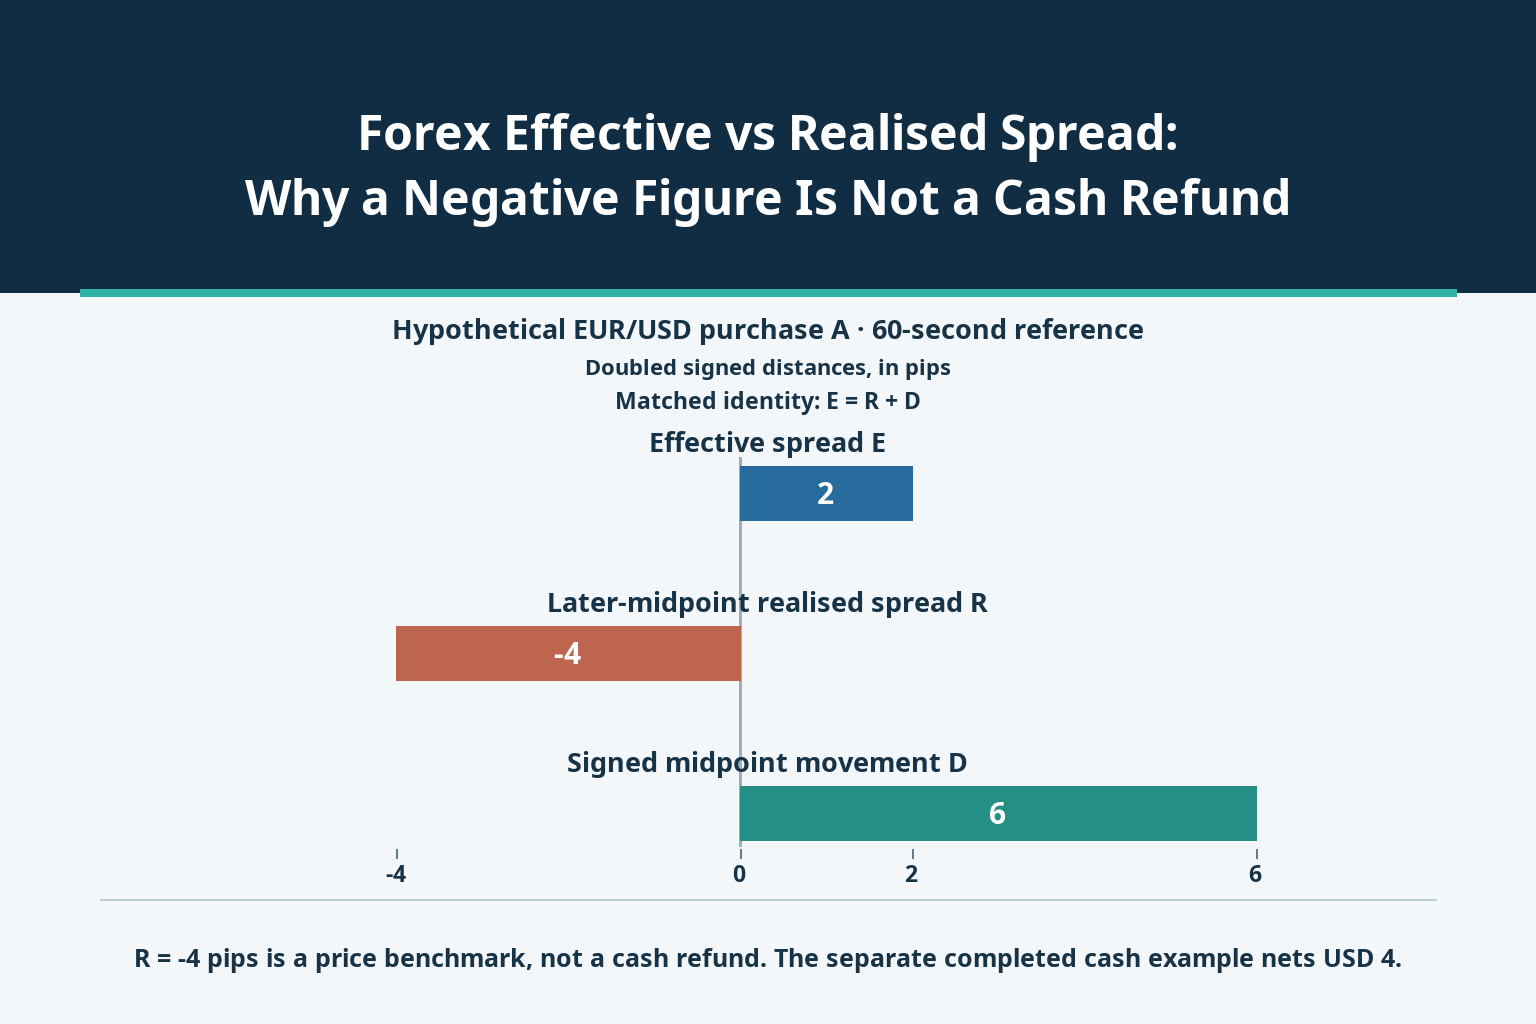
          A forex execution report can show a negative realised spread without paying the customer a refund. The statistic compares a fill with a later reference midpoint. It is not the cash result of buying and then selling currency. In the worked example below, a realised spread of −4 pips accompanies a separate completed trade earning USD 4 after commission. Multiplying that statistic by pip value would produce the wrong account result.

          Three questions keep the report useful: which midpoint and timestamp were used, whether the price distance was doubled, and whether the figure describes a fill benchmark or actual cash. Reconstruct those choices before comparing providers or interpreting a negative sign. The illustrative observations are invented, not market prices or a trading signal.
          Forex Effective vs Realised Spread: Why a Negative Figure Is Not a Cash Refund_1

          Define the quote, the fill and the unit separately

          Use EUR/USD in USD per EUR and define one pip as 0.0001 USD per EUR. A bid of 1.09990 and ask of 1.10010 have midpoint 1.10000 and quoted spread 2 pips. Buying at 1.10010 is a one-pip distance above that midpoint. Under the doubled-distance convention used here, its effective spread is 2 pips. That does not turn one purchase into two cash transactions.

          Let P be the actual fill price, M0 the latest valid midpoint from the designated quote source immediately before that fill, and Mh the same source’s midpoint 60 seconds after the fill. Set s=+1 when the client buys EUR and s=−1 when the client sells EUR. These directions refer to the base currency; reversing them reverses the signed calculation.

          Our chosen pip definitions are E=2s(P−M0)/0.0001, R=2s(P−Mh)/0.0001 and D=2s(Mh−M0)/0.0001. E is effective spread, R the later-midpoint realised-spread measure and D matched signed midpoint movement. With these identical references, E=R+D. D is an accounting decomposition of prices, not proof that this trade caused the subsequent market move.

          A report using one-sided distance, percentages, basis points or another horizon must be normalised first. The 60-second horizon and doubled pip convention are explicit assumptions, not requirements imposed on all forex reports. A relative measure divides by a reference exchange rate; a pip measure does not.

          Reproduce three independent fills before taking an average

          The following observations occur independently at 10:00, 10:05 and 10:10 UTC. Each has its own immediate pre-fill quote and its own 60-second follow-up. All initial midpoints are 1.10000; assume the same initial bid and ask given above, sufficient available quantity and a matching value date. Observation C receives a fill inside that quoted spread.

          FillClient actionEURPM0M60
          ABuy1000001.100101.100001.10030
          BSell500001.099901.100001.09970
          CBuy500001.100051.100001.09995

          For A, the purchase is one pip above M0 but two pips below the later midpoint. Thus E=2, R=−4 and D=6 pips. For B, retain s=−1: the sale is one pip below the initial midpoint and two pips above the later midpoint, giving the same signed results. C instead gives E=1, R=2 and D=−1.

          Fill / averageE, pipsR, pipsD, pips
          A2−46
          B2−46
          C12−1
          Quantity weighted1.75−2.504.25

          Weight by gross EUR filled quantity: 100000, 50000 and 50000, a total of 200000. The resulting E is 1.75 pips, R −2.50 and D 4.25; 1.75=−2.50+4.25. Do not net purchases against sales to create a smaller denominator. These observations are not a sequence forming one closed position.

          This average also differs from how the weighting of quoted forex spreads changes an average. A quote-history average need not contain actual fills at all. An effective-spread average requires fill prices and directions, while a later-midpoint measure additionally requires a defined follow-up price for each observation.

          Use an actual exit to calculate account profit

          Now consider a separate completion of A: buy EUR 100000 at 1.10010 and actually sell all of it 60 seconds later at the executable bid of 1.10020. A matching ask of 1.10040 gives the assumed later midpoint 1.10030. The gross cash gain is 100000×(1.10020−1.10010)=USD 10.

          Assume USD 6 of total posted commission and no financing, tax or currency conversion. Net profit is USD 4. The −4-pip R statistic is neither a USD 40 rebate nor the customer’s realised profit. Its midpoint is not the sale price; its doubled normalisation is not a cash amount.

          Likewise, E=2 pips should not be multiplied by this quantity’s USD 10 pip value and booked as USD 20 of one-way midpoint cost. The actual purchase’s one-sided midpoint deviation is one pip, or USD 10. When calculating profit from actual entry and exit prices, the bid–ask effects are already in those prices; do not subtract them again.

          Without an actual exit, only a benchmark comparison has been calculated. Nor does R reveal the counterparty’s actual profit: its hedging time, offset price, inventory and fees are unknown. A negative value alone proves neither a rebate nor misconduct.

          Change the clock and the statistic can change sign

          Keep A’s fill fixed. If the midpoint after 30 seconds is 1.10020, R is −2 and D 4. At 60 seconds, R is −4 and D 6. If the midpoint after 300 seconds is 1.09980, R becomes 6 and D −4. E stays 2 in all three cases. Choosing a later snapshot changes the statistic without recording another execution.

          A stale initial reference causes a different problem. Suppose a 09:59:59 UTC midpoint of 1.09980 remains in one data stream although the valid immediate pre-fill midpoint at 10:00:00 is 1.10000. Applying that old value to the unchanged 1.10010 purchase produces E=6 rather than 2 pips. The fill and cash have not changed; the benchmark has.

          Match source, timezone, timestamp precision and quote age. Do not take a future quote as the pre-fill reference. Order receipt, order executability and execution are different events; subtracting metrics anchored to different events need not recover the matched D above. A daily reference fixing or a forward quote for another value date is not a substitute for the stated spot quote stream.

          Know when a comparison or identity stops being valid

          The identity requires the same observations, initial references, horizon, directional signs, units and weights in all three averages. If a later quote is missing, mark it missing. Do not enter zero as R, silently carry forward an old quote or compare its reduced sample with the complete E sample. Publish coverage counts alongside any comparable subset.

          Keep signed observations when the definition calls for them. Taking absolute values removes price-improvement information and changes the measure. A negative E may reflect a fill better than the chosen midpoint, but stale data, wrong direction or a mismatched quote can create the same appearance. Inspect the underlying observations before interpreting the sign.

          A filled-only sample says nothing by itself about rejected requests or unfilled currency requirements. Nor can a midpoint comparison prove the reference quote was executable for the customer’s size, credit arrangement or product. Different horizons and currency pairs should not be pooled merely because every output is called spread.

          Audit the report and the cash ledger in two linked passes

          First obtain the exact method: currency quotation, pip unit, client direction, quote source, initial event, follow-up horizon, doubling factor, weighting and missing-data policy. Retain execution IDs, quantities, timestamps and the quote records used. If those fields cannot be obtained, the displayed statistic cannot yet be reproduced.

          Then calculate E, R and D for each eligible fill, check their identity and aggregate the same gross quantities. Investigate a mismatch before rounding: different samples, clocks or units are more informative explanations than a provider ranking built from incompatible averages.

          In a separate cash pass, match actual entry and exit quantities and prices, commissions, financing and any conversion to statement entries. Only that pass establishes the completed trade’s net account result. Keep the two outputs side by side: benchmark distance diagnoses a price comparison; the cash ledger records what was paid or received.

          Risk Warnings and Disclaimers
          You understand and acknowledge that there is a high degree of risk involved in trading. Following any strategies or investment methods may lead to potential losses. The content on the site is provided by our contributors and analysts for information purposes only. You are solely responsible for determining whether any trading assets, securities, strategy, or any other product is suitable for investing based on your own investment objectives and financial situation.
          Add to Favorites
          Share
          FastBull
          Copyright © 2026 FastBull Ltd

          728 RM B 7/F GEE LOK IND BLDG NO 34 HUNG TO RD KWUN TONG KLN HONG KONG

          TelegramInstagramTwitterfacebooklinkedin
          App Store Google Play Android Windows
          Products
          Charts

          Chats

          Q&A with Experts
          Screeners
          Economic Calendar
          Data
          Tools
          Membership
          Features
          Function
          Markets
          Copy Trading
          Latest Signals
          Contests
          24/7
          Analysis
          Education
          Company
          Careers
          About Us
          Contact Us
          Advertising
          Download FastBull
          Help Center
          Feedback
          User Agreement
          Privacy Policy
          Personal Information Protection Statement
          Business

          White Label

          Broker API

          Data API

          Web Plug-ins

          Poster Maker

          Affiliate Program

          Risk Disclosure

          The risk of loss in trading financial instruments such as stocks, FX, commodities, futures, bonds, ETFs and crypto can be substantial. You may sustain a total loss of the funds that you deposit with your broker. Therefore, you should carefully consider whether such trading is suitable for you in light of your circumstances and financial resources.

          No decision to invest should be made without thoroughly conducting due diligence by yourself or consulting with your financial advisors. Our web content might not suit you since we don't know your financial conditions and investment needs. Our financial information might have latency or contain inaccuracy, so you should be fully responsible for any of your trading and investment decisions. The company will not be responsible for your capital loss.

          Without getting permission from the website, you are not allowed to copy the website's graphics, texts, or trademarks. Intellectual property rights in the content or data incorporated into this website belong to its providers and exchange merchants.

          Not Logged In

          Log in to access more features

          Connect Broker
          Become a signal provider
          Help Center
          Customer Service
          Dark Mode
          Price Up/Down Colors

          Log In

          Sign Up

          Position
          Layout
          Fullscreen
          Default to Chart
          The chart page opens by default when you visit fastbull.com