


- EURUSD
- XAUUSD
- XAGUSD
- WTI
- USDX


Markets
Analysis
User
24/7
Economic Calendar
Education
Data
- Names
- Latest
- Prev















One daily EUR/USD candle can rise while another falls without either feed being wrong. Rebuild both bars from the same timestamped quotes, separate display time from candle boundaries, and check daylight saving and completed bars before comparing signals.
Two daily charts of the same currency pair can show opposite candle bodies even when they use exactly the same prices. The first check is not which chart looks more convincing. It is whether the bars cover the same start and end times. A daily candle is a summary of a defined interval, not a universal label for what the market did on a calendar date.
The distinction matters for close-based signals, daily ranges and indicator inputs. Changing the cutoff can move a late-session rally from one candle to the next. It does not change the underlying price path, and it does not by itself establish that one chart is wrong.
A price event has a timestamp. A chart displays that timestamp in a chosen time zone. A candle-construction rule decides which events belong in each bar. Those are three separate jobs. A display option may relabel the horizontal axis without rebuilding daily or four-hour candles; verify its actual effect rather than assuming a new time label means a new price interval.
For a reproducible comparison, specify the currency pair and price side, the source, the interval start and end, the time zone used to determine those boundaries, and whether the candle is complete. Also check whether its date label denotes the start or the end. Two candles both labelled Tuesday can include different hours.
The standard unsmoothed calculation takes the first observed price as the open, the highest and lowest as the extremes, and the last as the close. Aligning the interval makes those summaries comparable, but OHLC still cannot establish whether a stop or a profit target was reached first within the candle. For that separate backtest check, see checking which exit occurs first when one forex candle reaches both stop and target.
The following nine EUR/USD bid observations are a deliberately constructed teaching dataset. Treat them as the entire observed stream for this example: there are no omitted intervening quotes. They are not actual market prices or a claim that a live market was inactive between the rows. One pip in this example is 0.0001 dollars per euro.
| Hypothetical UTC timestamp, 2026 | EUR/USD bid |
|---|---|
| Jan 12 22:00 | 1.1000 |
| Jan 12 23:00 | 1.1040 |
| Jan 13 00:00 | 1.1030 |
| Jan 13 06:00 | 1.0980 |
| Jan 13 12:00 | 1.1010 |
| Jan 13 21:59 | 1.1020 |
| Jan 13 22:00 | 1.1050 |
| Jan 13 23:59 | 1.1010 |
| Jan 14 00:00 | 1.1005 |
Use left-inclusive, right-exclusive intervals: a quote exactly at the starting timestamp belongs to the bar, while one exactly at its ending timestamp belongs to the next bar. This prevents a boundary observation from being counted twice. In real work, exporting only a few selected quotes would not establish the true high or low.
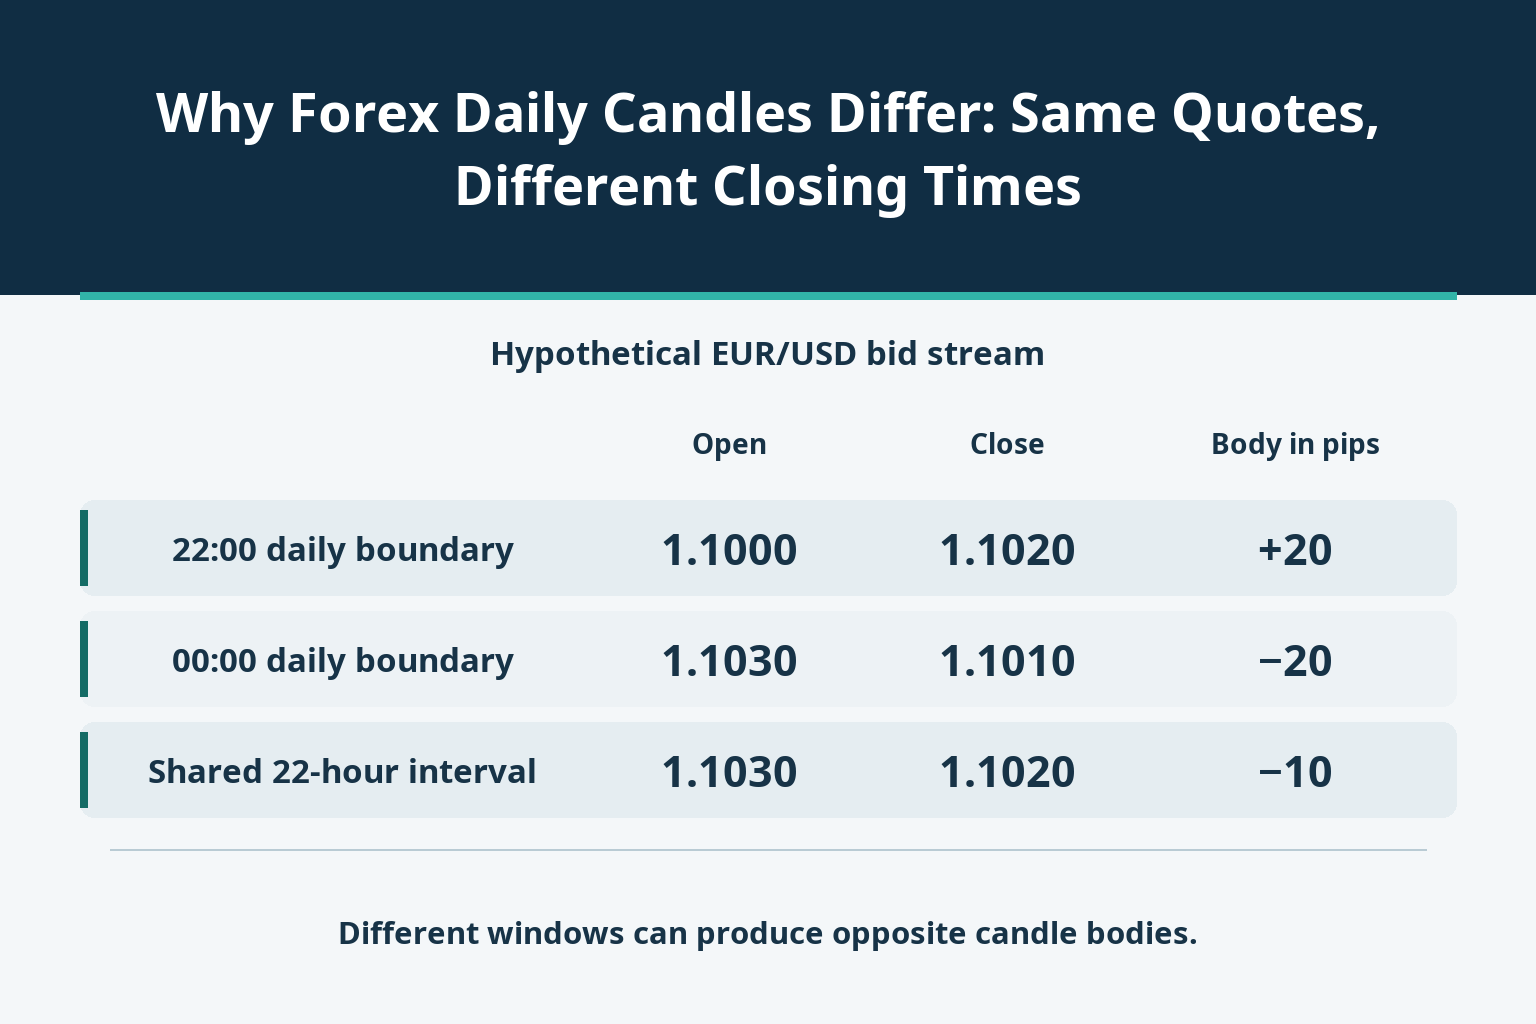
Rule A covers January 12 at 22:00 UTC through, but not including, January 13 at 22:00 UTC. Its six observations give an open of 1.1000, a high of 1.1040, a low of 1.0980 and a close of 1.1020. The body is +20 pips. The 1.1050 quote at the endpoint is excluded.
Rule B covers January 13 at 00:00 UTC through, but not including, January 14 at 00:00 UTC. Its six observations give 1.1030, 1.1050, 1.0980 and 1.1010. The body is −20 pips. This time the 1.1050 quote is included, but the next midnight quote of 1.1005 is excluded.
| Window, UTC; end excluded | Open | High | Low | Close | Body, pips |
|---|---|---|---|---|---|
| A: Jan 12 22:00 to Jan 13 22:00 | 1.1000 | 1.1040 | 1.0980 | 1.1020 | +20 |
| B: Jan 13 00:00 to Jan 14 00:00 | 1.1030 | 1.1050 | 1.0980 | 1.1010 | −20 |
| Shared: Jan 13 00:00 to 22:00 | 1.1030 | 1.1030 | 1.0980 | 1.1020 | −10 |
Both are valid 24-hour summaries of this dataset, but the windows overlap rather than coincide. The first closes two hours earlier. Their shared 22-hour interval produces the same −10-pip body whichever rule you started from. This intersection is not a complete daily candle. Candle color is not an account return, and comparing these two different windows does not prove that prices or trading profits disagree.
A cutoff specified as 17:00 in New York is not a permanent 22:00 UTC cutoff. Under the applicable standard-time and daylight-saving offsets it corresponds to 22:00 or 21:00 UTC. Apply the time-zone rule to each historical date. Using today’s fixed offset across a multi-year file can move an hour of prices into the wrong bar.
A fixed UTC cutoff and a fixed local-time cutoff are different specifications. The latter can produce a different elapsed interval around a clock change, while the available observations also depend on the product’s actual session. Do not create fictitious quotes just to make every bucket look equally full.
A short Sunday bar may similarly reflect a calendar boundary and the start of a trading session. Deleting it is not a universal repair. A lookback of 20 bars means 20 included bars; changing the treatment of a short session changes that sample. Define the rule first, retain the observations, and apply it consistently to research and live monitoring.
Time alignment isolates one source of disagreement; it does not make separate feeds identical. Bid, ask and midpoint bars can differ, as can instruments, missing observations, revisions and quote sources. A smoothed candle may use the previous close as its open instead of the first price in the new interval. Confirm that setting before treating an apparent gap as an error.
Relabelling an existing daily OHLC bar cannot reconstruct a different daily cutoff. You need finer observations that cover the new boundaries, with compatible price sides and reliable timestamps. If the only data available are daily summaries, the exact alternative high, low, open and close may be unrecoverable.
Nor should a completed bar be compared with a still-forming one. In the example, Rule A is complete at 22:00 UTC while Rule B still has two hours to run. A close-based decision using B cannot be treated as available at A’s closing time. Alignment is a data definition, not permission to move future information backward.
Save the pair, feed, price side, granularity, cutoff rule, historical time-zone convention and completion status. Convert event timestamps to one reference clock without discarding their original values. Check ordering, duplicates and missing intervals before aggregating anything.
Rebuild both bars from the same observations and test the endpoints explicitly. This example must return +20 pips for A, −20 for B and −10 for the common interval; including the right endpoint is a failed boundary test. For a live discrepancy, matching the original bars under their documented rules supports a timing explanation.
Then compare a common completed interval. If the difference disappears, the original bars were answering different time-window questions. If it remains, investigate the source, price side, smoothing, missing data and revisions instead of repeatedly changing the clock until the charts agree. Only after the price definitions match should you compare indicator or strategy results.

728 RM B 7/F GEE LOK IND BLDG NO 34 HUNG TO RD KWUN TONG KLN HONG KONG


The risk of loss in trading financial instruments such as stocks, FX, commodities, futures, bonds, ETFs and crypto can be substantial. You may sustain a total loss of the funds that you deposit with your broker. Therefore, you should carefully consider whether such trading is suitable for you in light of your circumstances and financial resources.
No decision to invest should be made without thoroughly conducting due diligence by yourself or consulting with your financial advisors. Our web content might not suit you since we don't know your financial conditions and investment needs. Our financial information might have latency or contain inaccuracy, so you should be fully responsible for any of your trading and investment decisions. The company will not be responsible for your capital loss.
Without getting permission from the website, you are not allowed to copy the website's graphics, texts, or trademarks. Intellectual property rights in the content or data incorporated into this website belong to its providers and exchange merchants.
Not Logged In
Log in to access more features


Log In
Sign Up


