• Trade
  • Markets
  • Copy
  • Contests
  • 24/7
  • Calendar
  • Q&A
  • Chats
Screeners
SYMBOL
LAST
BID
ASK
HIGH
LOW
NET CHG.
%CHG.
SPREAD
SOURCE
SPX
S&P 500 Index
7541.40
7541.40
7541.40
7662.23
7539.38
-38.67
-0.51%
--
--
DJI
Dow Jones Industrial Average
51983.98
51983.98
51983.98
52424.91
51981.66
+213.67
+ 0.41%
--
--
IXIC
NASDAQ Composite Index
25164.31
25164.31
25164.31
25799.46
25145.95
-272.68
-1.07%
--
--
USDX
US Dollar Index
101.585
101.585
101.665
101.727
101.448
-0.058
-0.06%
--
--
EURUSD
Euro / US Dollar
1.11932
1.11932
1.11939
1.12062
1.11747
+0.00070
+ 0.06%
--
--
GBPUSD
Pound Sterling / US Dollar
1.34188
1.34188
1.34200
1.34311
1.33957
+0.00135
+ 0.10%
--
--
XAUUSD
Gold / US Dollar
3961.81
3961.81
3962.24
3971.05
3895.34
+15.04
+ 0.38%
--
--
WTI
Light Sweet Crude Oil
94.134
94.134
94.164
97.883
92.913
-1.196
-1.25%
--
--

Community Accounts

Signal Accounts
--
Profit Accounts
--
Loss Accounts
--
View More

Become a signal provider

Sell trading signals to earn additional income

View More

Guide to Copy Trading

Get started with ease and confidence

View More

Signal Accounts for Members

All Signal Accounts

Best Return
  • Best Return
  • Best P/L
  • Best MDD
Past 1W
  • Past 1W
  • Past 1M
  • Past 1Y

All Contests

  • All
  • Recommend
  • Stocks
  • Cryptocurrencies
  • Central Banks
  • Trump Updates
  • Featured News
Top News Only
Share

US President Trump: We Should Get More Benefits From Iran Than From Venezuela

Share

Zelensky Stated That Russia Has No Advantage On The Front Lines

Share

US President Trump: Iran Is In The State We Want It To Be In, And We Can Still Launch More Strikes Against It If We Decide To Take Action

Share

The Most Active Polypropylene Futures Contract Fell 2% Intraday, Currently Trading At 10,005.00 Yuan

Share

The Egyptian President Called On Iran To Engage In Dialogue With The United States, Enhance Mutual Understanding, And Reach A Political Solution

Share

The Ukrainian Agricultural Committee (UAC), A Lobbying Group Of Ukrainian Farmers, Said That Ukraine's Grain Exports Remained Stable At 3 Million Tons In October

Share

Merz, Germany: (On The Miami G20 Meeting) It Is Unacceptable For The Ukraine Issue To Be Discussed By Third-party Countries In Ukraine's Absence

Share

Ukrainian President Zelensky: Russia's Invitation To Me To Visit Moscow Is "destructive"

Share

The Main Palm Oil Contract Fell Below 9,000 Yuan/ton, Down 2.66% On The Day

Share

The Main Contract For Low-sulfur Fuel Oil Fell 7% Intraday, Currently Trading At 5360.00 Yuan

Share

Munich Prosecutors Raided The Offices Of Deutsche Bank

Share

Market Sources Say That The Relevant Announcements Will Be Released In Stages And Simultaneously, According To Sources Close To The US-Iran Negotiating Teams

Share

Peskov Said It Is Unclear Who Will Represent The Russian Federation At The November 5 Meeting With Melania Trump

Share

Moody's Upgraded Nokia's Rating To Baa3 With A Positive Outlook

Share

The Main Ethylene Glycol (EG) Contract Fell By More Than 2%, Currently Trading At 5,117 Yuan/ton; The Average Monthly Price Of The Main Polypropylene (PP) Contract Fell By More Than 2%, Currently Trading At 9,316 Yuan/ton

Share

The Shanghai Crude Oil Futures Contract Fell 5% Intraday, Currently Trading At 660.00 Yuan

Share

The Most Active Methanol Futures Contract Fell 3% Intraday, Currently Trading At 3343.00 Yuan

Share

Brent Crude Oil Fell Below $101 Per Barrel, Down 3.67% On The Day

Share

The Most Active Ethylene Glycol Futures Contract Fell 2% Intraday, Currently Trading At 5117.00 Yuan

Share

German Chancellor Merz Said At A Meeting In Abu Dhabi: Russia Must Take The Ceasefire And Subsequent Peace Agreement Seriously

TIME
ACT
FCST
PREV
IMPACT
China, Mainland Caixin Manufacturing PMI (SA) (Oct)

A:--

F: --

P: --

XAUUSD
  • XAUUSD
  • XAGUSD
  • WTI
  • USDX
Indonesia Inflation Rate YoY (Oct)

A:--

F: --

P: --

XAUUSD
  • XAUUSD
  • XAGUSD
  • WTI
  • USDX
Indonesia Trade Balance (Sept)

A:--

F: --

P: --

XAUUSD
  • XAUUSD
  • XAGUSD
  • WTI
  • USDX
Indonesia Core Inflation YoY (Oct)

A:--

F: --

P: --

XAUUSD
  • XAUUSD
  • XAGUSD
  • WTI
  • USDX
India HSBC Manufacturing PMI Final (Oct)

A:--

F: --

P: --

XAUUSD
  • XAUUSD
  • XAGUSD
  • WTI
  • USDX
Australia Commodity Price YoY (Oct)

A:--

F: --

P: --

AUDUSD
  • AUDUSD
  • XAUUSD
  • XAGUSD
  • WTI
  • USDX
Russia IHS Markit Manufacturing PMI (Oct)

A:--

F: --

P: --

WTI
  • WTI
  • XAUUSD
  • XAGUSD
  • USDX
Germany Actual Retail Sales MoM (Sept)

A:--

F: --

P: --
EURUSD
  • EURUSD
  • XAUUSD
  • XAGUSD
  • WTI
  • USDX
Turkey Manufacturing PMI (Oct)

A:--

F: --

P: --

XAUUSD
  • XAUUSD
  • XAGUSD
  • WTI
  • USDX
Italy Manufacturing PMI (SA) (Oct)

A:--

F: --

P: --

EURUSD
  • EURUSD
  • XAUUSD
  • XAGUSD
  • WTI
  • USDX
South Africa Manufacturing PMI (Oct)

A:--

F: --

P: --

XAUUSD
  • XAUUSD
  • XAGUSD
  • WTI
  • USDX
Euro Zone Manufacturing PMI Final (Oct)

A:--

F: --

P: --

EURUSD
  • EURUSD
  • XAUUSD
  • XAGUSD
  • WTI
  • USDX
U.K. Manufacturing PMI Prelim (Oct)

A:--

F: --

P: --

GBPUSD
  • GBPUSD
  • XAUUSD
  • XAGUSD
  • WTI
  • USDX
Canada National Economic Confidence Index

A:--

F: --

P: --

USDCAD
  • USDCAD
  • XAUUSD
  • XAGUSD
  • WTI
  • USDX
Canada Manufacturing PMI (SA) (Oct)

A:--

F: --

P: --

USDCAD
  • USDCAD
  • XAUUSD
  • XAGUSD
  • WTI
  • USDX
U.S. IHS Markit Manufacturing PMI Final (Oct)

A:--

F: --

P: --

USDX
  • USDX
  • XAUUSD
  • XAGUSD
  • WTI
U.S. ISM Inventories Index (Oct)

A:--

F: --

P: --

USDX
  • USDX
  • XAUUSD
  • XAGUSD
  • WTI
U.S. Construction Spending MoM (Sept)

A:--

F: --

P: --
USDX
  • USDX
  • XAUUSD
  • XAGUSD
  • WTI
U.S. ISM Output Index (Oct)

A:--

F: --

P: --

USDX
  • USDX
  • XAUUSD
  • XAGUSD
  • WTI
U.S. ISM Manufacturing Employment Index (Oct)

A:--

F: --

P: --

USDX
  • USDX
  • XAUUSD
  • XAGUSD
  • WTI
U.S. ISM Manufacturing PMI (Oct)

A:--

F: --

P: --

USDX
  • USDX
  • XAUUSD
  • XAGUSD
  • WTI
U.S. ISM Manufacturing New Orders Index (Oct)

A:--

F: --

P: --

USDX
  • USDX
  • XAUUSD
  • XAGUSD
  • WTI
South Korea CPI YoY (Oct)

A:--

F: --

P: --

XAUUSD
  • XAUUSD
  • XAGUSD
  • WTI
Australia Overnight (Borrowing) Key Rate

A:--

F: --

P: --

AUDUSD
  • AUDUSD
  • XAUUSD
  • XAGUSD
  • WTI
  • USDX
RBA Rate Statement
Saudi Arabia IHS Markit Composite PMI (Oct)

A:--

F: --

P: --

WTI
  • WTI
  • XAUUSD
  • XAGUSD
  • USDX
RBA Press Conference
Turkey CPI YoY (Oct)

A:--

F: --

P: --

XAUUSD
  • XAUUSD
  • XAGUSD
  • WTI
  • USDX
Turkey PPI YoY (Oct)

A:--

F: --

P: --

XAUUSD
  • XAUUSD
  • XAGUSD
  • WTI
  • USDX
Brazil IHS Markit Manufacturing PMI (Oct)

A:--

F: --

P: --

XAUUSD
  • XAUUSD
  • XAGUSD
  • WTI
  • USDX
U.S. Weekly Redbook Index YoY

A:--

F: --

P: --

XAUUSD
  • XAUUSD
  • XAGUSD
  • WTI
  • USDX
U.S. JOLTS Job Openings (SA) (Sept)

--

F: --

P: --

U.S. Factory Orders MoM (Sept)

--

F: --

P: --

U.S. Factory Orders MoM (Excl. Transport) (Sept)

--

F: --

P: --

U.S. Factory Orders MoM (Excl. Defense) (Sept)

--

F: --

P: --

Mexico Manufacturing PMI (Oct)

--

F: --

P: --

U.S. API Weekly Crude Oil Stocks

--

F: --

P: --

U.S. API Weekly Cushing Crude Oil Stocks

--

F: --

P: --

U.S. API Weekly Gasoline Stocks

--

F: --

P: --

U.S. API Weekly Refined Oil Stocks

--

F: --

P: --

Australia Services PMI Prelim (Oct)

--

F: --

P: --

Japan Monetary Base YoY (SA) (Oct)

--

F: --

P: --

China, Mainland Caixin Composite PMI (Oct)

--

F: --

P: --

China, Mainland Caixin Services PMI (Oct)

--

F: --

P: --

India HSBC Services PMI Final (Oct)

--

F: --

P: --

India IHS Markit Composite PMI (Oct)

--

F: --

P: --

Italy Services PMI (SA) (Oct)

--

F: --

P: --

Italy Composite PMI (Oct)

--

F: --

P: --

Germany Composite PMI Final (SA) (Oct)

--

F: --

P: --

Euro Zone Services PMI Final (Oct)

--

F: --

P: --

Euro Zone Composite PMI Final (Oct)

--

F: --

P: --

U.K. Services PMI Prelim (Oct)

--

F: --

P: --

U.K. Official Reserves Changes (Oct)

--

F: --

P: --

U.K. Composite PMI Prelim (Oct)

--

F: --

P: --

Euro Zone Core CPI Prelim YoY (Oct)

--

F: --

P: --

Euro Zone Core CPI Prelim MoM (Oct)

--

F: --

P: --

Euro Zone HICP Prelim YoY (Oct)

--

F: --

P: --

U.S. MBA Mortgage Application Activity Index WoW

--

F: --

P: --

Mexico Consumer Confidence Index (Oct)

--

F: --

P: --

U.S. ADP Employment (Oct)

--

F: --

P: --

ECB Chief Economist Lane Speaks
Q&A with Experts
    • All
    • Chatrooms
    • Groups
    • Friends
    SlowBear ⛅ flag
    Faburama Bojang
    @SlowBear ⛅ Hahahaha you are really grinding Gold today lol
    @Faburama Bojang I mean i had to follow the laders you know, the spatan is on the clock
    SlowBear ⛅ flag
    Faburama Bojang
    @SlowBear ⛅@SlowBear ⛅You are buying again
    @Faburama BojangYes i bought again and now i am gonna rest after that TP or TS at 1%!
    SlowBear ⛅ flag
    Benjamin Tailor
    btc & gold market update plz
    @Benjamin TailorWell BTC and Gold are currently in a short term correction so you can wait or join the pump run
    EuroTrader flag
    favour
    @EuroTraderlol.. enough with the hype brother, still got a long way to go.. 👌
    @favouri get but just check previous months top winners to see what percentage made them winners and make them enter top 5
    favour flag
    EuroTrader
    @favouri cant see anything on the news aspect that means this was purely technical and a reaction to market open
    @EuroTraderexactly, am not focused oñ the fundamentals.. just technicals..
    Jeric Soli flag
    Jeric Soli flag
    B&W
    @Jeric Solitp berapa
    @B&W
    favour flag
    EuroTrader
    @favouri get but just check previous months top winners to see what percentage made them winners and make them enter top 5
    @EuroTraderokay lemme check now .
    Sanjeev Ku flag
    now 3965
    Nawhdir flag
    01:14
    Nawhdir flag
    01:14
    B&W flag
    Jeric Soli
    @B&W
    @Jeric Solibaik
    favour flag
    favour
    @EuroTraderokay lemme check now .
    @EuroTraderwell first rank was up 277.69%
    Jeremiah K flag
    look how gold has bought
    SlowBear ⛅ flag
    Jeremiah K
    look how gold has bought
    @Jeremiah K i mean Gold was so bought that even buyers are scared of themselves
    SlowBear ⛅ flag
    SlowBear ⛅ flag
    SlowBear ⛅
    @Jeremiah K its a good day to buy Gold now i am going to rest!
    Benjamin Tailor flag
    when we can buy again?🤭
    Nawhdir flag
    be patient Basalamah.
    Benjamin Tailor flag
    ok sir
    Type here...
    Add Symbol or Code

      No matching data

      All
      Recommend
      Stocks
      Cryptocurrencies
      Central Banks
      Trump Updates
      Featured News
      • All
      • Russia-Ukraine Conflict
      • Middle East Flashpoint
      • All
      • Russia-Ukraine Conflict
      • Middle East Flashpoint
      Search
      Products

      Charts Free Forever

      Chats Q&A with Experts
      Screeners Economic Calendar Data Tools
      Membership Features
      Data Warehouse Market Trends Institutional Data Policy Rates Macro

      Market Trends

      Market Sentiment Order Book Forex Correlations

      Top Indicators

      Charts Free Forever
      Markets

      News

      24/7 Analysis Education

      Latest Views

      Latest Update

      Signals

      Copy Rankings Latest Signals Become a signal provider AI Rating
      Contests
      Brokers

      Overview Brokers Assessment Rankings Regulators News Claims
      Broker listing Forex Brokers Comparison Tool Live Spread Comparison Scam
      Q&A Complaint Scam Alert Videos Tips to Detect Scam
      More

      Business
      Events
      Careers About Us Advertising Help Center

      White Label

      Broker API

      Data API

      Web Plug-ins

      Affiliate Program

      Awards Institution Evaluation IB Seminar Salon Event Exhibition
      Vietnam Thailand Singapore Dubai
      Fans Party Investment Sharing Session
      FastBull Summit BrokersView Expo
      Recent Searches
        Top Searches
          Markets
          Analysis
          User
          24/7
          Economic Calendar
          Education
          Data
          • Names
          • Latest
          • Prev

          View All

          No data

          Scan to Download

          Faster Charts, Chat Faster!

          Download
          English
          • English
          • Español
          • العربية
          • Bahasa Indonesia
          • Bahasa Melayu
          • Tiếng Việt
          • ภาษาไทย
          • Français
          • Italiano
          • Türkçe
          • Русский язык
          • 简中
          • 繁中
          Open Account
          Search
          Products
          Charts Free Forever
          Markets
          News
          Signals

          Copy Rankings Latest Signals Become a signal provider AI Rating
          Contests
          Brokers

          Overview Brokers Assessment Rankings Regulators News Claims
          Broker listing Forex Brokers Comparison Tool Live Spread Comparison Scam
          Q&A Complaint Scam Alert Videos Tips to Detect Scam
          More

          Business
          Events
          Careers About Us Advertising Help Center

          White Label

          Broker API

          Data API

          Web Plug-ins

          Affiliate Program

          Awards Institution Evaluation IB Seminar Salon Event Exhibition
          Vietnam Thailand Singapore Dubai
          Fans Party Investment Sharing Session
          FastBull Summit BrokersView Expo

          Why Realised Forex Profit Can Exceed Your Total Gain: Reconcile Average Entry and Partial Closures

          James Riley
          Summary:

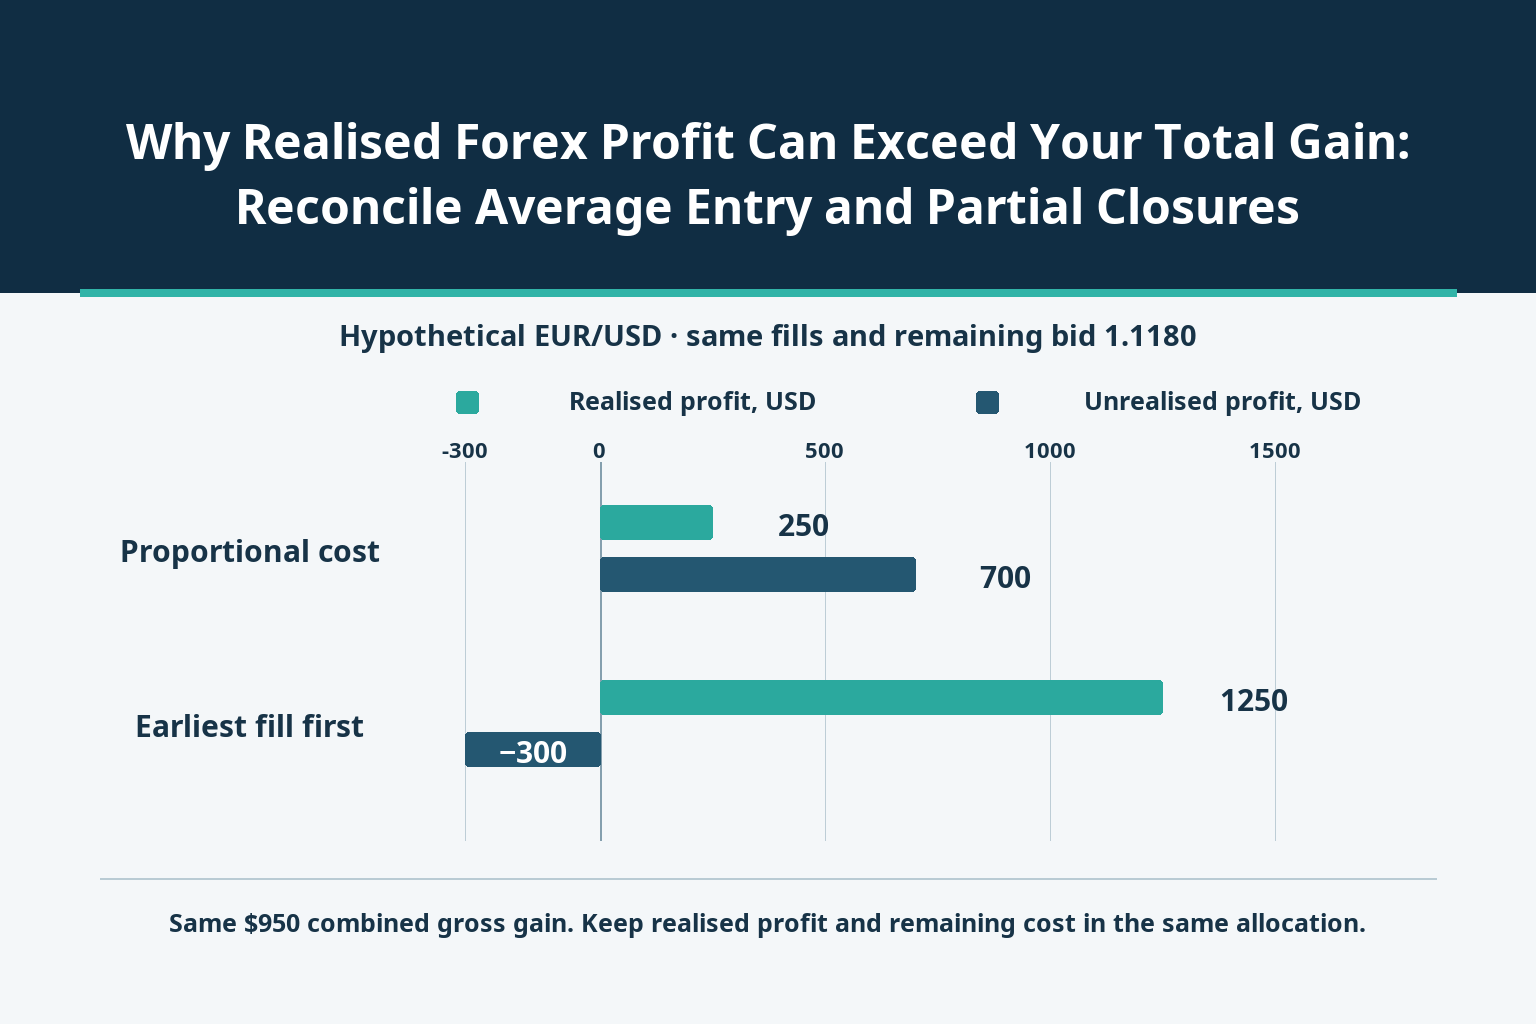
          The same forex fills can show a realised gain of $250 or $1,250 under different cost allocations, while the combined gain remains $950. Rebuild executed quantities, remaining cost and current bid before comparing statement figures.

          A profitable partial closure does not tell you how much your entire forex position has earned. Part of the result remains in the open quantity, and the realised figure depends on the entry cost assigned to the quantity that was closed. Compare the realised and unrealised amounts together, using the same allocation and valuation time.

          In the hypothetical EUR/USD example below, identical executions and an identical remaining bid produce either $250 or $1,250 of realised profit under two explicitly different cost allocations. Both give a combined gross gain of $950. Mixing the larger realised gain with the other allocation’s floating gain invents another $1,000. The purpose is to reconcile a statement, not to choose a reporting policy or recommend adding to a position.
          Why Realised Forex Profit Can Exceed Your Total Gain: Reconcile Average Entry and Partial Closures_1

          Start with executed quantities, not the number of orders

          Assume a USD account and a linear EUR/USD position, with prices expressed as dollars per euro. The actual hypothetical opening fills are a purchase of 100,000 EUR at 1.1000 and a purchase of 200,000 EUR at 1.1200. A later sale closes 150,000 EUR at 1.1150. The remaining 150,000 EUR is marked at a contemporaneous executable bid of 1.1180.

          The final row of the table is a valuation, not another execution. Its $167,700 is not cash already received or a guaranteed future sale amount. Likewise, the opening dollar notionals are inputs to the price-profit calculation; a margined account need not pay the full $334,000 principal. Reserved margin, exchanged principal and profit are separate quantities.

          EventEUR quantityUSD/EUR priceUSD price-equivalent
          Opening buy fill100,0001.1000110,000
          Additional buy fill200,0001.1200224,000
          Actual partial closing sell150,0001.1150167,250
          Remaining long valuation; not a fill150,000Bid 1.1180167,700

          Use actual fills, including partial fills, rather than requested order sizes or one average per order. First establish that the sale really reduced this position. Account modes can treat opposite orders differently; how an opposite forex trade affects the existing position explains that preliminary check. Here the closure and the remaining long quantity are already confirmed.

          Weight the entry by euros actually bought

          The opening cost used for this calculation is 100,000×1.1000 + 200,000×1.1200 = $334,000 for 300,000 EUR. The volume-weighted entry is therefore 334,000/300,000 = 1.113333333… USD per EUR. Keep the fraction through the calculation and round only the displayed result.

          The simple average of the two prices is 1.1100. It gives the first, smaller fill the same weight as the second fill and implies an opening cost of only $333,000. That $1,000 understatement would overstate the combined gain by $1,000. This is an arithmetic error, not an alternative allocation policy.

          Weight in matching base-currency units. If a statement gives lots, first convert each fill using the applicable contract specification; do not assume all symbols or accounts use the same units per lot. Do not average EUR/USD entry prices with USD/JPY entries or with the reciprocal USD/EUR quote.

          A position line may aggregate several fills, while execution history lists each one separately. A rounded position price can be convenient for display but insufficient to reproduce cents. Obtain the underlying quantity and price precision before concluding that the broker’s arithmetic is wrong.

          Keep realised profit and the remaining basis in one allocation

          The partial sale’s dollar price-equivalent is 150,000×1.1150 = $167,250. Under an explicitly proportional weighted-cost illustration, half the opening quantity carries half the $334,000 basis: $167,000. The realised profit is $250. The remaining basis is also $167,000, so its $167,700 current valuation gives $700 unrealised profit.

          For comparison only, suppose a separate ledger allocates the earliest 100,000-EUR fill and 50,000 EUR of the second fill to the closure. The disposed basis is $110,000 + $56,000 = $166,000, giving $1,250 realised profit. The remaining 150,000 EUR retains $168,000 basis and therefore has a $300 unrealised loss at the same bid.

          Illustrative cost allocationRealised USDUnrealised USDCombined gross USD
          Proportional weighted cost250700950
          Hypothetical earliest fill first1,250−300950

          Both decompositions reproduce 167,250 + 167,700 − 334,000 = $950. The first allocation’s $250+$700 and the second’s $1,250−$300 are internally consistent. Combining $1,250 with $700 gives a false $1,950. These are hypothetical allocation comparisons, not a claim that every account offers either method, a tax rule, or permission to change the account’s contractual method.

          A positive realised gain can coexist with a total loss

          Change only the remaining executable bid to 1.1080. The first two purchases and the partial closing fill stay exactly as recorded. The remaining valuation becomes 150,000×1.1080 = $166,200. The combined result is now 167,250 + 166,200 − 334,000 = −$550.

          The proportional illustration still shows $250 realised, but now has an $800 unrealised loss. The hypothetical earliest-fill allocation still shows $1,250 realised, but its remaining unrealised loss is $1,800. Both totals are −$550. A closed-profit headline cannot establish whether the open strategy is ahead.

          The check changes when quantities, fills, valuation side, timestamp or charges differ. An identical-looking realised number from two statement screenshots is not evidence that their remaining exposure is identical. Nor does a different split by itself establish a hidden charge or an execution error.

          If the remaining 150,000 EUR is later actually sold at 1.1180, with no further charges, the fully closed gross result is $950 under either allocation. That is a conditional additional execution, not something already achieved by marking the open position at 1.1180.

          Reconcile equity after charges, separately from margin

          Return to the first checkpoint at bid 1.1180. Assume starting equity of $10,000, no deposits or withdrawals, no other positions and $120 of aggregate charges already posted. The net result is $950−$120 = $830, so equity is $10,830. The $120 is a separate explicit assumption, not a fee inferred from the allocation difference.

          After those same posted charges, the proportional ledger’s balance is 10,000+250−120 = $10,130; adding its $700 unrealised profit gives $10,830 equity. The alternative ledger’s balance is 10,000+1,250−120 = $11,130; subtracting its $300 floating loss gives the same equity. Balance and equity answer different questions.

          At the lower bid 1.1080, either ledger gives equity of 10,000−550−120 = $9,330. A larger balance does not remove the open loss. Reserved margin is not a trading expense to subtract again; it is a separate account constraint. Actual financing, commission or conversion charges must follow the statement’s posted and unposted treatment without double counting.

          The floating valuation still excludes any additional cost or slippage on a future closure unless the account explicitly includes it. If profit must be converted into a different account currency, add the actual conversion convention and rate as another reconciliation step. The USD-account example deliberately avoids that extra moving input.

          Audit one complete position history before comparing reports

          Export the executed deals for the entire position life, retaining IDs, timestamps, direction, base-currency quantities, prices, charges and links to the affected position. Separately record the remaining position, its cost allocation rule, bid or ask valuation side and exact valuation time. Report filters may omit an entry outside the selected dates; a visible closing deal alone cannot reconstruct its opening basis.

          Check quantity conservation first: 100,000+200,000−150,000 = 150,000 EUR remaining. Then check the entry numerator, disposed basis and retained basis: the last two must sum to the original $334,000. Finally reconcile realised plus unrealised profit to the $950 or −$550 direct quantity-price calculation, and only then reconcile equity after the separately identified charges.

          If a difference remains, ask for the specific missing input: a fill, an allocation, a valuation timestamp, a conversion or a posted adjustment. Keep order instructions, completed executions, floating marks and account cash movements distinct. A changed realised-profit line is meaningful only alongside its matching remaining quantity and cost.

          Risk Warnings and Disclaimers
          You understand and acknowledge that there is a high degree of risk involved in trading. Following any strategies or investment methods may lead to potential losses. The content on the site is provided by our contributors and analysts for information purposes only. You are solely responsible for determining whether any trading assets, securities, strategy, or any other product is suitable for investing based on your own investment objectives and financial situation.
          Add to Favorites
          Share
          FastBull
          Copyright © 2026 FastBull Ltd

          728 RM B 7/F GEE LOK IND BLDG NO 34 HUNG TO RD KWUN TONG KLN HONG KONG

          TelegramInstagramTwitterfacebooklinkedin
          App Store Google Play Android Windows
          Products
          Charts

          Chats

          Q&A with Experts
          Screeners
          Economic Calendar
          Data
          Tools
          Membership
          Features
          Function
          Markets
          Copy Trading
          Latest Signals
          Contests
          24/7
          Analysis
          Education
          Company
          Careers
          About Us
          Contact Us
          Advertising
          Download FastBull
          Help Center
          Feedback
          User Agreement
          Privacy Policy
          Personal Information Protection Statement
          Business

          White Label

          Broker API

          Data API

          Web Plug-ins

          Poster Maker

          Affiliate Program

          Risk Disclosure

          The risk of loss in trading financial instruments such as stocks, FX, commodities, futures, bonds, ETFs and crypto can be substantial. You may sustain a total loss of the funds that you deposit with your broker. Therefore, you should carefully consider whether such trading is suitable for you in light of your circumstances and financial resources.

          No decision to invest should be made without thoroughly conducting due diligence by yourself or consulting with your financial advisors. Our web content might not suit you since we don't know your financial conditions and investment needs. Our financial information might have latency or contain inaccuracy, so you should be fully responsible for any of your trading and investment decisions. The company will not be responsible for your capital loss.

          Without getting permission from the website, you are not allowed to copy the website's graphics, texts, or trademarks. Intellectual property rights in the content or data incorporated into this website belong to its providers and exchange merchants.

          Not Logged In

          Log in to access more features

          Connect Broker
          Become a signal provider
          Help Center
          Customer Service
          Dark Mode
          Price Up/Down Colors

          Log In

          Sign Up

          Position
          Layout
          Fullscreen
          Default to Chart
          The chart page opens by default when you visit fastbull.com