


- EURUSD
- XAUUSD
- XAGUSD
- WTI
- USDX




Markets
Analysis
User
24/7
Economic Calendar
Education
Data
- Names
- Latest
- Prev















An 80% lending revenue share is not an 80% investment return. Reconcile loan balances, agent charges and net income, then calculate the utilisation needed to offset an ETF’s higher fees without confusing collateral protection with guaranteed returns.
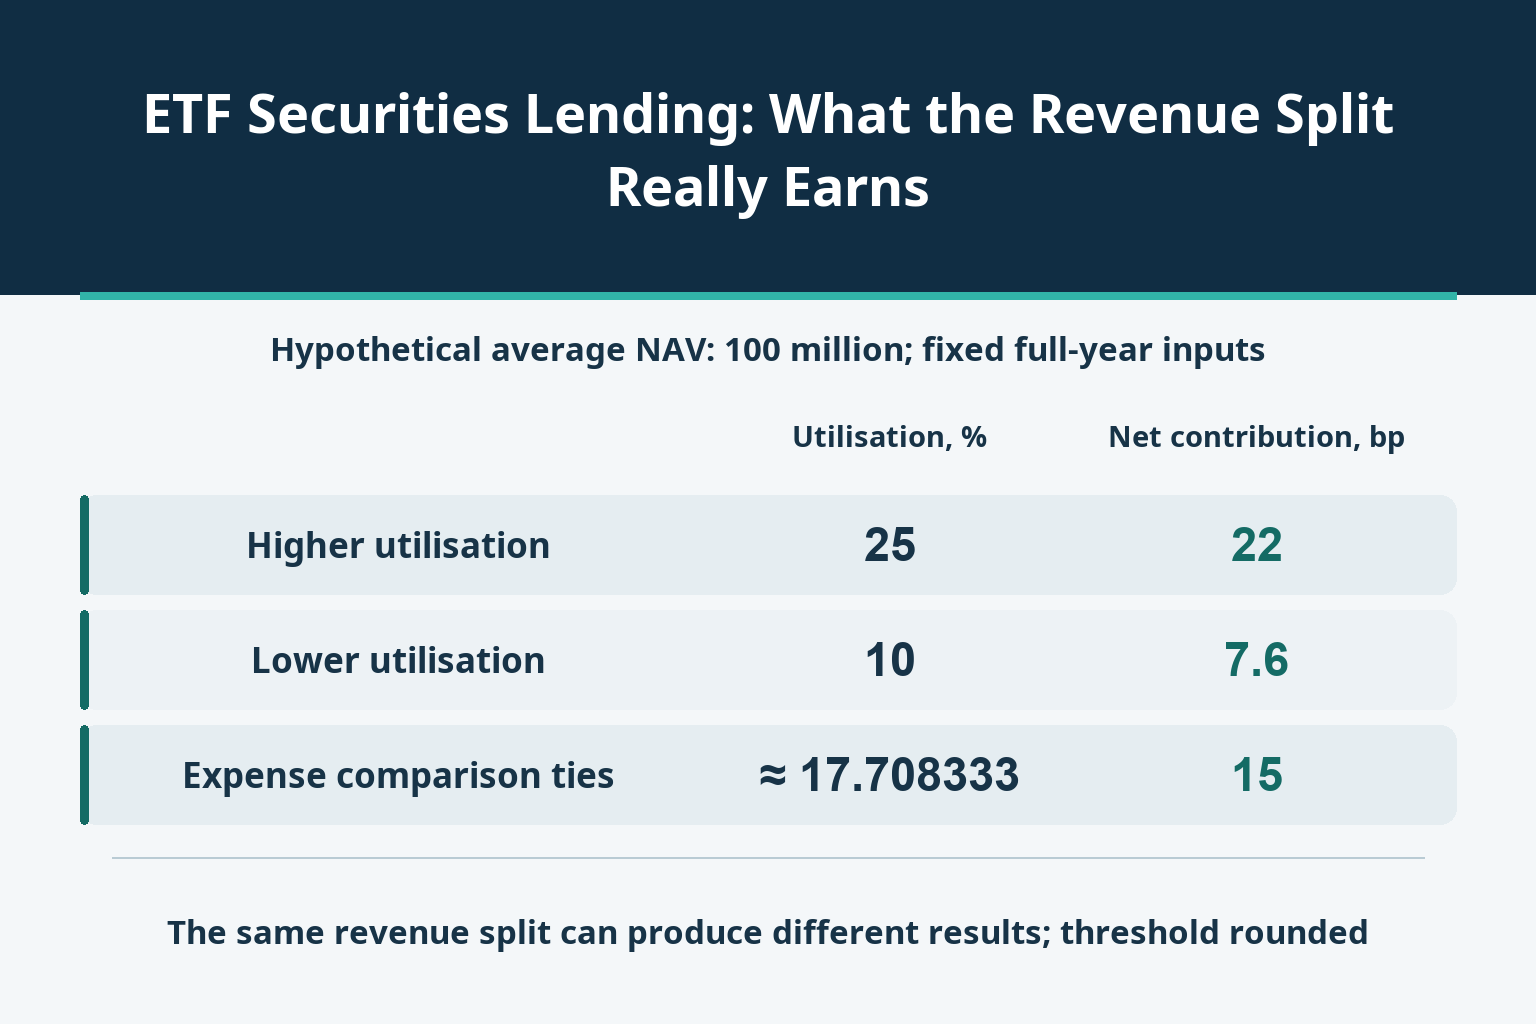
Two ETFs can retain 80% of their securities-lending revenue and deliver very different benefits to shareholders. In the example below, reducing lending utilisation from 25% to 10% cuts annual net income from 220,000 to 76,000. Against average fund net assets of 100 million, those amounts contribute 22 and 7.6 basis points—not anything resembling an 80% investment return.
The relevant test is the money left in the fund after lending costs, measured against the capital of the fund. A revenue split is one input into that calculation. It does not establish how much stock was borrowed, the fees it earned, or the losses a collateral arrangement might expose the fund to. A useful comparison follows that chain before ranking ETFs by their advertised expense ratios.
This is the perspective of an ETF shareholder whose fund lends portfolio securities. The borrower’s short-position profit, the shareholder’s ETF price return and the fund’s lending income are different accounts. A high annualised stock-borrow fee is not a yield available on every unit invested in the ETF.
The fund’s documents establish whether lending is permitted, who acts as lending agent, the collateral accepted and the compensation charged. Relevant US fund disclosures distinguish gross lending income, agent compensation, other charges and net income. That disclosure framework does not make every jurisdiction or lending agreement identical. In particular, the revenue base may differ between cash-collateral and noncash-collateral arrangements.
Build a bridge that adds up. If a reported figure is already net of the agent’s share, deducting that share again understates income. If only gross income is disclosed, calling it a shareholder benefit before checking the associated charges overstates it. An expense included within the agent’s split is not an additional expense merely because its name appears elsewhere in the documents.
Use one hypothetical currency throughout. Average fund NAV is 100 million, of which securities worth 80 million are available for lending. Define utilisation as the average value on loan divided by the value available for lending—not by the fund’s entire NAV. At 25% utilisation, the average loan balance is therefore 20 million, not 25 million.
For this first model, collateral is noncash. The annual loan fee is a constant 1.5% over one full year. The agent takes 20% of gross fee income and the fund keeps 80%. Separate annual costs of 20,000 are not included in that split. There is no cash-collateral reinvestment income, borrower rebate, default loss, tax or other cash flow. These are analytical assumptions, not the terms of a particular ETF.
Gross fees are 20 million × 1.5% = 300,000. After the agent’s 60,000 and the separate 20,000, net lending income is 220,000. Dividing by average NAV gives 0.22%, or 22 basis points. The 80% applies to revenue; the 22 basis points apply to fund capital.
| Lending utilisation | Average on loan, millions | Gross fees, thousands | Agent fee, thousands | Separate costs, thousands | Net income, thousands | NAV contribution, bp |
|---|---|---|---|---|---|---|
| 25% | 20 | 300 | 60 | 20 | 220 | 22 |
| 10% | 8 | 120 | 24 | 20 | 76 | 7.6 |
| 17/96 ≈ 17.708333% | 85/6 ≈ 14.166667 | 212.5 | 42.5 | 20 | 150 | 15 |
At 10% utilisation, only 8 million is on loan on average. Gross fees fall to 120,000, the agent receives 24,000 and the separate cost remains 20,000. Net income is 76,000, equivalent to 7.6 basis points of NAV. Utilisation has fallen 60%, but net income falls more because the independent cost does not shrink with revenue. An unchanged headline split offers no protection against that effect.
Suppose fund H charges 25 basis points a year and comparator J charges 10. J does not lend securities. To isolate the comparison, their underlying asset performance, average NAV, taxes and every other friction are identical. H’s stated 25-basis-point expense explicitly excludes the lending-specific charges already deducted above; otherwise the calculation would double-count them.
At 25% utilisation, H’s net lending contribution offsets 22 of its 25 basis points, leaving a three-basis-point drag. Against J’s ten, H is ahead by seven basis points on these specified items. At 10% utilisation, the residual drag is 17.4 basis points. H is now behind by 7.4. Neither the stated fee nor the revenue split changed, yet the comparison reversed.
| Separate case | H fund expense, bp | Net lending contribution, bp | H residual drag, bp | J drag, bp | H relative improvement, bp |
|---|---|---|---|---|---|
| 25% utilisation | 25 | 22 | 3 | 10 | 7 |
| 10% utilisation | 25 | 7.6 | 17.4 | 10 | −7.4 |
| 17/96 utilisation, approximately 17.708333% | 25 | 15 | 10 | 10 | 0 |
Let E be available securities, u utilisation, f the annual lending fee, s the fund’s revenue share and C separate annual costs. Then I = E × u × f × s − C. In currency units, this example becomes I = 960,000u − 20,000. Covering the 15-basis-point expense difference requires net income of at least 150,000, so u must reach 170,000/960,000 = 17/96, approximately 17.708333%.
The threshold row uses the exact fraction, not its rounded display. Equality only ties the expense comparison; higher utilisation produces an advantage under the stated assumptions. This is also not the lending operation’s own zero-income threshold. Merely covering its separate 20,000 cost requires u = 1/48, approximately 2.083333%. Positive lending income and enough income to beat a cheaper fund are different tests.
First, the 1.5% fee is earned on securities actually on loan, not on the entire 100-million portfolio. Second, 220,000 divided by the 20-million loan balance equals 1.1%, but that is not the contribution to the ETF’s overall return. For the shareholder-level expense comparison, the relevant denominator is the fund’s 100-million average NAV.
Third, full-year income divided by year-end NAV can be misleading when subscriptions or redemptions change the fund’s size. Match the reporting period and use an appropriate average asset base. For precise return attribution, account for timing and investor flows rather than treating one annual amount-to-average-assets ratio as an exact performance decomposition. The fixed-base example deliberately avoids that complication.
Real balances and fees also move together. A period with large balances may have low fees, while a scarce security commands a high fee on a small balance. Average loan balance multiplied by an independently calculated average fee need not reproduce actual gross income. Reconstruct each period’s balance × fee × year fraction and sum the results. If the revenue split has tiers, apply them to the relevant income and period rather than applying the year-end split to everything.
The income tables use noncash collateral. Consider a separate cash-collateral arrangement: 20 million of securities is lent against collateral of 102%, or 20.4 million. Average fund NAV is again 100 million. A 0.5% loss on that cash reinvestment portfolio is 102,000, equivalent to 10.2 basis points of fund NAV. The 102% is a hypothetical input, not a universal statutory protection level.
Assume the fund bears that loss and no other party reimburses it. Even if the borrower returns the securities on time, the cash investment loss does not vanish. Collateral comes with a return obligation; it is not additional shareholder capital available to spend. An indemnity covering a borrower-default shortfall need not cover losses from reinvesting cash collateral. The actual contract must answer that question.
Do not subtract this 102,000 from the first model’s 220,000 and present 118,000 as an ETF’s resulting profit. The collateral arrangements differ. A cash-collateral ledger must reconcile its own investment income, rebates, management fees and losses over the same period. The separate stress calculation demonstrates scale, not the performance of a composite product that does not exist.
Calling 25 minus 22 a three-basis-point residual drag is an attribution under explicit assumptions. It does not amend the fund’s published expense ratio or describe the shareholder’s complete return. Trading costs, market-price deviations from NAV, taxes, portfolio implementation and other effects remain outside that comparison.
Where lending income is already reflected in reported NAV and total return, adding it again double-counts the benefit. To place this income stream in context, distinguish ETF tracking difference from tracking error: the former compares net return with a benchmark, while the latter measures variation in return deviations. Lending is one possible contributor, not a substitute for either calculation.
Nor does a historical 22-basis-point contribution promise the same next year. Available assets, borrowing demand, fees, recalls, compensation and costs can all change. A larger revenue share can coincide with less net income if demand falls. State which assumptions support an apparent cost advantage and which changes would overturn it.
The useful conclusion is not “shareholders keep 80%, therefore lending is attractive.” It is how many basis points the fund retains under specified conditions—and how far those conditions can weaken before the claimed expense advantage disappears.

728 RM B 7/F GEE LOK IND BLDG NO 34 HUNG TO RD KWUN TONG KLN HONG KONG


The risk of loss in trading financial instruments such as stocks, FX, commodities, futures, bonds, ETFs and crypto can be substantial. You may sustain a total loss of the funds that you deposit with your broker. Therefore, you should carefully consider whether such trading is suitable for you in light of your circumstances and financial resources.
No decision to invest should be made without thoroughly conducting due diligence by yourself or consulting with your financial advisors. Our web content might not suit you since we don't know your financial conditions and investment needs. Our financial information might have latency or contain inaccuracy, so you should be fully responsible for any of your trading and investment decisions. The company will not be responsible for your capital loss.
Without getting permission from the website, you are not allowed to copy the website's graphics, texts, or trademarks. Intellectual property rights in the content or data incorporated into this website belong to its providers and exchange merchants.
Not Logged In
Log in to access more features


Log In
Sign Up


