• Trade
  • Markets
  • Copy
  • Contests
  • 24/7
  • Calendar
  • Q&A
  • Chats
Screeners
SYMBOL
LAST
BID
ASK
HIGH
LOW
NET CHG.
%CHG.
SPREAD
SOURCE
SPX
S&P 500 Index
7509.80
7509.80
7509.80
7530.72
7499.72
-9.31
-0.12%
--
--
DJI
Dow Jones Industrial Average
50657.90
50657.90
50657.90
50830.41
50487.16
+196.23
+ 0.39%
--
--
IXIC
NASDAQ Composite Index
26600.68
26600.68
26600.68
26715.31
26538.31
-55.49
-0.21%
--
--
USDX
US Dollar Index
99.140
99.140
99.220
99.170
98.850
+0.100
+ 0.10%
--
--
EURUSD
Euro / US Dollar
1.16261
1.16261
1.16268
1.16610
1.16221
-0.00051
-0.04%
--
--
GBPUSD
Pound Sterling / US Dollar
1.34217
1.34217
1.34227
1.34587
1.34162
-0.00244
-0.18%
--
--
XAUUSD
Gold / US Dollar
4451.00
4451.00
4451.41
4538.74
4401.39
-56.87
-1.26%
--
--
WTI
Light Sweet Crude Oil
88.646
88.646
88.676
92.421
86.769
-3.753
-4.06%
--
--

Community Accounts

Signal Accounts
--
Profit Accounts
--
Loss Accounts
--
View More

Become a signal provider

Sell trading signals to earn additional income

View More

Guide to Copy Trading

Get started with ease and confidence

View More

Signal Accounts for Members

All Signal Accounts

Best Return
  • Best Return
  • Best P/L
  • Best MDD
Past 1W
  • Past 1W
  • Past 1M
  • Past 1Y

All Contests

  • All
  • Recommend
  • Stocks
  • Cryptocurrencies
  • Central Banks
  • Trump Updates
  • Featured News
Top News Only
Share

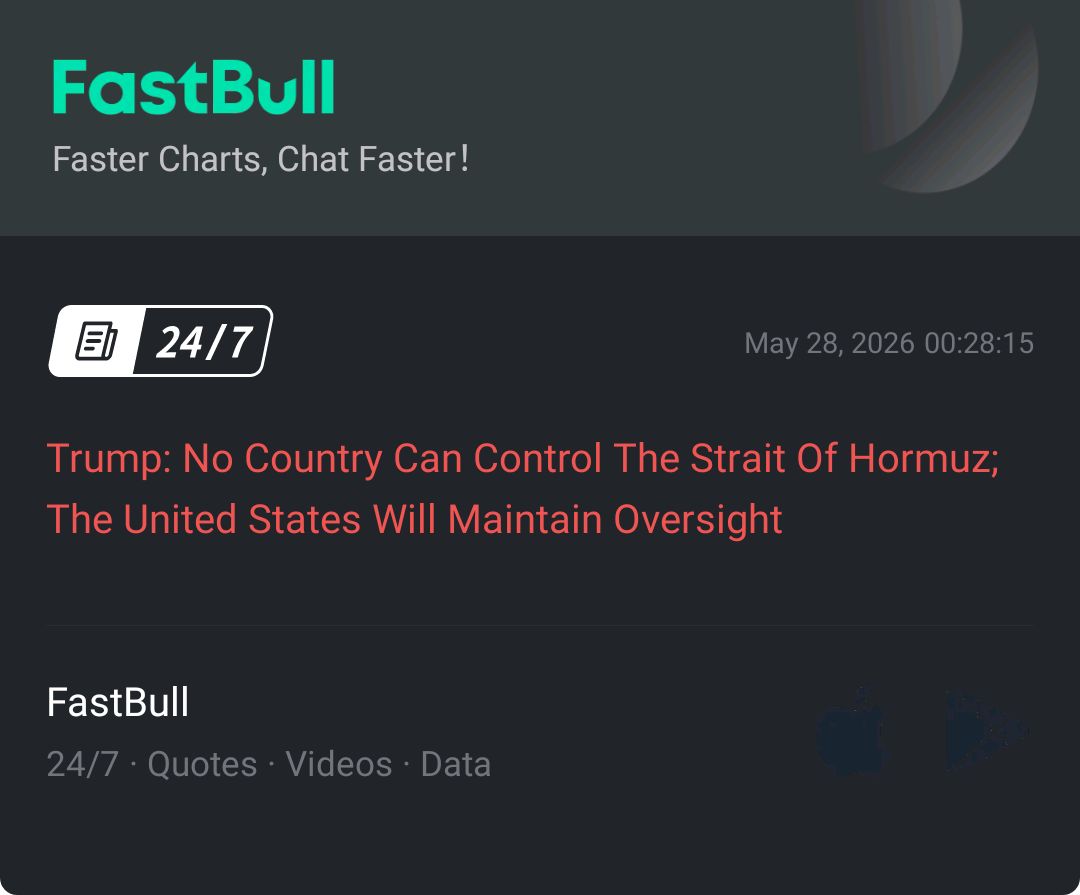
Trump: No Country Can Control The Strait Of Hormuz; The United States Will Maintain Oversight

Share

The Federal Reserve Accepted A Total Of $1.853 Billion From Seven Counterparties In Its Fixed-rate Reverse Repurchase Operations

Share

U.S. President Trump: If The Abraham Accords Cannot Be Implemented, I Am Not Sure Whether We Should Still Reach An Agreement With Iran. If Gulf States Do Not Sign The Abraham Accords, I Believe We Should Not Reach An Agreement With Iran

Share

US President Trump: I Think We Are Making Good Progress In The Negotiations

Share

US President Trump: We Now Have An Understanding Of The Situation In Iran

Share

US President Trump: The Deal Must Be Perfect

Share

US President Trump: The Strait Of Hormuz Will Be Opened Immediately After A Framework Agreement Is Reached With Iran

Share

US President Trump: We May Discuss Canceling The Fuel Tax Credit

Share

U.S. Equity Indices Declined In The Short Term, With The S&P 500 Index Turning Negative; The U.S. Dollar Index (DXY) Edged Slightly Higher In The Short Term

Share

US President Trump: (Regarding Iran) I Think We've Done A Great Job

Share

US President Trump: (Regarding Iran) When They Behave Well, We Will Let Them Get Their Money Back

Share

US President Trump: Iran Has Started Giving US What We Want, And If Things Don't Go Well, US Defense Secretary Hergsays Will Take Over The Job

Share

US President Trump: I Am Uneasy About Russia's Acquisition Of Iran's Stockpile Of Highly Enriched Uranium

Share

US President Trump: The United States Will Continue To Control Iranian Assets

Share

US President Trump: Gasoline Prices Will Drop As Before

Share

US President Trump: Oman Will Behave Well, Or We Will Have To Take Tough Measures

Share

US President Trump: Our Relationship With Venezuela Is Very Good

Share

U.S. Treasury Secretary Bessant: Prices Are Temporary; Oil Prices Will Drop When The War Ends

Share

U.S. Treasury Secretary Bessant: Real GDP Grew By 2.7% Over The Past Four Quarters

Share

Hungarian Prime Minister Majol Said He Will Meet With European Commission President Ursula Von Der Leyen In Brussels On Friday

TIME
ACT
FCST
PREV
IMPACT
U.K. BRC Shop Price Index YoY (May)

A:--

F: --

P: --

GBPUSD
  • GBPUSD
  • XAUUSD
  • XAGUSD
  • WTI
U.K. CBI Retail Sales Expectations Index (May)

A:--

F: --

P: --

GBPUSD
  • GBPUSD
  • XAUUSD
  • XAGUSD
  • WTI
  • USDX
U.K. CBI Distributive Trades (May)

A:--

F: --

P: --

GBPUSD
  • GBPUSD
  • XAUUSD
  • XAGUSD
  • WTI
  • USDX
Brazil Current Account (Apr)

A:--

F: --

P: --

XAUUSD
  • XAUUSD
  • XAGUSD
  • WTI
  • USDX
U.S. Chicago Fed National Activity Index (Apr)

A:--

F: --

P: --
USDX
  • USDX
  • XAUUSD
  • XAGUSD
  • WTI
U.S. S&P/CS 20-City Home Price Index YoY (Not SA) (Mar)

A:--

F: --

P: --

USDX
  • USDX
  • XAUUSD
  • XAGUSD
  • WTI
U.S. S&P/CS 20-City Home Price Index MoM (SA) (Mar)

A:--

F: --

P: --

USDX
  • USDX
  • XAUUSD
  • XAGUSD
  • WTI
U.S. FHFA House Price Index MoM (Mar)

A:--

F: --

P: --
USDX
  • USDX
  • XAUUSD
  • XAGUSD
  • WTI
U.S. FHFA House Price Index (Mar)

A:--

F: --

P: --

USDX
  • USDX
  • XAUUSD
  • XAGUSD
  • WTI
U.S. FHFA House Price Index YoY (Mar)

A:--

F: --

P: --

USDX
  • USDX
  • XAUUSD
  • XAGUSD
  • WTI
U.S. S&P/CS 10-City Home Price Index MoM (Not SA) (Mar)

A:--

F: --

P: --

USDX
  • USDX
  • XAUUSD
  • XAGUSD
  • WTI
U.S. S&P/CS 10-City Home Price Index YoY (Mar)

A:--

F: --

P: --

USDX
  • USDX
  • XAUUSD
  • XAGUSD
  • WTI
U.S. S&P/CS 20-City Home Price Index (Not SA) (Mar)

A:--

F: --

P: --

USDX
  • USDX
  • XAUUSD
  • XAGUSD
  • WTI
U.S. S&P/CS 20-City Home Price Index MoM (Not SA) (Mar)

A:--

F: --

P: --

USDX
  • USDX
  • XAUUSD
  • XAGUSD
  • WTI
U.S. Conference Board Consumer Expectations Index (May)

A:--

F: --

P: --

USDX
  • USDX
  • XAUUSD
  • XAGUSD
  • WTI
U.S. Conference Board Consumer Confidence Index (May)

A:--

F: --

P: --
USDX
  • USDX
  • XAUUSD
  • XAGUSD
  • WTI
U.S. Conference Board Present Situation Index (May)

A:--

F: --

P: --

USDX
  • USDX
  • XAUUSD
  • XAGUSD
  • WTI
U.S. Dallas Fed General Business Activity Index (May)

A:--

F: --

P: --

USDX
  • USDX
  • XAUUSD
  • XAGUSD
  • WTI
U.S. Dallas Fed New Orders Index (May)

A:--

F: --

P: --

USDX
  • USDX
  • XAUUSD
  • XAGUSD
  • WTI
U.S. 2-Year Note Auction Avg. Yield

A:--

F: --

P: --

XAUUSD
  • XAUUSD
  • XAGUSD
  • WTI
  • USDX
BOJ Gov Ueda Speaks
Australia Westpac Leading Index MoM (Apr)

A:--

F: --

P: --
AUDUSD
  • AUDUSD
  • XAUUSD
  • XAGUSD
  • WTI
China, Mainland Industrial Profit YoY (YTD) (Apr)

A:--

F: --

P: --

XAUUSD
  • XAUUSD
  • XAGUSD
  • WTI
  • USDX
Australia Construction Work Done YoY (Q1)

A:--

F: --

P: --

AUDUSD
  • AUDUSD
  • XAUUSD
  • XAGUSD
  • WTI
  • USDX
Australia Construction Work Done QoQ (SA) (Q1)

A:--

F: --

P: --

AUDUSD
  • AUDUSD
  • XAUUSD
  • XAGUSD
  • WTI
  • USDX
U.S. MBA Mortgage Application Activity Index WoW

A:--

F: --

P: --

USDX
  • USDX
  • XAUUSD
  • XAGUSD
  • WTI
U.S. Weekly Redbook Index YoY

A:--

F: --

P: --

XAUUSD
  • XAUUSD
  • XAGUSD
  • WTI
  • USDX
U.S. Richmond Fed Manufacturing Shipments Index (May)

A:--

F: --

P: --

USDX
  • USDX
  • XAUUSD
  • XAGUSD
  • WTI
U.S. Richmond Fed Services Revenue Index (May)

A:--

F: --

P: --

USDX
  • USDX
  • XAUUSD
  • XAGUSD
  • WTI
U.S. Richmond Fed Manufacturing Composite Index (May)

A:--

F: --

P: --

USDX
  • USDX
  • XAUUSD
  • XAGUSD
  • WTI
U.S. 5-Year Note Auction Avg. Yield

A:--

F: --

P: --

XAUUSD
  • XAUUSD
  • XAGUSD
  • WTI
  • USDX
U.S. API Weekly Gasoline Stocks

--

F: --

P: --

U.S. API Weekly Refined Oil Stocks

--

F: --

P: --

U.S. API Weekly Cushing Crude Oil Stocks

--

F: --

P: --

U.S. API Weekly Crude Oil Stocks

--

F: --

P: --

ECB Chief Economist Lane Speaks
South Korea Benchmark Interest Rate

--

F: --

P: --

Australia Building Capital Expenditure QoQ (Q1)

--

F: --

P: --

France PPI MoM (Apr)

--

F: --

P: --

Euro Zone Selling Price Expectations (May)

--

F: --

P: --

Euro Zone Consumer Inflation Expectations (May)

--

F: --

P: --

Euro Zone Services Sentiment Index (May)

--

F: --

P: --

Euro Zone Industrial Climate Index (May)

--

F: --

P: --

Euro Zone Economic Sentiment Indicator (May)

--

F: --

P: --

South Africa PPI YoY (Apr)

--

F: --

P: --

Italy 5-Year BTP Bond Auction Avg. Yield

--

F: --

P: --

Italy 10-Year BTP Bond Auction Avg. Yield

--

F: --

P: --

Italy PPI YoY (Apr)

--

F: --

P: --

India Manufacturing Output MoM (Apr)

--

F: --

P: --

India Industrial Production Index YoY (Apr)

--

F: --

P: --

Brazil Unemployment Rate (Apr)

--

F: --

P: --

Brazil PPI MoM (Apr)

--

F: --

P: --

Mexico Unemployment Rate (Not SA) (Apr)

--

F: --

P: --

U.S. PCE Price Index MoM (Apr)

--

F: --

P: --

U.S. Personal Income MoM (Apr)

--

F: --

P: --

U.S. Durable Goods Orders MoM (Apr)

--

F: --

P: --

U.S. PCE Price Index YoY (SA) (Apr)

--

F: --

P: --

Canada Current Account (SA) (Q1)

--

F: --

P: --

U.S. Personal Outlays MoM (SA) (Apr)

--

F: --

P: --

U.S. Core PCE Price Index MoM (Apr)

--

F: --

P: --

U.S. Weekly Initial Jobless Claims (SA)

--

F: --

P: --

Q&A with Experts
    • All
    • Chatrooms
    • Groups
    • Friends
    James flag
    Muhammad T
    @James yes
    @Muhammad Tthanks alot for this
    James flag
    Muhammad T
    @EuroTrader Yes brother, we have to consider both together because positive and negative news can also affect the market.
    @Muhammad TAlright, I'll start paying attention to it
    Muhammad T flag
    James
    @Muhammad Tthanks alot for this
    @James wellcome brother
    EuroTrader flag
    Muhammad T
    @EuroTrader Yes brother, we have to consider both together because positive and negative news can also affect the market.
    @Muhammad Tyeah exactly, you are correct on this, both must move together
    Muhammad T flag
    James
    @Muhammad TAlright, I'll start paying attention to it
    @James yes brother
    Muhammad T flag
    EuroTrader
    @Muhammad Tyeah exactly, you are correct on this, both must move together
    @EuroTrader hm
    EuroTrader flag
    Nawhdir Øt
    @EuroTradercousin, please don't follow it. In just forward test this.
    @Nawhdir ØtYeah, oh you are still selling gold, I thought you said you're done?
    EuroTrader flag
    Muhammad T
    @EuroTrader hm
    @Muhammad Tyeah, but honestly to understand technicals is very important cause every fundamentals will be printed on the chart
    EuroTrader flag
    James
    @Muhammad TAlright, I'll start paying attention to it
    @Jamesyeah brother please do, if you don't know how to read them you can send it here people can help.
    Nawhdir Øt flag
    James flag
    EuroTrader
    @Jamesyeah brother please do, if you don't know how to read them you can send it here people can help.
    @EuroTraderThanks a lot i will start sending it here if I don't understand
    Nawhdir Øt flag
    EuroTrader
    @Nawhdir ØtYeah, oh you are still selling gold, I thought you said you're done?
    @EuroTradersekali saja, di luar jadwal
    Nawhdir Øt flag
    00:25
    EuroTrader flag
    James
    @EuroTraderThanks a lot i will start sending it here if I don't understand
    @Jamesyou are welcome, yeah send them here I've shown you how to get them
    EuroTrader flag
    Nawhdir Øt
    @EuroTradersekali saja, di luar jadwal
    @Nawhdir Øtwell still apply risk management so it won't be over trading cousin
    EuroTrader flag
    Nawhdir Øt
    00:25
    @Nawhdir ØtLet me take some break, I'll catch up with you all shortly
    Muhammad T flag
    EuroTrader
    @Muhammad Tyeah, but honestly to understand technicals is very important cause every fundamentals will be printed on the chart
    @EuroTrader Yes brother, technicals are important, but fundamentals matter too. For example, if you are about to take a buying trade and you do not know that important news is coming, then after the news the market may move against you and your buying trade could hit stop loss. That is why we have to consider both together.
    Nawhdir Øt flag
    EuroTrader
    @Nawhdir ØtLet me take some break, I'll catch up with you all shortly
    @EuroTraderya, jangan diikuti, bisa saja gagal.
    Nawhdir Øt flag
    4354101 flag
    hi guys
    Type here...
    Add Symbol or Code

      No matching data

      All
      Recommend
      Stocks
      Cryptocurrencies
      Central Banks
      Trump Updates
      Featured News
      • All
      • Russia-Ukraine Conflict
      • Middle East Flashpoint
      • All
      • Russia-Ukraine Conflict
      • Middle East Flashpoint
      Search
      Products

      Charts Free Forever

      Chats Q&A with Experts
      Screeners Economic Calendar Data Tools
      Membership Features
      Data Warehouse Market Trends Institutional Data Policy Rates Macro

      Market Trends

      Market Sentiment Order Book Forex Correlations

      Top Indicators

      Charts Free Forever
      Markets

      News

      24/7 Analysis Education

      Latest Views

      Latest Update

      Signals

      Copy Rankings Latest Signals Become a signal provider AI Rating
      Contests
      Brokers

      Overview Brokers Assessment Rankings Regulators News Claims
      Broker listing Forex Brokers Comparison Tool Live Spread Comparison Scam
      Q&A Complaint Scam Alert Videos Tips to Detect Scam
      More

      Business
      Events
      Careers About Us Advertising Help Center

      White Label

      Broker API

      Data API

      Web Plug-ins

      Affiliate Program

      Awards Institution Evaluation IB Seminar Salon Event Exhibition
      Vietnam Thailand Singapore Dubai
      Fans Party Investment Sharing Session
      FastBull Summit BrokersView Expo
      Recent Searches
        Top Searches
          Markets
          Analysis
          User
          24/7
          Economic Calendar
          Education
          Data
          • Names
          • Latest
          • Prev

          View All

          No data

          Scan to Download

          Faster Charts, Chat Faster!

          Download App
          English
          • English
          • Español
          • العربية
          • Bahasa Indonesia
          • Bahasa Melayu
          • Tiếng Việt
          • ภาษาไทย
          • Français
          • Italiano
          • Türkçe
          • Русский язык
          • 简中
          • 繁中
          Open Account
          Search
          Products
          Charts Free Forever
          Markets
          News
          Signals

          Copy Rankings Latest Signals Become a signal provider AI Rating
          Contests
          Brokers

          Overview Brokers Assessment Rankings Regulators News Claims
          Broker listing Forex Brokers Comparison Tool Live Spread Comparison Scam
          Q&A Complaint Scam Alert Videos Tips to Detect Scam
          More

          Business
          Events
          Careers About Us Advertising Help Center

          White Label

          Broker API

          Data API

          Web Plug-ins

          Affiliate Program

          Awards Institution Evaluation IB Seminar Salon Event Exhibition
          Vietnam Thailand Singapore Dubai
          Fans Party Investment Sharing Session
          FastBull Summit BrokersView Expo

          916 Gold Price Today: Live 22K Rate Per Gram & Chart

          zhan chen
          Summary:

          Beyond the jeweler’s counter: Decode the complex mathematics driving the 916 gold price, from global spot markets to the true cost of your next physical asset.

          Tracking the exact value of physical jewelry requires looking beyond standard commodity tickers to understand how raw materials translate into retail products. The 916 gold price today serves as the definitive benchmark for 22-karat pieces across major global markets, determining exactly what buyers pay at the jewelry counter. By understanding how international spot prices, currency exchange rates, and fabrication fees interact, investors and consumers can accurately gauge the true cost of their acquisitions. This guide breaks down the mathematics behind live 916 rates, decodes global chart patterns, and provides actionable frameworks for timing your next purchase.

          916 Gold Price Today: Live 22K Rate Per Gram & Chart

          What Is the 916 Gold Price Right Now?

          The 916 gold price today averages $132 to $136 USD per gram in raw material value, reflecting current global spot markets, though retail buyers will pay higher localized rates after fabrication fees. Also known as 22-karat gold, the "916" designation means the alloy consists of 91.6% pure gold and 8.4% secondary metals—typically copper, zinc, or silver—added to increase physical durability. This specific purity level serves as the benchmark for retail jewelry markets across Singapore, Malaysia, and India. While the 24k gold price today in usa sits near $145 per gram ($4,500 per troy ounce), the 22k gold price today in usa and dominant Asian markets carries a built-in purity discount before jewelry making charges are applied.

          How the Live 916 Gold Rate Is Calculated Per Gram

          The live 916 rate is derived by discounting the 24-karat global spot price by 8.4% and adding regional retailer premiums. Because gold trades continuously on wholesale exchanges like the LBMA and CME Globex, retail jewelers rely on automated formulas to update store pricing boards daily.

          The exact calculation follows three specific steps:

          1. Convert to Grams: Wholesalers take the live international spot price (priced per troy ounce) and divide it by 31.1035 to find the 1 gram of gold price today for pure 24K metal.
          2. Apply the 91.6% Multiplier: The 24K per-gram rate is multiplied by 0.916. If the 24K spot is $145 USD per gram, the raw 916 base value is approximately $132.82.
          3. Add Making Charges and Taxes: Retailers apply a fabrication markup—often termed "workmanship" or "wastage" fees. In major Asian jewelry hubs like Singapore's Mustafa Centre or Poh Heng, this adds 8% to 15% to the final cost, alongside local consumption taxes.

          Investors tracking the gold and silver price today will note this calculation is unique to gold jewelry. Checking the silver price per gram or the price of silver per ounce today rarely involves a 91.6% multiplier, as sterling silver utilizes a rigid 92.5% (925) alloy standard rather than fluctuating regional karat preferences.

          Why Today's 916 Gold Price Differs From 24K Spot Price

          The 916 gold price diverges from the 24K spot price because you are purchasing a physically modified, retail-ready alloy rather than a wholesale, unrefined commodity. Spot prices reflect institutional paper contracts trading 99.9% pure gold in 400-ounce bars. Retail 916 gold incorporates the cost of the base metal, the specific alloy mix, and the logistical friction of the retail supply chain.

          Attribute24K Spot Price916 Retail Gold
          Purity Level99.9% or higher91.6% gold, 8.4% alloy
          Asset FormDigital contracts, LBMA wholesale barsPhysical jewelry, retail coins
          Pricing BaselineLive global exchange ratesLocalized base rate + workmanship premiums
          Buy/Sell SpreadNarrow (often pennies per ounce for institutions)Wide (retailers charge making fees on purchase, but only pay melt value on buyback)

          Purchasing 916 gold involves a direct financial trade-off. You gain a durable, wearable asset that resists the scratching and warping common to pure 24K gold. However, you sacrifice immediate liquidity and forfeit the fabrication premium. When selling 916 jewelry back to a dealer, the jeweler will execute a buyback based strictly on the daily 91.6% scrap value, entirely discounting the workmanship fees paid during the initial purchase.

          What's Driving the 916 Gold Price Today?

          Beyond localized retail policies, broader macroeconomic forces dictate where these baseline benchmarks settle. The daily 916 gold price is determined by a continuous calculation combining the global 24-karat spot price, the local currency exchange rate against the US dollar, and regional retail premiums. Central bank reserves, institutional buying, and shifting US Treasury yields dictate the baseline global spot price, while local jewelers adjust their daily boards based on currency fluctuations and fabrication costs.

          How Global Gold Spot Prices Feed Into the 22K Rate

          The baseline value of 916 gold is calculated by taking 91.6% of the global 24K spot price (XAU/USD) and adding dealer markups.

          While investors often track the gold and silver price today to gauge broad precious metal sentiment, determining the exact 1 gram of gold price today for retail 916 jewelry requires a specific mathematical sequence. As established, the transition from a wholesale trading screen to a retail 22K gold rate follows these distinct steps:

          1. The Global Baseline (XAU/USD): Institutional trading on exchanges like the LBMA sets the spot price for one troy ounce of 99.99% pure gold. If the benchmark XAU/USD rate trades at $4,500 per ounce, this translates to roughly $144.67 per gram (divided by exactly 31.10347 grams).
          2. The Purity Discount: 916 gold is an alloy containing 91.6% pure gold and 8.4% other metals (typically copper or zinc) for physical durability. The raw material value scales down proportionally: $144.67 × 0.916 = $132.52 per gram base value.
          3. Dealer Premiums & Logistics: Local distributors add a spread (typically 2-5%) to cover import taxes, vaulted insurance, and physical transport from refineries.
          4. Making Charges (Fabrication Cost): When buying physical jewelry rather than bullion, jewelers apply making charges ranging from 8% to 15% per gram based on design complexity. This fabrication premium is why the retail 22k gold price today in usa, Singapore, or Malaysia will consistently sit higher than the raw spot calculation.

          Currency Movements That Affect Your Local 916 Price

          A stronger US dollar makes 916 gold more expensive in local markets, even if the global price of gold remains completely flat.

          Because international spot gold is exclusively priced in US dollars, local retail rates require an immediate currency conversion. This creates an inverse relationship between domestic currency strength and local gold prices. If the global gold spot price drops by 1%, but your local currency depreciates by 2% against the USD on the same day, your local 916 gold board rate will actually increase.

          The impact of forex markets on retail gold varies by region:

          • Singapore (USD/SGD): The Monetary Authority of Singapore manages the SGD against a currency basket. When the SGD strengthens against the USD, Singaporean buyers effectively get a discount on 916 gold, cushioning them from global spot price spikes.
          • Malaysia (USD/MYR): Because the Ringgit generally experiences higher volatility against the dollar, Malaysian retail gold prices often swing more aggressively than the baseline XAU/USD chart. Buyers face dual exposure to both commodity risk and forex risk.
          • India (USD/INR): Beyond pure forex conversion, the 22K gold price today in India incorporates heavy import tariffs (historically ranging from 10% to 15% combined tax and duty). A depreciating Rupee magnifies these import costs, directly pushing up retail prices per gram before the jewelry even reaches the showroom floor.

          How to Read Global Spot Gold Charts to Predict 916 Rates

          To anticipate how these regional and currency factors will influence tomorrow's retail boards, buyers can analyze international trading patterns. Global spot gold charts track 24-karat (99.99%) pure metal in US dollars per troy ounce, serving as the mathematical baseline for all physical 916 (22-karat) retail rates. To extract the raw 916 gold price per gram from a live spot chart, investors must apply a strict conversion formula before accounting for retail markups.

          The mechanism works in four exact steps:

          1. Convert to Grams: Divide the USD spot price by 31.1035 (the exact weight of one troy ounce) to find the 24K price per gram.
          2. Apply Exchange Rates: Multiply the USD gram price by your local currency's live exchange rate.
          3. Adjust for Purity: Multiply that figure by 0.916 to reflect 22K purity standards.
          4. Factor the Premium: Add the local dealer premium—typically an 8% to 15% markup covering making charges, assaying, and operational costs—to arrive at the final retail rate.

          What Short-Term Price Patterns in 24K Spot Gold Actually Signal

          Short-term patterns in 24K spot gold indicate institutional liquidity shifts and macroeconomic reactions, not immediate dollar-for-dollar retail adjustments. Physical gold dealers employ asymmetric pricing—raising retail 916 rates instantly when spot prices spike, but deliberately lagging their downward adjustments when spot drops. Buyers must distinguish between structural market shifts and temporary intraday noise by tracking three specific indicators:

          • Support and Resistance Consolidation: When spot prices repeatedly test a 50-day moving average and fail to break lower, institutions are actively accumulating. This establishes a firm floor for the baseline 1 gram of gold price today, meaning physical retail rates are highly unlikely to discount further.
          • Relative Strength Index (RSI) Extremes: An RSI reading below 30 on a daily chart indicates technically oversold conditions. For physical buyers, this metric signals a high-probability window where downward momentum has exhausted itself, usually preceding a price bounce.
          • Currency Divergence: A sharp decline in the USD spot price does not guarantee a cheaper retail rate. If the spot price drops 2% but the local currency depreciates 2% against the dollar simultaneously, the local 916 rate remains flat. Even when tracking the 22k gold price today in usa, domestic buyers must weigh the spot drop against local dealer premiums, which frequently expand during volatile spot sell-offs to protect dealer margins.

          How to Spot the Best Time to Buy Based on the Chart

          The optimal buying window for physical 916 gold occurs when the 24K spot price hits a defined technical support level simultaneously with local currency strength against the US dollar. Attempting to catch the absolute bottom of a flash crash is less effective than executing purchases during confirmed structural dips using a precise framework.

          1. Isolate the Macro Floor: Target purchases when the spot chart approaches the 100-day or 200-day moving average. Historical data demonstrates that dealer premiums often contract slightly when spot prices stabilize at these long-term averages, offering better value per gram.
          2. Verify RSI and Momentum: Confirm the daily RSI is below 35 and the Moving Average Convergence Divergence (MACD) histogram shows decelerating downward momentum. This confirms the asset is undervalued without catching a falling knife.
          3. Cross-Reference the Exchange Rate: Ensure the local fiat currency is holding steady or appreciating against the USD. The most cost-effective buying opportunities materialize when both the USD spot price and the USD exchange rate decline concurrently.
          4. Execute on the Fix Lag: Retail dealers typically update physical board rates 1-2 times daily based on the benchmark London Bullion Market Association (LBMA) prices. If spot prices drop aggressively during early European trading hours, execute physical purchases during the local dealer's immediate afternoon window. This allows you to capture the baseline drop before the dealer recalibrates their premium spreads for the next business day.

          Is Today a Good Time to Buy 916 Gold?

          Applying these daily chart-reading strategies helps answer the most critical question for any prospective buyer. Whether acquiring 916 gold today is a prudent decision depends entirely on the buyer's time horizon and purchase intent. Investors seeking short-term arbitrage will struggle to overcome standard retail markups on 22-karat pieces, but long-term accumulators hedging against currency devaluation face a market supported by persistent central bank demand and volatile US Treasury yields.

          How Today's Rate Compares to Recent Highs and Lows

          Current 916 gold rates reflect a sustained macroeconomic rally, with 22-karat prices hovering near historic peaks around $133 USD ($170 SGD or ₹14,600 INR) per gram in mid-2026. This elevated floor is driven by the global benchmark—24-karat spot gold consistently testing the $4,500 per ounce threshold amid shifting inflation expectations and geopolitical friction.

          Unlike the sharp, speculative spikes seen in previous decades, recent price floors are underpinned by institutional accumulation. The World Gold Council continues to report heavy net purchases by central banks, effectively raising the baseline cost for all retail gold.

          To properly contextualize the current pricing environment, buyers must evaluate three structural indicators rather than daily noise:

          • The USD Index (DXY): Because international gold is dollar-denominated, a firmer US dollar makes 916 gold artificially more expensive for buyers converting from local currencies like the Malaysian Ringgit or Singapore Dollar.
          • Real Interest Rates: When 10-year Treasury yields rise, non-yielding physical assets become more expensive to hold in opportunity-cost terms, typically suppressing spot prices.
          • Regional Premiums: Local demand surges—such as ahead of Akshaya Tritiya, Diwali, or Lunar New Year—can disconnect regional 916 retail rates from global spot trends, creating temporary highs independent of the London Bullion Market Association (LBMA) benchmarks.

          What Buyers Should Factor In Beyond the Raw Gram Price

          The quoted 916 spot rate is strictly a raw material baseline; final retail costs for 22K jewelry are typically 10% to 30% higher once fabrication, dealer margins, and taxes are applied. Relying solely on a live chart guarantees a miscalculation at the retail counter.

          Before transacting, evaluate the specific variables that dictate the true cost of acquisition:

          • Making Charges (Workmanship): Retailers add a premium based on the complexity of the design and labor involved. Machine-made chains may incur a flat 5% to 8% markup, while intricate bridal pieces often command 20% to 25% over the raw gram weight.
          • The Bid-Ask Spread: 916 gold is an inefficient vehicle for short-term trading. Jewelers sell at a premium to the spot rate but buy back used jewelry at a steep discount, typically deducting a 5% to 10% assay and melting fee from the live market value.
          • Jurisdictional Taxation: Regulatory levies shift the final price significantly. Buyers in India face a 3% GST on gold purchases, while Singapore imposes a 9% GST on 916 jewelry. Notably, investment-grade 999 bullion is GST-exempt in Singapore, making 916 a purely consumption-driven purchase.
          • Purity Certification: Always ensure the piece is formally assayed. Unhallmarked gold often tests below the mandated 91.6% purity upon resale, destroying terminal value regardless of how much the macro spot price appreciated.

          The Retail Pricing Framework To audit a jeweler's quote, calculate the baseline using this mechanism:

          Cost ComponentCalculation Mechanism
          Base Material ValueLive 916 Gram Rate × Gram Weight of Item
          + WorkmanshipFlat fee OR Percentage of material value (5%–25%)
          + Statutory TaxesLocal sales tax / GST applied to the subtotal
          = Final Retail PriceWhat the buyer actually pays at the counter

          If the final quote deviates significantly from this framework, the jeweler is likely embedding a hidden margin into their internal per-gram exchange rate rather than utilizing the live market benchmark.

          FAQs about 916 gold price

          How much is 1 gram of 916 gold?

          The price of 1 gram of 916 gold fluctuates daily based on global market conditions. As of late May 2026, the retail price in Singapore is approximately SGD 180 to SGD 185. Buyers should check live market rates or consult local jewelers to find the exact daily valuation before purchasing.

          Is 916 gold 22K or 24K?

          916 gold is equivalent to 22-karat (22K) gold. The number 916 indicates that the material contains exactly 91.6% pure gold. The remaining 8.4% consists of alloyed metals such as copper, silver, or zinc.

          Is 916 gold harder than 24K gold?

          Yes, 916 gold is significantly harder and more durable than 24K gold. Since 24K gold is nearly 100% pure, it is very soft and easily scratched, bent, or dented. By mixing pure gold with harder alloy metals, 916 gold becomes strong enough to withstand everyday wear in jewelry.

          What factors influence the market price of 916 gold?

          The market price of 916 gold is primarily driven by global supply and demand dynamics alongside international spot prices. Macroeconomic variables, including inflation, central bank interest rates, and geopolitical uncertainty, heavily influence these trends. Additionally, fluctuations in local currency exchange rates against the US dollar directly impact regional gold pricing.

          Conclusion

          Navigating the physical 22-karat jewelry market requires balancing international spot benchmarks, currency fluctuations, and localized retail premiums. By tracking the exact 916 purity calculation against global macroeconomic indicators, buyers can look past superficial showroom markups to isolate the true underlying value of their physical assets. Utilizing technical chart analysis alongside a strict assessment of making charges ensures that purchases are executed with data-driven precision. Informed consumers who monitor these overlapping metrics are best positioned to secure wearable wealth while minimizing exposure to excessive fabrication costs.

          Risk Warnings and Disclaimers
          You understand and acknowledge that there is a high degree of risk involved in trading. Following any strategies or investment methods may lead to potential losses. The content on the site is provided by our contributors and analysts for information purposes only. You are solely responsible for determining whether any trading assets, securities, strategy, or any other product is suitable for investing based on your own investment objectives and financial situation.
          Add to Favorites
          Share
          FastBull
          Copyright © 2026 FastBull Ltd

          728 RM B 7/F GEE LOK IND BLDG NO 34 HUNG TO RD KWUN TONG KLN HONG KONG

          TelegramInstagramTwitterfacebooklinkedin
          App Store Google Play Google Play
          Products
          Charts

          Chats

          Q&A with Experts
          Screeners
          Economic Calendar
          Data
          Tools
          Membership
          Features
          Function
          Markets
          Copy Trading
          Latest Signals
          Contests
          24/7
          Analysis
          Education
          Company
          Careers
          About Us
          Contact Us
          Advertising
          Help Center
          Feedback
          User Agreement
          Privacy Policy
          Personal Information Protection Statement
          Business

          White Label

          Broker API

          Data API

          Web Plug-ins

          Poster Maker

          Affiliate Program

          Risk Disclosure

          The risk of loss in trading financial instruments such as stocks, FX, commodities, futures, bonds, ETFs and crypto can be substantial. You may sustain a total loss of the funds that you deposit with your broker. Therefore, you should carefully consider whether such trading is suitable for you in light of your circumstances and financial resources.

          No decision to invest should be made without thoroughly conducting due diligence by yourself or consulting with your financial advisors. Our web content might not suit you since we don't know your financial conditions and investment needs. Our financial information might have latency or contain inaccuracy, so you should be fully responsible for any of your trading and investment decisions. The company will not be responsible for your capital loss.

          Without getting permission from the website, you are not allowed to copy the website's graphics, texts, or trademarks. Intellectual property rights in the content or data incorporated into this website belong to its providers and exchange merchants.

          Not Logged In

          Log in to access more features

          Connect Broker
          Become a signal provider
          Help Center
          Customer Service
          Dark Mode
          Price Up/Down Colors

          Log In

          Sign Up

          Position
          Layout
          Fullscreen
          Default to Chart
          The chart page opens by default when you visit fastbull.com