- USDX
- XAUUSD
- XAGUSD
- WTI
Markets
Analysis
User
24/7
Economic Calendar
Education
Data
- Names
- Latest
- Prev


Signal Accounts for Members
All Signal Accounts
All Contests


Brent Crude Oil Fell Below $98 Per Barrel, Down 3.42% On The Day. WTI Crude Oil Is Currently Down 4.7%
According To An Analysis By The New York Times, Federal Reserve Officials Have Long Maintained That The Labor Market Is Not A Source Of Inflationary Pressures. The September Report Reinforced This View. Average Hourly Wages Rose Only Slightly By 0.1% Month-over-month And 3% Year-over-year In September, Below The Market Consensus Of 3.2%
According To NBC News: US President Trump And French President Macron Discussed The Energy Situation Last Night
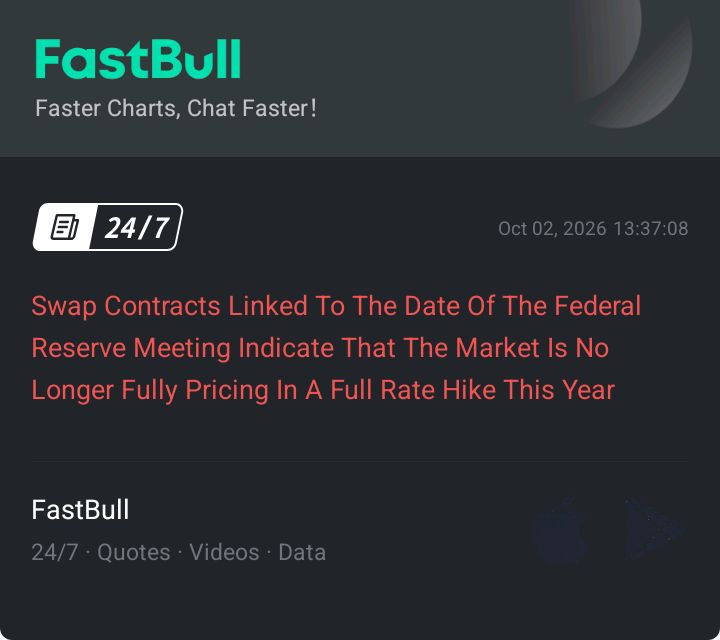
Swap Contracts Linked To The Date Of The Federal Reserve Meeting Indicate That The Market Is No Longer Fully Pricing In A Full Rate Hike This Year
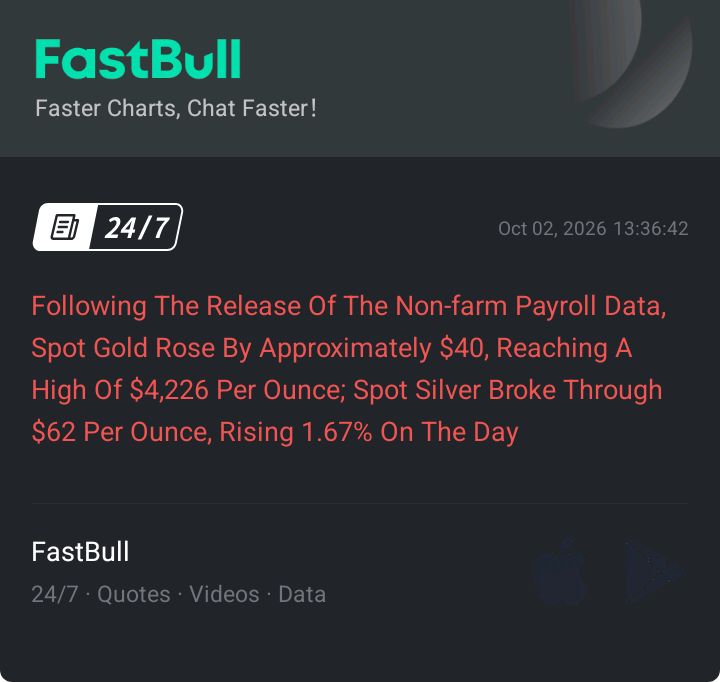
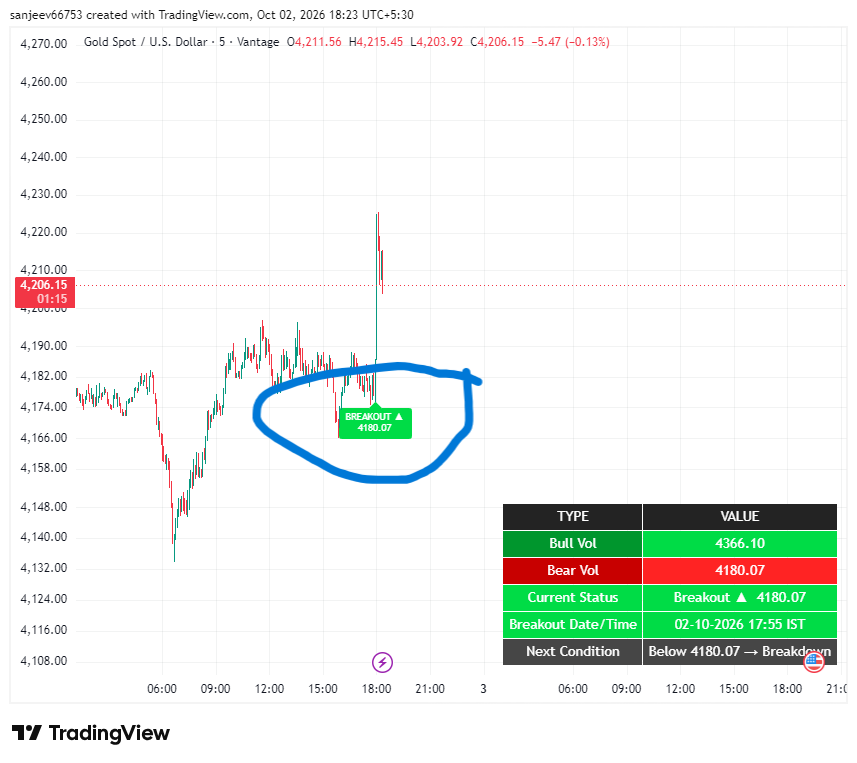
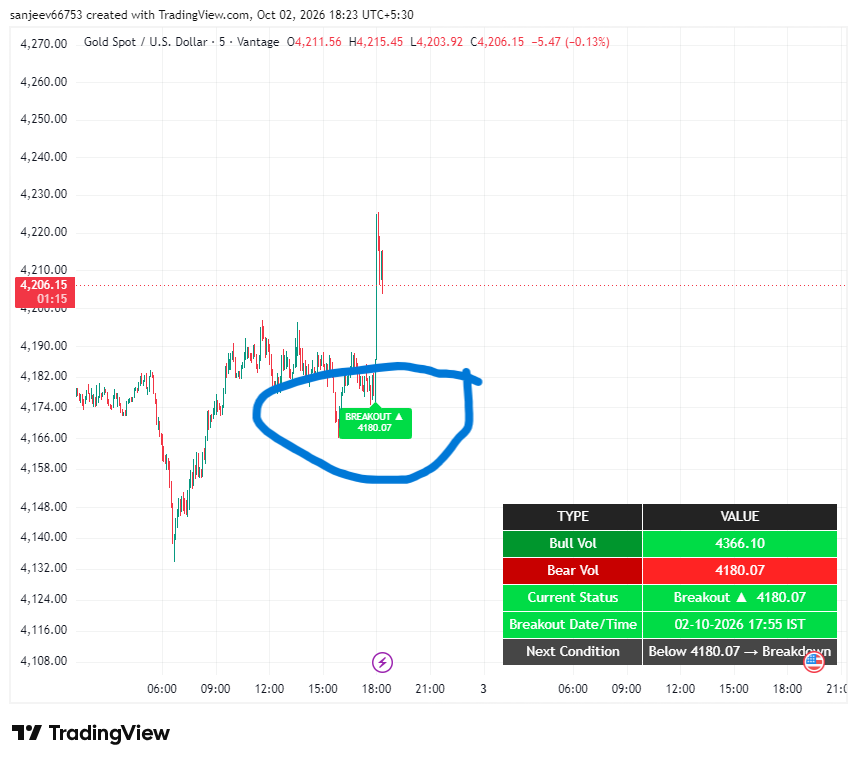
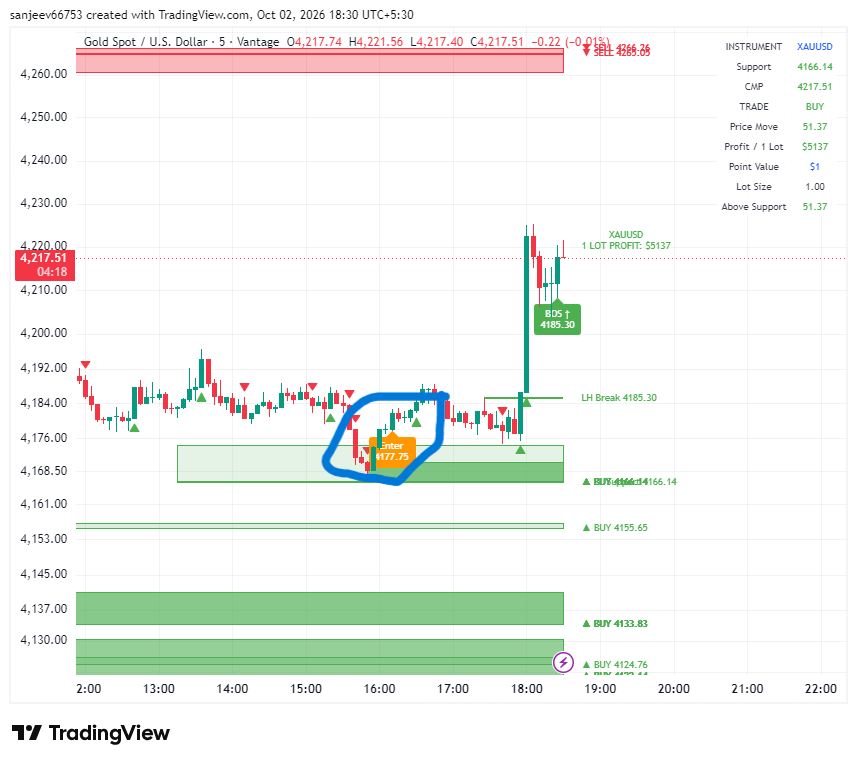
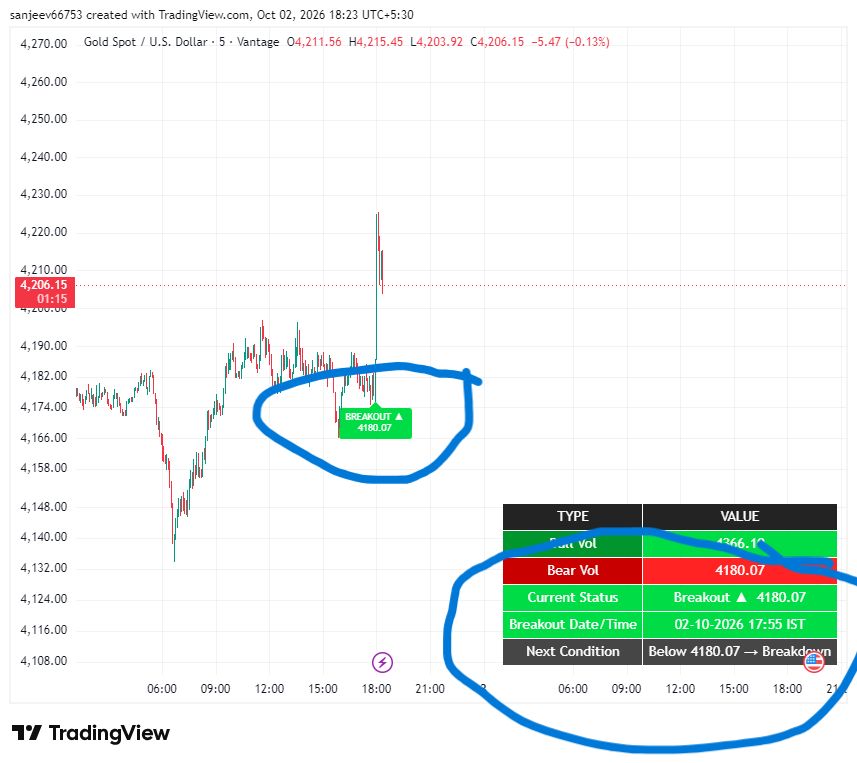
Following The Release Of The Non-farm Payroll Data, Spot Gold Rose By Approximately $40, Reaching A High Of $4,226 Per Ounce; Spot Silver Broke Through $62 Per Ounce, Rising 1.67% On The Day
According To The U.S. Bureau Of Labor Statistics, The Number Of People Currently Seeking Employment But Not Yet In The Labor Market In September Was 5.8 Million, A Little Different From Previous Months
According To The U.S. Bureau Of Labor Statistics, The Labor Force Participation Rate (61.8%) And The Employment-to-population Ratio (59.2%) Remained Largely Unchanged In September
The U.S. Bureau Of Labor Statistics Reported That Nonfarm Payrolls Increased By 29,000 And The Unemployment Rate Remained Largely Unchanged In September. Employment In All Major Industries Also Saw Little Change During The Month
Following The Release Of The Non-farm Payroll Data, The Yield On The 30-year U.S. Treasury Note Fell 2.8 Basis Points To 5.575%. The 2-year Yield Fell 7.7 Basis Points To 4.71%. The 10-year Yield Ultimately Fell 5.6 Basis Points To 5.18%
The Combined Revision To U.S. Nonfarm Payrolls For July And August Amounts To A Reduction Of 60,000 Jobs
U.S. Government Sector Employment Decreased By 17,000 In September After Seasonal Adjustment; The Previous Figure Was Revised Up From 35,000 To 44,000
The U.S. U6 Unemployment Rate For September Stood At 7.6%, Against A Forecast Of 7.7% And A Previous Reading Of 7.70%
U.S. Private Nonfarm Payrolls Increased By 46,000 In September, Missing The Forecast Of 85,000, While The Previous Figure Was Revised Down From 127,000 To 89,000
U.S. Non-farm Payrolls Increased By 29,000 In September After Seasonal Adjustment, Missing The Forecast Of 90,000; The Previous Figure Was Revised Down From 162,000 To 133,000
The U.S. Unemployment Rate Rose Slightly To 4.2% In September, While The Market Expected It To Remain Unchanged At 4.1%

U.S. ISM Manufacturing Employment Index (Sept)A:--
F: --
P: --
U.S. ISM Manufacturing New Orders Index (Sept)A:--
F: --
P: --
U.S. ISM Inventories Index (Sept)A:--
F: --
P: --
U.S. ISM Output Index (Sept)A:--
F: --
P: --
U.S. Construction Spending MoM (Aug)A:--
F: --
FOMC Member Waller Speaks
U.S. EIA Weekly Natural Gas Stocks ChangeA:--
F: --
P: --
Mexico Manufacturing PMI (Sept)A:--
F: --
P: --
New York Federal Reserve President Williams delivered a speech.
U.S. Weekly Treasuries Held by Foreign Central BanksA:--
F: --
P: --
South Korea CPI YoY (Sept)A:--
F: --
P: --
Japan Jobs to Applicants Ratio (Aug)A:--
F: --
P: --
Japan Tokyo Core CPI YoY (Sept)A:--
F: --
P: --
Japan Tokyo CPI YoY (Sept)A:--
F: --
P: --
Japan Unemployment Rate (Aug)A:--
F: --
P: --
Japan Tokyo CPI MoM (Sept)A:--
F: --
P: --
Japan Tokyo CPI MoM (Excl. Food & Energy) (Sept)A:--
F: --
P: --
Japan Monetary Base YoY (SA) (Sept)A:--
F: --
P: --
Italy Retail Sales MoM (SA) (Aug)A:--
F: --
P: --
Euro Zone HICP Prelim YoY (Sept)A:--
F: --
P: --
Euro Zone Core CPI Prelim YoY (Sept)A:--
F: --
P: --
Euro Zone Core CPI Prelim MoM (Sept)A:--
F: --
P: --
U.S. Government Employment (Sept)A:--
F: --
U.S. Unemployment Rate (SA) (Sept)A:--
F: --
P: --
U.S. Nonfarm Payrolls (SA) (Sept)A:--
F: --
U.S. Average Hourly Wage YoY (Sept)A:--
F: --
P: --
U.S. Average Hourly Wage MoM (SA) (Sept)A:--
F: --
P: --
U.S. U6 Unemployment Rate (SA) (Sept)A:--
F: --
P: --
U.S. Manufacturing Employment (SA) (Sept)A:--
F: --
U.S. Labor Force Participation Rate (SA) (Sept)A:--
F: --
P: --
U.S. Average Weekly Working Hours (SA) (Sept)A:--
F: --
P: --
U.S. Private Nonfarm Payrolls (SA) (Sept)A:--
F: --
U.S. Factory Orders MoM (Excl. Defense) (Aug)--
F: --
P: --
U.S. Factory Orders MoM (Aug)--
F: --
P: --
U.S. Factory Orders MoM (Excl. Transport) (Aug)--
F: --
P: --
U.S. Weekly Total Oil Rig Count--
F: --
P: --
U.S. Weekly Total Rig Count--
F: --
P: --
Australia has begun observing Daylight Saving Time, meaning its financial market trading hours and economic data release times will be one hour earlier than Standard Time.
Australia Services PMI Prelim (Sept)--
F: --
P: --
Japan IHS Markit Composite PMI (Sept)--
F: --
P: --
Japan IHS Markit Services PMI (Sept)--
F: --
P: --
Saudi Arabia IHS Markit Composite PMI (Sept)--
F: --
P: --
Japan Household Consumer Confidence Index (Sept)--
F: --
P: --
Russia IHS Markit Services PMI (Sept)--
F: --
P: --
Turkey CPI YoY (Sept)--
F: --
P: --
Turkey PPI YoY (Sept)--
F: --
P: --
South Africa IHS Markit Composite PMI (SA) (Sept)--
F: --
P: --
Italy Composite PMI (Sept)--
F: --
P: --
Italy Services PMI (SA) (Sept)--
F: --
P: --
Germany Composite PMI Final (SA) (Sept)--
F: --
P: --
Euro Zone Services PMI Final (Sept)--
F: --
P: --
Euro Zone Composite PMI Final (Sept)--
F: --
P: --
ECB Chief Economist Lane Speaks


No matching data
Key takeaways:
XRP has slipped nearly 20% in 45 days, consolidating within a descending triangle near the $2.70 support.
Onchain and futures data show leverage reset and early signs of accumulation, reducing liquidation risks.
The confluence of a fair value gap, Fibonacci retracement lines, and fractal pattern points to a potential 60% to 85% rebound into Q4.
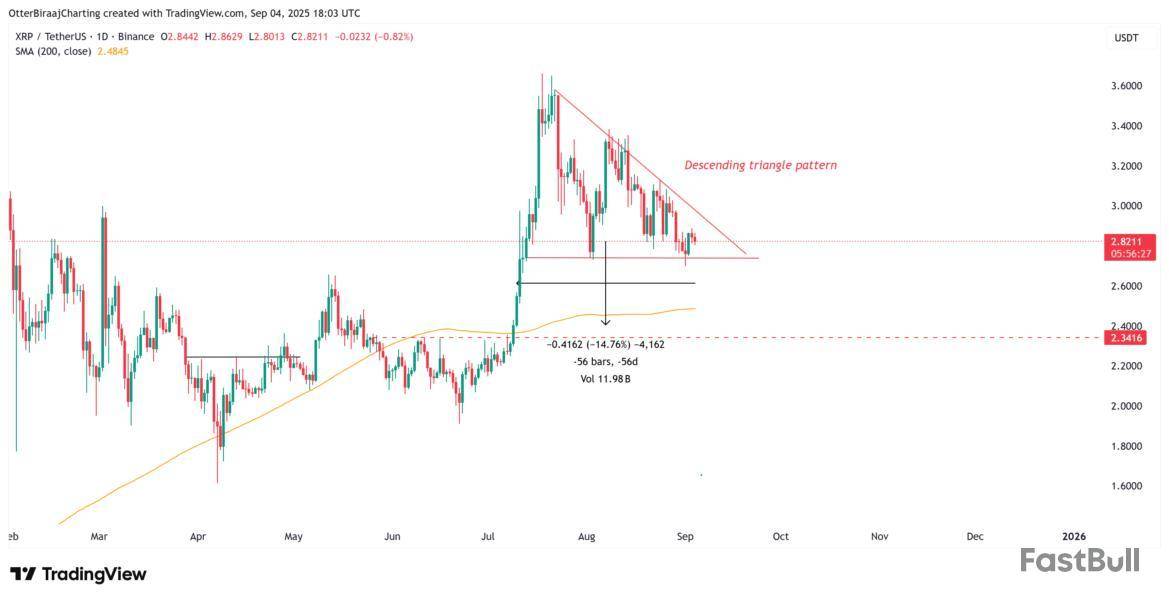
XRP (XRP) price fell by nearly 20% over the past 45 days, continuing a correction that has pushed the price back toward a key support. On the daily chart, XRP is consolidating within a descending triangle pattern, raising the risk of another move below support at $2.70.
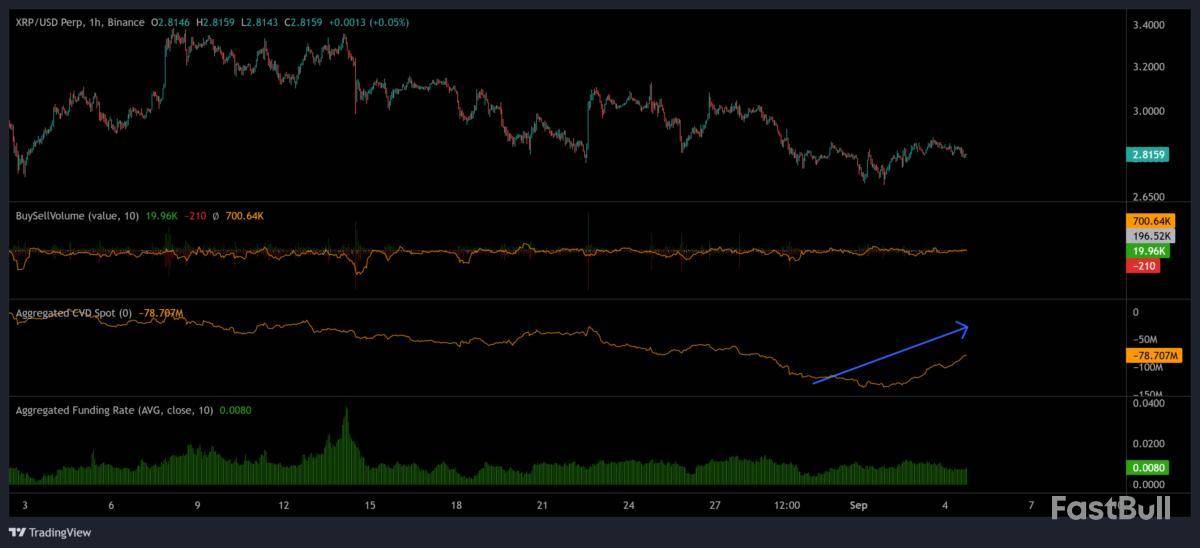
XRP futures data underscores the cooling market. The open interest has dropped from $11 billion to $7.5 billion during the same period, reflecting reduced speculative exposure.
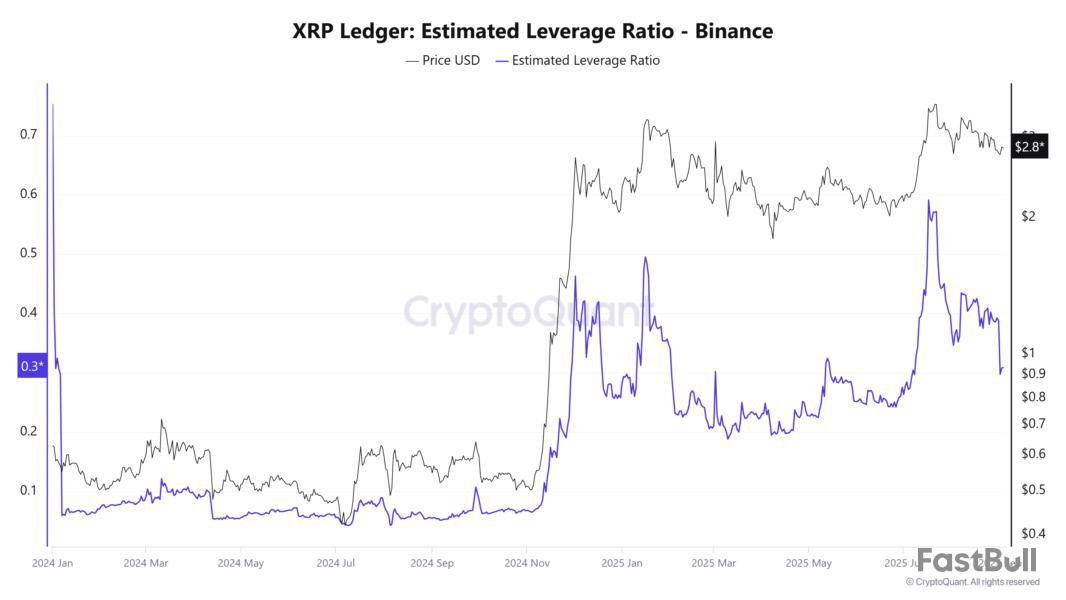
However, one positive development is that the token’s estimated leverage ratio on Binance has reset to its yearly average. The ratio of open interest relative to exchange reserves signals that traders are no longer overextended on high leverage. This reduces the likelihood of cascading liquidations and supports price stability during corrections.
Onchain indicators also point to early signs of reversal. Net taker volume has moved closer to neutral, supported by an uptick in aggregated spot cumulative volume delta (CVD), which tracks whether buyers or sellers dominate. The shift suggests holders may already be in accumulation mode.
Futures positioning adds to the picture. Aggregated futures CVD has steadily declined, while funding rates have normalized to quarterly levels, indicating that crowded positions have been cleared.
Related: Betting on XRP’s 2017-style gains could be extremely risky in 2025
XRP price bottom could be near
On the daily chart, XRP continues to trade within a descending triangle, with price repeatedly testing support near $2.70. A daily/weekly fair value gap between $2.35 and $2.65 emerges as the key zone to watch. A push below $2.70 could drive XRP into this range, where a reaction is likely.
The significance of this gap is reinforced by Fibonacci retracement levels, with the 0.5 to 0.618 range aligning closely with the $2.35 to $2.65 zone. Historically, such a confluence has strengthened the probability of price stabilization and a rebound.
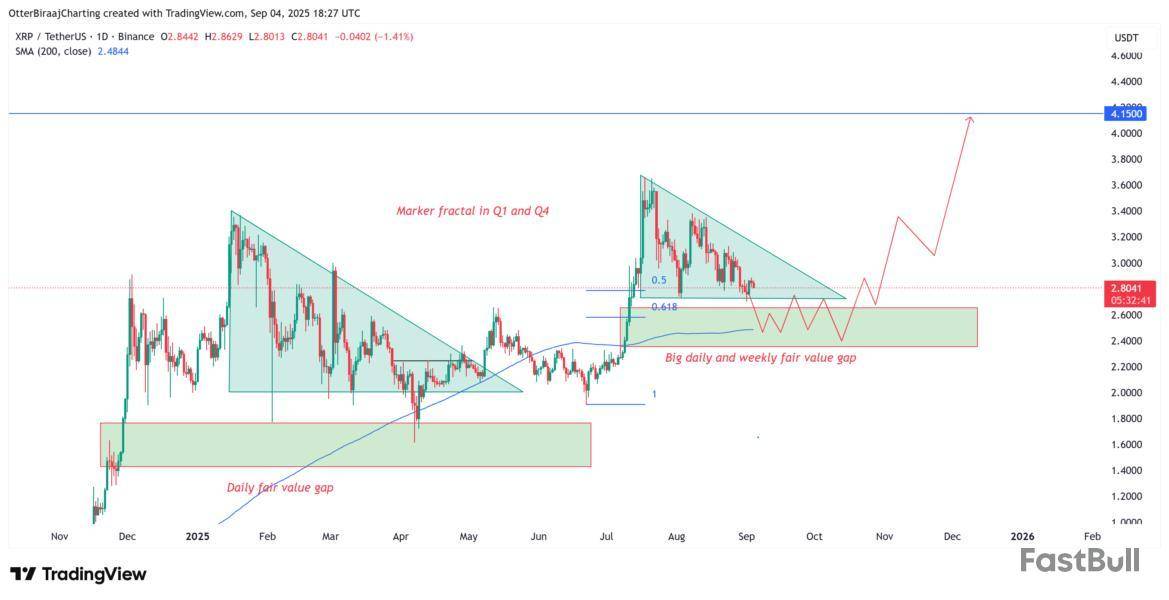
Adding weight to this outlook, Cointelegraph noted that XRP’s market structure resembles a Q1 fractal pattern, which preceded a sharp breakout. If the pattern plays out again, XRP could see gains of 60% to 85% in Q4.
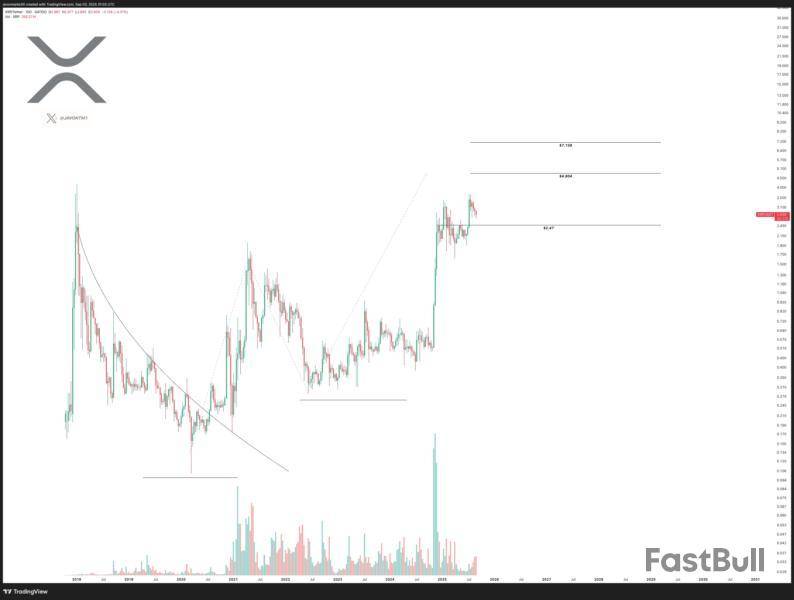
Crypto trader Javon Marks highlights a similar bullish bias, noting that “at the current state of the market, not much has changed with $XRP's target at $4.80 as its prices continue to hold above a key $2.47 level.”
Marks added that “as long as this level holds, prices may only be prepping for another +66% upside.”
Related: Rare Binance Bitcoin bottom signal fires: Will bulls or bears benefit?
This article does not contain investment advice or recommendations. Every investment and trading move involves risk, and readers should conduct their own research when making a decision.
The risk of loss in trading financial instruments such as stocks, FX, commodities, futures, bonds, ETFs and crypto can be substantial. You may sustain a total loss of the funds that you deposit with your broker. Therefore, you should carefully consider whether such trading is suitable for you in light of your circumstances and financial resources.
No decision to invest should be made without thoroughly conducting due diligence by yourself or consulting with your financial advisors. Our web content might not suit you since we don't know your financial conditions and investment needs. Our financial information might have latency or contain inaccuracy, so you should be fully responsible for any of your trading and investment decisions. The company will not be responsible for your capital loss.
Without getting permission from the website, you are not allowed to copy the website's graphics, texts, or trademarks. Intellectual property rights in the content or data incorporated into this website belong to its providers and exchange merchants.
Not Logged In
Log in to access more features
Log In
Sign Up