• Trade
  • Markets
  • Copy
  • Contests
  • 24/7
  • Calendar
  • Q&A
  • Chats
Screeners
SYMBOL
LAST
BID
ASK
HIGH
LOW
NET CHG.
%CHG.
SPREAD
SOURCE
SPX
S&P 500 Index
7376.86
7376.86
7376.86
7444.20
7369.55
+23.13
+ 0.31%
--
--
DJI
Dow Jones Industrial Average
51285.73
51285.73
51285.73
51662.26
50992.61
-237.33
-0.46%
--
--
IXIC
NASDAQ Composite Index
24579.41
24579.41
24579.41
24825.55
24507.63
+264.41
+ 1.09%
--
--
USDX
US Dollar Index
101.668
101.668
101.748
102.133
101.665
-0.410
-0.40%
--
--
EURUSD
Euro / US Dollar
1.11944
1.11944
1.11954
1.11950
1.11348
+0.00568
+ 0.51%
--
--
GBPUSD
Pound Sterling / US Dollar
1.34187
1.34187
1.34197
1.34188
1.33458
+0.00697
+ 0.52%
--
--
XAUUSD
Gold / US Dollar
4099.86
4099.86
4100.27
4133.90
4054.18
+28.35
+ 0.70%
--
--
WTI
Light Sweet Crude Oil
89.377
89.377
89.407
90.437
88.442
-0.097
-0.11%
--
--

Community Accounts

Signal Accounts
--
Profit Accounts
--
Loss Accounts
--
View More

Become a signal provider

Sell trading signals to earn additional income

View More

Guide to Copy Trading

Get started with ease and confidence

View More

Signal Accounts for Members

All Signal Accounts

Best Return
  • Best Return
  • Best P/L
  • Best MDD
Past 1W
  • Past 1W
  • Past 1M
  • Past 1Y

All Contests

  • All
  • Recommend
  • Stocks
  • Cryptocurrencies
  • Central Banks
  • Trump Updates
  • Featured News
Top News Only
Share

Market News: Ukrainian Foreign Minister Sebiga Will Meet With US Secretary Of State Rubio During The G7 Summit

Share

The Ukrainian Central Bank Raised Its Benchmark Interest Rate To 16.5% By A Vote Of 8 To 3

Share

According To Russian Media, Russian President Vladimir Putin Will Chair A Meeting Of The Collective Security Treaty Organization (CSTO) Collective Security Council In Moscow On November 11

Share

Market News: Russian Foreign Minister Lavrov Hosted The Peruvian Foreign Minister In Moscow

Share

India's NIFTY Index Rose 0.2% To 25,044 Points At The Provisional Close

Share

The Indian Rupee Closed Slightly Lower At 93.9275 Against The US Dollar, Compared With 93.9050 At The Close Of The Previous Trading Day

Share

Turkish President Erdogan: We Do Not Want To See A New Round Of Attacks Against Iran. I Expressed Our Concerns To US President Trump During The Call

Share

Turkish President Recep Tayyip Erdoğan: Turkey And Azerbaijan Are Two Brotherly Countries With An Unbreakable Relationship, And No One Can Cast A Shadow On Our Relationship

Share

According To Ukrainian Media, An International Monetary Fund Delegation Has Begun Working In Ukraine To Review Financing Plans

Share

The Thai KOSPI Index Closed Up 0.5% At 1,473.07 Points

Share

The Euro Rose More Than 0.50% Against The US Dollar On The Day, Currently Trading At 1.1192

Share

UniCredit CEO: The Second Phase Is The Integration Of HVB With Commerzbank

Share

UniCredit CEO: Actual Detailed Discussions Can Only Take Place After All Authorizations Are In Place

Share

The CEO Of Union Credit Stated That Consultations With All Shareholders Of Commerzbank Have Progressed As The Time For US To Take Control Approaches

Share

The U.S. International Trade Commission Determined That Imports Of High-purity Dissolving Pulp Specialty Cellulose From Norway And Brazil "did Not Cause Or Threaten To Cause Material Injury To The U.S. Industry." Therefore, The U.S. Department Of Commerce Will Not Impose Antidumping Duties On These Imports

Share

A Spokesperson For Intesa Sanpaolo Said The Bank Declined To Comment On The Proposed Merger With Crédit Agricole

Share

The CEO Of UniCredit Stated That, Once Regulatory Approval Is Obtained, They Will Immediately Request Commerzbank To Convene An Extraordinary General Meeting Of Shareholders

Share

Coca-Cola HBC Shares Rose 6.8% Following Comments From The Kremlin Regarding Russian Assets

Share

Kremlin: Abu Dhabi Negotiations Are Planned To Be Held Without European Involvement

Share

Kremlin: Both The United States And Ukraine Have Their Own Channels Of Communication With Europeans

TIME
ACT
FCST
PREV
IMPACT
U.S. U6 Unemployment Rate (SA) (Oct)

A:--

F: --

P: --

XAUUSD
  • XAUUSD
  • XAGUSD
  • WTI
  • USDX
U.S. Manufacturing Employment (SA) (Oct)

A:--

F: --

P: --
USDX
  • USDX
  • XAUUSD
  • XAGUSD
  • WTI
U.S. Average Hourly Wage YoY (Oct)

A:--

F: --

P: --
XAUUSD
  • XAUUSD
  • XAGUSD
  • WTI
  • USDX
U.S. Average Hourly Wage MoM (SA) (Oct)

A:--

F: --

P: --
XAUUSD
  • XAUUSD
  • XAGUSD
  • WTI
  • USDX
U.S. Average Weekly Working Hours (SA) (Oct)

A:--

F: --

P: --

XAUUSD
  • XAUUSD
  • XAGUSD
  • WTI
  • USDX
U.S. Private Nonfarm Payrolls (SA) (Oct)

A:--

F: --

P: --
XAUUSD
  • XAUUSD
  • XAGUSD
  • WTI
  • USDX
U.S. Labor Force Participation Rate (SA) (Oct)

A:--

F: --

P: --

XAUUSD
  • XAUUSD
  • XAGUSD
  • WTI
  • USDX
U.S. 5-10 Year-Ahead Inflation Expectations (Nov)

A:--

F: --

P: --

XAUUSD
  • XAUUSD
  • XAGUSD
  • WTI
  • USDX
Canada Ivey PMI (Not SA) (Oct)

A:--

F: --

P: --

USDCAD
  • USDCAD
  • XAUUSD
  • XAGUSD
  • WTI
  • USDX
Canada Ivey PMI (SA) (Oct)

A:--

F: --

P: --

USDCAD
  • USDCAD
  • XAUUSD
  • XAGUSD
  • WTI
  • USDX
U.S. UMich Current Economic Conditions Index Prelim (Nov)

A:--

F: --

P: --

USDX
  • USDX
  • XAUUSD
  • XAGUSD
  • WTI
U.S. UMich Consumer Expectations Index Prelim (Nov)

A:--

F: --

P: --

USDX
  • USDX
  • XAUUSD
  • XAGUSD
  • WTI
U.S. UMich 1-Year-Ahead Inflation Expectations Prelim (Nov)

A:--

F: --

P: --

XAUUSD
  • XAUUSD
  • XAGUSD
  • WTI
  • USDX
U.S. UMich Consumer Sentiment Index Prelim (Nov)

A:--

F: --

P: --

USDX
  • USDX
  • XAUUSD
  • XAGUSD
  • WTI
Bank of Japan Governor Kazuo Ueda delivered a speech at the International Monetary Fund (IMF), followed by a dialogue with IMF Managing Director Kristalina Georgieva.
U.S. Weekly Total Rig Count

A:--

F: --

P: --

WTI
  • WTI
  • XAUUSD
  • XAGUSD
  • USDX
U.S. Weekly Total Oil Rig Count

A:--

F: --

P: --

WTI
  • WTI
  • XAUUSD
  • XAGUSD
  • USDX
U.S. Consumer Credit (SA) (Sept)

A:--

F: --

P: --
USDX
  • USDX
  • XAUUSD
  • XAGUSD
  • WTI
China, Mainland Foreign Exchange Reserves (Oct)

A:--

F: --

P: --

XAUUSD
  • XAUUSD
  • XAGUSD
  • WTI
  • USDX
China, Mainland Social Financing Scale (Oct)

--

F: --

P: --

China, Mainland M2 Money Supply YoY (Oct)

--

F: --

P: --

China, Mainland M0 Money Supply YoY (Oct)

--

F: --

P: --

China, Mainland M1 Money Supply YoY (Oct)

--

F: --

P: --

US President Trump delivered a speech
Japan Foreign Exchange Reserves (Oct)

A:--

F: --

P: --

USDJPY
  • USDJPY
  • XAUUSD
  • XAGUSD
  • WTI
China, Mainland CPI MoM (Oct)

A:--

F: --

P: --

XAUUSD
  • XAUUSD
  • XAGUSD
  • WTI
  • USDX
China, Mainland PPI YoY (Oct)

A:--

F: --

P: --

XAUUSD
  • XAUUSD
  • XAGUSD
  • WTI
  • USDX
China, Mainland CPI YoY (Oct)

A:--

F: --

P: --

XAUUSD
  • XAUUSD
  • XAGUSD
  • WTI
  • USDX
Japan Leading Indicators Prelim (Sept)

A:--

F: --

P: --

USDJPY
  • USDJPY
  • XAUUSD
  • XAGUSD
  • WTI
  • USDX
Germany Exports MoM (SA) (Sept)

A:--

F: --

P: --
EURUSD
  • EURUSD
  • XAUUSD
  • XAGUSD
  • WTI
  • USDX
Euro Zone Sentix Investor Confidence Index (Nov)

A:--

F: --

P: --

EURUSD
  • EURUSD
  • XAUUSD
  • XAGUSD
  • WTI
  • USDX
Mexico CPI YoY (Oct)

--

F: --

P: --

Canada National Economic Confidence Index

--

F: --

P: --

U.S. Conference Board Employment Trends Index (SA) (Oct)

--

F: --

P: --

U.S. Wholesale Sales MoM (SA) (Sept)

--

F: --

P: --

China, Mainland Imports (CNH) (Oct)

--

F: --

P: --

China, Mainland Exports (Oct)

--

F: --

P: --

China, Mainland Trade Balance (CNH) (Oct)

--

F: --

P: --

China, Mainland Imports YoY (CNH) (Oct)

--

F: --

P: --

China, Mainland Exports YoY (USD) (Oct)

--

F: --

P: --

China, Mainland Imports YoY (USD) (Oct)

--

F: --

P: --

China, Mainland Trade Balance (USD) (Oct)

--

F: --

P: --

Richmond Federal Reserve President Barkin delivered a speech.
BOE Gov Bailey Speaks
U.S. 3-Year Note Auction Yield

--

F: --

P: --

Japan Trade Balance (Sept)

--

F: --

P: --

U.K. BRC Like-For-Like Retail Sales YoY (Oct)

--

F: --

P: --

U.K. BRC Overall Retail Sales YoY (Oct)

--

F: --

P: --

Indonesia Retail Sales YoY (Sept)

--

F: --

P: --

Japan 30-Year JGB Auction Yield

--

F: --

P: --

France ILO Unemployment Rate (SA) (Q3)

--

F: --

P: --

FOMC Member Waller Speaks
South Africa Unemployment Rate (Q3)

--

F: --

P: --

U.S. NFIB Small Business Optimism Index (SA) (Oct)

--

F: --

P: --

U.S. Real Income MoM (SA) (Oct)

--

F: --

P: --

U.S. Core CPI MoM (SA) (Oct)

--

F: --

P: --

U.S. CPI YoY (Not SA) (Oct)

--

F: --

P: --

U.S. CPI MoM (SA) (Oct)

--

F: --

P: --

U.S. Core CPI YoY (Not SA) (Oct)

--

F: --

P: --

U.S. Core CPI (SA) (Oct)

--

F: --

P: --

U.S. CPI MoM (Not SA) (Oct)

--

F: --

P: --

Q&A with Experts
    • All
    • Chatrooms
    • Groups
    • Friends
    EuroTrader flag
    Areeba Mini❣️❣️
    @SkylarkFriends, I’ll be back in a little while
    @Areeba Mini❣️❣️Hey friend, you are going out while I'm just stepping in
    EuroTrader flag
    Osaghae Cephas
    @Skylarkcool
    @Osaghae CephasWhat's the update brother, did i miss anything?
    SlowBear ⛅ flag
    Skylark
    She does mate. She was holding long on gold. That was during Asia session. But I don't know if she has closed it for now.
    @Skylark Oh long on Gold too? i guess she has figured it all out
    EuroTrader flag
    Areeba Mini❣️❣️
    @Areeba Mini❣️❣️I always like the kind of results you pull out here in the room
    SlowBear ⛅ flag
    Osaghae Cephas
    @Skylarkcool
    @Osaghae CephasHey Champ how is it going today? what is your account looking like now?
    Skylark flag
    牛牛
    有准确率高指标吗,
    @牛牛Hello mate, how are you doing today and welcome? Concerning indicators, I would say, first of all, indicators lag, they lag. So, there are some indicators too that can help you. So, depending on what you need it for.so that I can know the one I can direct you to
    Skylark flag
    EuroTrader
    @Areeba Mini❣️❣️Hey friend, you are going out while I'm just stepping in
    Don't worry mate, she'll definitely come back. Maybe she could go to take care of her trades or one or two things.
    Skylark flag
    SlowBear ⛅
    @Skylark Oh long on Gold too? i guess she has figured it all out
    Yeah, she was holding a long position that was during the Asian session, so I don't know if she closed it now or she still holding it.
    Skylark flag
    EuroTrader
    @Areeba Mini❣️❣️I always like the kind of results you pull out here in the room
    @Areeba Mini❣️❣️Yeah, bro, she always turn up, you know? I told her she's just everywhere and she knows how to really fit in, a scalpy, intraday, swing, all of the above. And she's always good at it.
    EuroTrader flag
    牛牛
    有准确率高指标吗,
    @牛牛Hello mate, welcome to the room, how are you doing today?
    SlowBear ⛅ flag
    牛牛
    有准确率高指标吗,
    @牛牛 Well there is no such things as high accuracy
    EuroTrader flag
    Skylark
    Don't worry mate, she'll definitely come back. Maybe she could go to take care of her trades or one or two things.
    yeah it's fine, I will be anticipating her return because I've got a lot to ask her
    SlowBear ⛅ flag
    牛牛
    有准确率高指标吗,
    @牛牛What you would likely get is an indicator with a high probability, but then what do you mean when you say High accuracy?
    Skylark flag
    EuroTrader
    yeah it's fine, I will be anticipating her return because I've got a lot to ask her
    @EuroTraderAlright then, maybe she went out to enjoy or to celebrate on her wins today because she definitely makes some wins. Silver, gold, US 500, you know, many others. So maybe she went to celebrate, you know.
    Skylark flag
    Euro Zone Sentix Investor Confidence Index (Nov)
    Act:2.4,Prev:2.7,Fcst:2.1
    Economic Calendar
    Skylark flag
    Skylark
    [Economic Calendar] Euro Zone Sentix Investor Confidence Index (Nov)
    @牛牛 Check this out mate. What impact do you think it will have on EURUSD?
    Skylark flag
    Skylark
    [Economic Calendar] Euro Zone Sentix Investor Confidence Index (Nov)
    @牛牛though its not something impactful, its just a news that will settle In few minutes, that's if it does have some spike.
    Size flag
    牛牛
    有准确率高指标吗,
    @牛牛There are quite a few useful indicators out there, mate, but I wouldn't say any indicator has consistently high accuracy on its own.
    Size flag
    牛牛
    有准确率高指标吗,
    Personally, I prefer clean price action over relying on indicators.@牛牛
    Skylark flag
    Size
    @牛牛There are quite a few useful indicators out there, mate, but I wouldn't say any indicator has consistently high accuracy on its own.
    @牛牛The same thing I told him, mate. And depending on on what he wants from the indicators, you know. Indicators fit someone's strategy. You can't just give or use indicators anyhow. It must adapt with your strategy.
    Type here...
    Add Symbol or Code

      No matching data

      All
      Recommend
      Stocks
      Cryptocurrencies
      Central Banks
      Trump Updates
      Featured News
      • All
      • Russia-Ukraine Conflict
      • Middle East Flashpoint
      • All
      • Russia-Ukraine Conflict
      • Middle East Flashpoint
      Search
      Products

      Charts Free Forever

      Chats Q&A with Experts
      Screeners Economic Calendar Data Tools
      Membership Features
      Data Warehouse Market Trends Institutional Data Policy Rates Macro

      Market Trends

      Market Sentiment Order Book Forex Correlations

      Top Indicators

      Charts Free Forever
      Markets

      News

      24/7 Analysis Education

      Latest Views

      Latest Update

      Signals

      Copy Rankings Latest Signals Become a signal provider AI Rating
      Contests
      Brokers

      Overview Brokers Assessment Rankings Regulators News Claims
      Broker listing Forex Brokers Comparison Tool Live Spread Comparison Scam
      Q&A Complaint Scam Alert Videos Tips to Detect Scam
      More

      Business
      Events
      Careers About Us Advertising Help Center

      White Label

      Broker API

      Data API

      Web Plug-ins

      Affiliate Program

      Awards Institution Evaluation IB Seminar Salon Event Exhibition
      Vietnam Thailand Singapore Dubai
      Fans Party Investment Sharing Session
      FastBull Summit BrokersView Expo
      Recent Searches
        Top Searches
          Markets
          Analysis
          User
          24/7
          Economic Calendar
          Education
          Data
          • Names
          • Latest
          • Prev

          View All

          No data

          Scan to Download

          Faster Charts, Chat Faster!

          Download
          English
          • English
          • Español
          • العربية
          • Bahasa Indonesia
          • Bahasa Melayu
          • Tiếng Việt
          • ภาษาไทย
          • Français
          • Italiano
          • Türkçe
          • Русский язык
          • 简中
          • 繁中
          Open Account
          Search
          Products
          Charts Free Forever
          Markets
          News
          Signals

          Copy Rankings Latest Signals Become a signal provider AI Rating
          Contests
          Brokers

          Overview Brokers Assessment Rankings Regulators News Claims
          Broker listing Forex Brokers Comparison Tool Live Spread Comparison Scam
          Q&A Complaint Scam Alert Videos Tips to Detect Scam
          More

          Business
          Events
          Careers About Us Advertising Help Center

          White Label

          Broker API

          Data API

          Web Plug-ins

          Affiliate Program

          Awards Institution Evaluation IB Seminar Salon Event Exhibition
          Vietnam Thailand Singapore Dubai
          Fans Party Investment Sharing Session
          FastBull Summit BrokersView Expo

          XRP Faces Potential Decline as Key Support Weakens

          zhan chen
          Summary:

          XRP faces potential decline as technical weakness puts key support at risk. Explore bearish signals, key price levels and what could reverse the outlook.

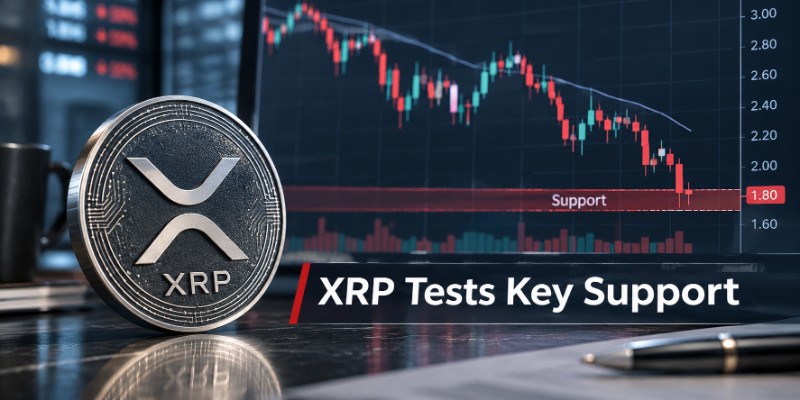
          XRP is facing renewed downside pressure as weakening momentum and a fragile technical structure put important support levels at risk. Traders are watching whether buyers can defend the latest support zone or whether continued selling will open the door to a deeper correction.
          XRP Faces Potential Decline as Key Support Weakens_1

          Table of Contents

          • XRP Price Weakness Raises Concerns About Key Support
          • Bearish Technical Indicators Challenge XRP's Recovery
          • Can XRP Hold the $1.18 Support Level?
          • A Failed Recovery Could Increase Downside Risks
          • What Could Invalidate the Bearish XRP Outlook?
          • Broader Cryptocurrency Market Conditions Could Influence XRP
          • What Traders Should Watch Before XRP's Next Move
          • XRP Price Outlook: Further Declines Remain Possible

          XRP Price Weakness Raises Concerns About Key Support

          XRP's recent price behavior has increased concerns about its short-term outlook. Rather than establishing a sustained recovery, the cryptocurrency has struggled to regain upward momentum, leaving its price vulnerable to further selling pressure. The weakness matters because XRP is approaching levels where buyers previously attempted to defend the market.

          COINOTAG's November 6, 2026 daily technical snapshot used $1.1826 as its reference price and identified immediate support at $1.1766 and resistance at $1.2226. The analysis showed a strong bearish bias, with price below all eight monitored moving averages. These readings describe a specific daily snapshot, not a permanent set of price levels.

          The decline reflects more than an isolated intraday pullback. XRP has encountered difficulty sustaining upward movements, while technical indicators suggest that sellers retain the advantage across shorter timeframes. When an asset repeatedly fails to recover after a decline, market participants may become less willing to buy temporary rebounds, particularly when broader market sentiment is uncertain.

          Moving averages help traders distinguish short-term fluctuations from broader directional trends. When an asset trades below several important averages, those averages can become resistance during recovery attempts. XRP's position below its monitored averages suggests that buyers may need more than a brief bounce to establish a convincing reversal.

          However, technical weakness does not mean another decline is inevitable. Demand could return around nearby support and help the market stabilize. The important question is whether buyers can turn stabilization into a sustained recovery.

          Bearish Technical Indicators Challenge XRP's Recovery

          Several technical indicators are contributing to the cautious outlook for XRP. Among the most closely watched are the Relative Strength Index (RSI), moving averages and momentum indicators such as the Moving Average Convergence Divergence (MACD).

          The RSI measures the speed and magnitude of recent price movements. It generally ranges from zero to 100, with readings below 30 commonly interpreted as oversold and readings above 70 as overbought. COINOTAG's November 6 assessment placed XRP's daily RSI at approximately 33.3, while its four-hour RSI stood near 28.0. The shorter timeframe therefore showed more pronounced selling pressure.

          A four-hour RSI below 30 can attract buyers looking for a technical rebound. Nevertheless, an oversold reading does not prove that a decline has ended. During a persistent downtrend, an asset can remain oversold as sellers continue to dominate trading activity.

          The MACD offers another way to evaluate whether bearish momentum is strengthening or weakening. When the MACD line remains below its signal line and both sit in negative territory, traders generally interpret the configuration as evidence of downward momentum. The November 6 daily snapshot showed a negative MACD reading and a negative histogram, consistent with a bearish momentum signal.

          The broader concern is that any potential rebound has not yet been supported by convincing evidence of a trend reversal. Even if selling pressure begins to ease, buyers will need to push the price higher and maintain those gains to change the technical picture. Moving averages add another challenge: XRP needs to recover important short-term averages before traders can confidently argue that its downward structure is improving.

          Can XRP Hold the $1.18 Support Level?

          The $1.18 area has become an important near-term reference point for XRP traders. It sits close to the technical support identified at $1.1766, making this zone worth monitoring as the market attempts to stabilize.

          A successful defense could give buyers an opportunity to slow the decline and establish a short-term trading range. However, repeated tests of the same support can weaken confidence in its ability to hold, particularly when buying interest remains limited.

          The next technical support levels in the November 6 snapshot were around $1.1382 and $1.0497. These are potential areas to monitor if selling pressure intensifies, not guaranteed price targets. Their relevance may change as new daily candles form and market conditions evolve.

          The distinction between an intraday move below support and a confirmed breakdown is important. A temporary dip may reflect short-term volatility or stop-loss activity. A sustained daily close below $1.1766 would provide stronger evidence that sellers have gained additional control.

          Traders may therefore focus on daily closing prices, trading volume and the market's response to recovery attempts. A breakdown accompanied by expanding selling volume would generally carry more bearish significance than a brief move below support followed by a rapid recovery.

          A Failed Recovery Could Increase Downside Risks

          If XRP cannot defend the $1.18 region, attention may shift toward lower support areas. Such a move would reinforce the existing bearish structure and potentially encourage additional selling from short-term traders.

          The first challenge for buyers would be to prevent the market from establishing a sustained position below nearby support. If that effort fails, the next technical areas around $1.14 and $1.05 could become increasingly relevant.

          A breakdown could also affect market psychology. Traders who previously viewed the decline as a temporary correction may reconsider their positions if XRP continues making lower lows. This could increase selling pressure, especially among participants using leverage or following short-term technical signals.

          Nevertheless, a bearish scenario would become less convincing if XRP quickly recovered the broken support area. Such a move could indicate that the breakdown was a temporary liquidity event rather than the beginning of another extended downward movement. Confirmation matters more than a single price print.

          What Could Invalidate the Bearish XRP Outlook?

          Despite the negative short-term structure, XRP's downside outlook is not irreversible. A meaningful recovery would require buyers to demonstrate that selling pressure is fading and that demand can support higher prices.

          The first positive signal would be a sustained move above immediate resistance near $1.2226. A daily close above this level could indicate that buyers are beginning to regain control. The next areas to watch would be $1.2546 and $1.291, where additional technical resistance could limit a recovery.

          A stronger bullish signal would emerge if XRP reclaimed these levels with increasing trading volume. Rising prices accompanied by stronger participation would provide better evidence of genuine demand than a low-volume rebound.

          There is also an important distinction between short-term and longer-term indicators. COINOTAG's November 6 analysis showed a strong bearish bias on both four-hour and daily charts, while the weekly outlook retained a bullish bias, with weekly RSI near 42.5. This divergence suggests that near-term weakness does not necessarily invalidate the broader recovery structure.

          However, the weekly outlook would need confirmation from improving price action. Without that confirmation, short-term bearish momentum could continue to dominate trading decisions.

          Broader Cryptocurrency Market Conditions Could Influence XRP

          XRP does not trade independently of the wider cryptocurrency market. Bitcoin's direction, overall risk appetite and liquidity conditions can influence demand for major altcoins.

          When Bitcoin experiences significant selling pressure, investors may reduce exposure to other cryptocurrencies, including XRP. This can make it more difficult for XRP to recover even when its own technical indicators begin showing signs of stabilization.

          The broader market environment also matters because institutional and retail investors often adjust cryptocurrency exposure according to macroeconomic expectations. Changes in interest-rate expectations, inflation concerns and geopolitical uncertainty can affect demand for risk-sensitive assets.

          Derivatives activity is another factor. High leverage can amplify price movements when markets approach important technical levels. If XRP falls below support while leveraged traders are heavily positioned, forced liquidations could add to selling pressure.

          Conversely, declining open interest combined with stabilizing prices could indicate that excessive speculative positioning is being reduced. Such a development would not guarantee a recovery, but it could help create more stable conditions for buyers.

          Traders should therefore consider XRP's technical structure alongside Bitcoin's performance, broader market liquidity and derivatives positioning rather than relying on a single indicator.

          What Traders Should Watch Before XRP's Next Move

          The coming trading sessions could help determine whether XRP is entering another downward leg or attempting to establish a temporary bottom. Several signals deserve particular attention:

          • Daily closing prices: A sustained close below nearby support would strengthen the bearish scenario, while a recovery above resistance could weaken it.
          • Trading volume: Expanding volume during a decline may confirm stronger selling participation. Increasing volume during a recovery would provide evidence of renewed buying interest.
          • RSI recovery: A move back above 30 on shorter timeframes could indicate easing selling pressure, although it would not independently confirm a trend reversal.
          • Bitcoin direction: A continued decline across the broader cryptocurrency market could make XRP's recovery more difficult.
          • Derivatives positioning: Changes in open interest, funding rates and liquidations may reveal whether speculative selling is intensifying.

          These indicators are most useful when they point in the same direction. For example, a move above resistance supported by stronger spot-market volume and improving momentum would provide a more convincing bullish signal than an isolated price spike.

          XRP Price Outlook: Further Declines Remain Possible

          XRP's immediate technical outlook remains cautious as weakening momentum and nearby support create an unfavorable short-term trading environment. If buyers fail to defend the current price structure, the cryptocurrency could face additional downside pressure, with lower support areas becoming increasingly important.

          Nevertheless, the possibility of a rebound should not be dismissed. Oversold conditions, improving weekly momentum and a recovery above immediate resistance could change the market's direction.

          For now, the key issue is whether buyers can establish a sustained defense rather than simply produce temporary rebounds. Until XRP demonstrates stronger demand and reclaims important technical levels, the risk of further declines remains relevant.

          Traders should monitor confirmed price movements, volume and broader cryptocurrency conditions before drawing conclusions about the next major trend. Technical support levels provide useful reference points, but they are not guarantees against further losses.

          Risk Warnings and Disclaimers
          You understand and acknowledge that there is a high degree of risk involved in trading. Following any strategies or investment methods may lead to potential losses. The content on the site is provided by our contributors and analysts for information purposes only. You are solely responsible for determining whether any trading assets, securities, strategy, or any other product is suitable for investing based on your own investment objectives and financial situation.
          Add to Favorites
          Share
          FastBull
          Copyright © 2026 FastBull Ltd

          728 RM B 7/F GEE LOK IND BLDG NO 34 HUNG TO RD KWUN TONG KLN HONG KONG

          TelegramInstagramTwitterfacebooklinkedin
          App Store Google Play Android Windows
          Products
          Charts

          Chats

          Q&A with Experts
          Screeners
          Economic Calendar
          Data
          Tools
          Membership
          Features
          Function
          Markets
          Copy Trading
          Latest Signals
          Contests
          24/7
          Analysis
          Education
          Company
          Careers
          About Us
          Contact Us
          Advertising
          Download FastBull
          Help Center
          Feedback
          User Agreement
          Privacy Policy
          Personal Information Protection Statement
          Business

          White Label

          Broker API

          Data API

          Web Plug-ins

          Poster Maker

          Affiliate Program

          Risk Disclosure

          The risk of loss in trading financial instruments such as stocks, FX, commodities, futures, bonds, ETFs and crypto can be substantial. You may sustain a total loss of the funds that you deposit with your broker. Therefore, you should carefully consider whether such trading is suitable for you in light of your circumstances and financial resources.

          No decision to invest should be made without thoroughly conducting due diligence by yourself or consulting with your financial advisors. Our web content might not suit you since we don't know your financial conditions and investment needs. Our financial information might have latency or contain inaccuracy, so you should be fully responsible for any of your trading and investment decisions. The company will not be responsible for your capital loss.

          Without getting permission from the website, you are not allowed to copy the website's graphics, texts, or trademarks. Intellectual property rights in the content or data incorporated into this website belong to its providers and exchange merchants.

          Not Logged In

          Log in to access more features

          Connect Broker
          Become a signal provider
          Help Center
          Customer Service
          Dark Mode
          Price Up/Down Colors

          Log In

          Sign Up

          Position
          Layout
          Fullscreen
          Default to Chart
          The chart page opens by default when you visit fastbull.com