- XAUUSD
- XAGUSD
- WTI
- USDX
Markets
Analysis
User
24/7
Economic Calendar
Education
Data
- Names
- Latest
- Prev


Signal Accounts for Members
All Signal Accounts
All Contests


The White House: The United States And Finland Will Cooperate On 5G And 6G Network Technologies
The White House: The United States And Finland Will Advance Cooperation On Small Modular Reactors And Nuclear Energy
European Central Bank President Christine Lagarde: The Process Of Finding My Successor Has Begun, And The Candidates Will Be Better Than Me; There Is No Need To Worry About A Power Vacuum
European Central Bank President Christine Lagarde: My Voice Helps To Advance The Principles I Cherish
European Central Bank President Christine Lagarde: I Want The Freedom To Participate In Non-policy Matters
U.S. Natural Gas Futures Fell More Than 3.00%, Currently Trading At $3.364 Per Million British Thermal Units
The United States And Finland Signed A Memorandum Of Understanding On Science And Technology Cooperation On October 29
European Central Bank President Christine Lagarde: We Will Not Change Our Bond Redemption Policy
European Commission President Ursula Von Der Leyen: We Must Work With Canada To Adjust Our Strategic Posture In The Arctic In Order To Defend Our Shared Values
The Main Methanol Futures Contract Rose By 2.00% Intraday, Currently Trading At 3500.00 Yuan/ton
European Commission President Ursula Von Der Leyen: Tomorrow, We Will Finalize An Agreement To Include Canada In The European Supercomputing Infrastructure

South Africa PPI YoY (Sept)A:--
F: --
P: --
U.K. M4 Money Supply YoY (Sept)A:--
F: --
P: --
Euro Zone Consumer Inflation Expectations (Oct)A:--
F: --
P: --
Euro Zone Selling Price Expectations (Oct)A:--
F: --
P: --
Euro Zone Industrial Climate Index (Oct)A:--
F: --
P: --
Euro Zone Consumer Confidence Index Final (Oct)A:--
F: --
P: --
Euro Zone Economic Sentiment Indicator (Oct)A:--
F: --
P: --
Euro Zone Services Sentiment Index (Oct)A:--
F: --
P: --
Italy 5-Year BTP Bond Auction Avg. YieldA:--
F: --
P: --
Italy 10-Year BTP Bond Auction Avg. YieldA:--
F: --
P: --
U.S. Initial Jobless Claims 4-Week Avg. (SA)A:--
F: --
U.S. Weekly Continued Jobless Claims (SA)A:--
F: --
U.S. Real Personal Consumption Expenditures MoM (Sept)A:--
F: --
U.S. PCE Price Index MoM (Sept)A:--
F: --
P: --
U.S. Personal Income MoM (Sept)A:--
F: --
U.S. PCE Price Index YoY (SA) (Sept)A:--
F: --
P: --
U.S. PCE Price Index Prelim QoQ (SA) (Q3)A:--
F: --
P: --
U.S. Core PCE Price Index MoM (Sept)A:--
F: --
U.S. GDP Deflator Prelim QoQ (SA) (Q3)A:--
F: --
P: --
U.S. Real Personal Consumption Expenditures Prelim QoQ (Q3)A:--
F: --
P: --
U.S. Core PCE Price Index Annualized QoQ Prelim (SA) (Q3)A:--
F: --
P: --
U.S. Personal Outlays MoM (SA) (Sept)A:--
F: --
P: --
U.S. Real GDP Annualized QoQ Prelim (SA) (Q3)A:--
F: --
P: --
U.S. Weekly Initial Jobless Claims (SA)A:--
F: --
U.S. Core PCE Price Index YoY (Sept)A:--
F: --
P: --
Euro Zone ECB Deposit RateA:--
F: --
P: --
Euro Zone ECB Main Refinancing RateA:--
F: --
P: --
Euro Zone ECB Marginal Lending RateA:--
F: --
P: --
ECB Monetary Policy Statement
ECB Press Conference
U.S. Dallas Fed PCE Price Index YoY (Sept)--
F: --
P: --
U.S. EIA Weekly Natural Gas Stocks ChangeA:--
F: --
P: --
Brazil CAGED Net Payroll Jobs (Sept)--
F: --
P: --
U.S. Weekly Treasuries Held by Foreign Central Banks--
F: --
P: --
South Korea Retail Sales MoM (Sept)--
F: --
P: --
South Korea Services Output MoM (Sept)--
F: --
P: --
South Korea Industrial Output MoM (SA) (Sept)--
F: --
P: --
Japan Tokyo CPI MoM (Oct)--
F: --
P: --
Japan Jobs to Applicants Ratio (Sept)--
F: --
P: --
Japan Tokyo CPI YoY (Oct)--
F: --
P: --
Japan Tokyo Core CPI YoY (Oct)--
F: --
P: --
Japan Unemployment Rate (Sept)--
F: --
P: --
Japan Tokyo CPI MoM (Excl. Food & Energy) (Oct)--
F: --
P: --
Japan Retail Sales MoM (SA) (Sept)--
F: --
Japan Retail Sales YoY (Sept)--
F: --
Japan Industrial Output Prelim MoM (Sept)--
F: --
P: --
Japan Industrial Output Prelim YoY (Sept)--
F: --
P: --
Japan Industrial Inventory MoM (Sept)--
F: --
P: --
Japan Retail Sales (Sept)--
F: --
P: --
Australia PPI YoY (Q3)--
F: --
P: --
Australia PPI QoQ (Q3)--
F: --
P: --
Japan Benchmark Interest Rate--
F: --
P: --
BOJ Monetary Policy Statement
Japan Construction Orders YoY (Sept)--
F: --
P: --
Japan New Housing Starts YoY (Sept)--
F: --
P: --
France GDP Prelim YoY (SA) (Q3)--
F: --
P: --
BOJ Press Conference
Turkey Economic Sentiment Indicator (Oct)--
F: --
P: --
U.K. Nationwide House Price Index MoM (Oct)--
F: --
P: --
U.K. Nationwide House Price Index YoY (Oct)--
F: --
P: --
France PPI MoM (Sept)--
F: --
P: --


No matching data
Chainlink (LINK) is trading at $13.36, following a 3% drop in the past 24 hours, which places the altcoin approximately 74% below its all-time high of $52.70, recorded in May.
Despite this short-term dip, LINK has held onto weekly gains of around 2.4%, suggesting broader market participants may still be weighing its long-term potential.
While price remains rangebound, recent on-chain data indicates that LINK’s price action could be the result of diverging behavior between retail and institutional investors.
Chainlink Institutional Accumulation and Supply Pressure
CryptoQuant contributor “Banker” highlighted a growing structural dynamic in the LINK ecosystem in a recent QuickTake analysis titled “LINK’s Accumulation Standoff: Whales Build, Retail Waits.”
The report outlines how LINK is currently in a consolidation phase between $12 and $15, where institutional actors have been steadily accumulating tokens, while retail users remain largely passive.
This discrepancy may be playing a key role in capping upward momentum despite persistent LINK outflows from centralized exchanges.
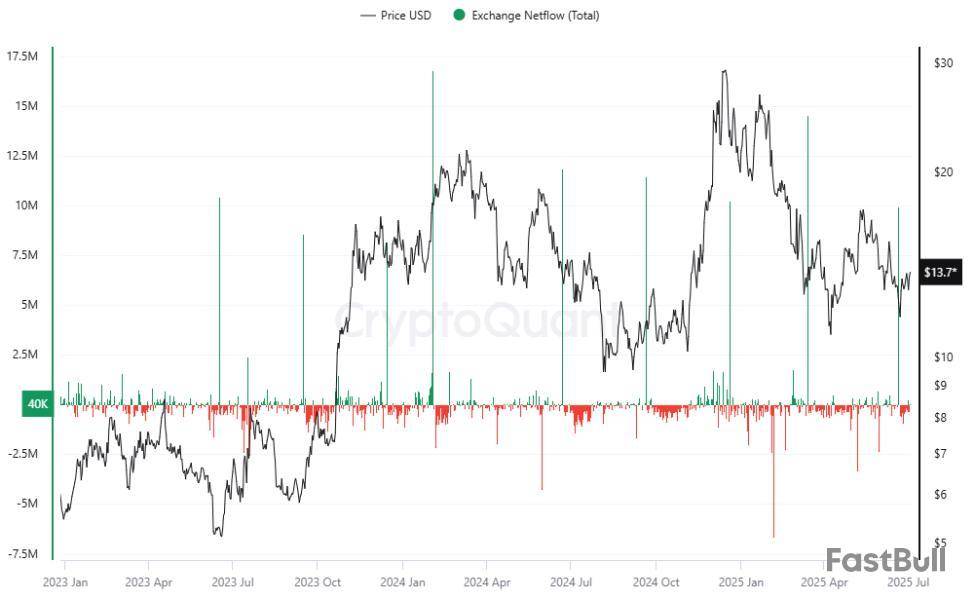
According to Banker, exchange netflows for LINK have remained negative at roughly -100,000 LINK per week, signaling that more tokens are being withdrawn from trading platforms than deposited.
This behavior is typically associated with accumulation activity, particularly from larger holders or “whales” who may be positioning for longer-term appreciation.
Historical spikes in retail deposits, such as the +5 million LINK deposited in March 2025, have proven to be exceptions rather than the norm, as retail activity has since remained subdued.
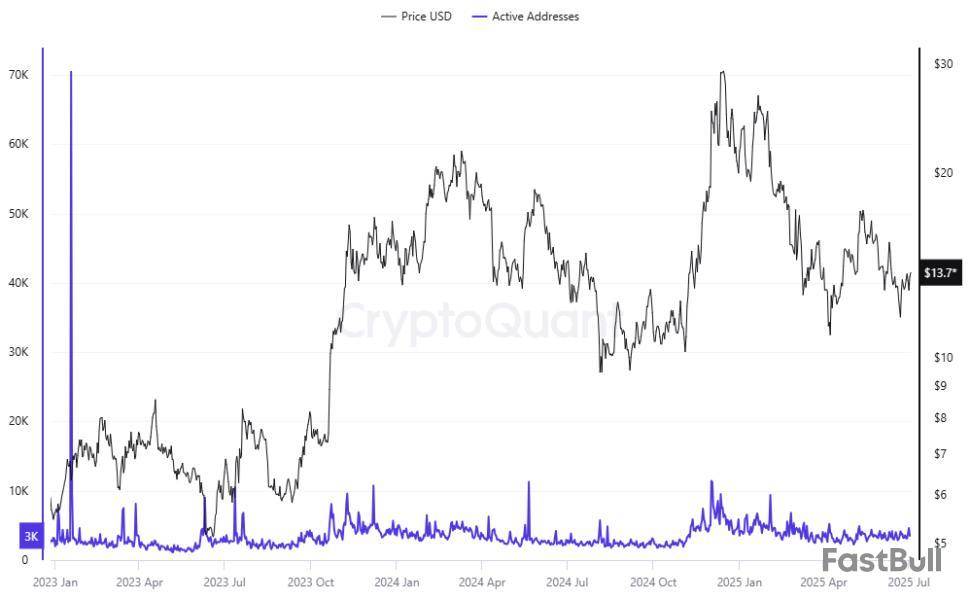
Supporting this view, active LINK addresses have hovered consistently between 28,000 and 32,000 per day, while transaction counts average around 9,000 daily. These figures have not rebounded from previous activity peaks seen in late 2024, even as Chainlink’s oracle usage has expanded.
Meanwhile, elevated levels of exchange withdrawals, peaking at over 3,000 per day in Q4 2024, remain a dominant force. With leverage metrics staying neutral, whales have been able to withdraw LINK without introducing significant price volatility, resulting in a 40% year-to-date drop in exchange reserves.
Market Outlook Hinges on Retail Reentry or Whale Fatigue
As LINK’s consolidation persists, the path forward may depend on a shift in market dynamics. Banker points out that a meaningful breakout will likely require renewed participation from retail traders, as evidenced by a spike in active wallet addresses and transaction volume.
If these metrics rise and price breaks above the $15 price mark, momentum could build for a stronger upward trend. On the other hand, a decline in whale-driven withdrawals or an increase in exchange inflows could weaken accumulation, potentially pushing LINK back down toward the $10 level. Banker added:
Until catalysts emerge, whales silently build positions, echoing Bitcoin’s 2023 consolidation before its 2024 surge.
Featured image created with DALL-E, Chart from TradingView
The risk of loss in trading financial instruments such as stocks, FX, commodities, futures, bonds, ETFs and crypto can be substantial. You may sustain a total loss of the funds that you deposit with your broker. Therefore, you should carefully consider whether such trading is suitable for you in light of your circumstances and financial resources.
No decision to invest should be made without thoroughly conducting due diligence by yourself or consulting with your financial advisors. Our web content might not suit you since we don't know your financial conditions and investment needs. Our financial information might have latency or contain inaccuracy, so you should be fully responsible for any of your trading and investment decisions. The company will not be responsible for your capital loss.
Without getting permission from the website, you are not allowed to copy the website's graphics, texts, or trademarks. Intellectual property rights in the content or data incorporated into this website belong to its providers and exchange merchants.
Not Logged In
Log in to access more features
Log In
Sign Up