


Markets
Analysis
User
24/7
Economic Calendar
Education
Data
- Names
- Latest
- Prev


Bitcoin's historic playbook is no longer relevant, according to research and brokerage firm K33's October outlook, which argues that the familiar four-year halving cycle — once the market's metronome — has been rendered obsolete by the rise of institutional adoption, sovereign participation, and macro policy alignment.
Bitcoin hit new all-time highs this week in both U.S. dollars and euros — its first euro-denominated record since January 2025.
"The 4-year cycle is dead, long live the king," K33 Head of Research Vetle Lunde wrote in the report, suggesting that this time is indeed different and bitcoin has entered a fundamentally new regime where structural forces, not retail mania, dictate its trajectory.
However, Lunde conceded the market looks overheated in the near term, noting that bitcoin ETF and derivatives exposure surged by over 63,000 BTC ($7.75 billion) in a single week — the strongest accumulation of 2025. Open interest on CME futures jumped by nearly 15,000 BTC, while U.S. ETFs absorbed over 31,600 BTC in seven days. Historically, similar spikes have marked local tops and mean reversion plays. Still, the analyst expects only short-term consolidation, not a structural reversal.
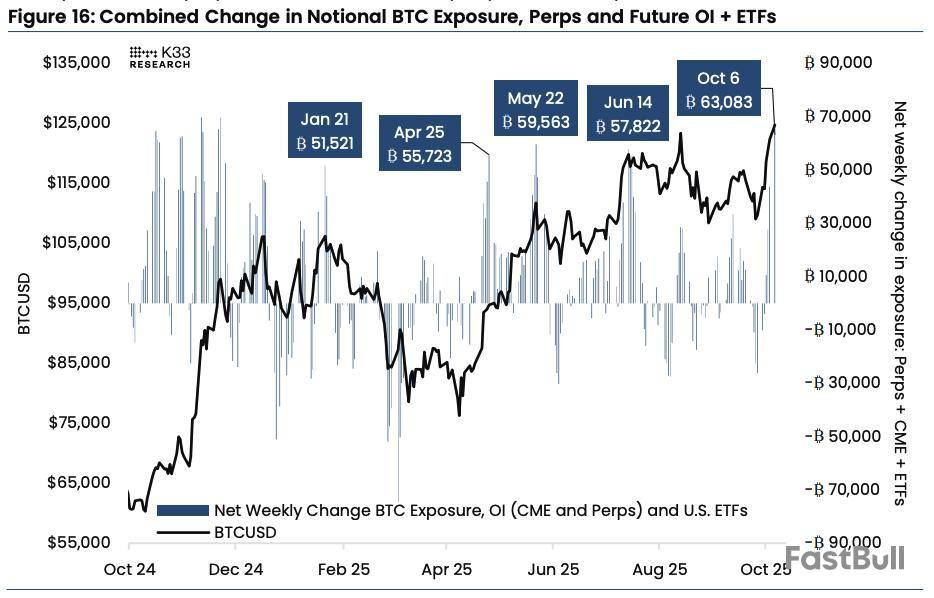
Combined change in notional BTC exposure, perps, and futures OI + ETFs. Image: K33.
K33 positions 2025's rally as the antithesis of prior euphoric bitcoin peaks. In 2017, optimism over CME's futures launch fueled a blow-off top, and in 2021, the dream of ETFs ended in Securities and Exchange Commission rejection. However, in 2025, those dreams are a reality, Lunde said, and bitcoin is now a material part of the global institutional market.
BlackRock now manages roughly $100 billion in bitcoin ETF assets, Morgan Stanley is guiding clients toward up to 4% crypto allocations, and Washington D.C. has embraced a crypto-friendly agenda — including President Trump's Strategic Bitcoin Reserve and plans to open 401(k) plans to digital assets, the analyst noted.
"During the 2021 climax, tighter monetary policy and expected post-COVID sobriety coincided with the peak. In 2026, Trump is expected to replace Jerome Powell with a rate-cutting marionette, putting out the fire from the expansionary Big Beautiful Bill with gasoline," Lunde said. "Abundance, rather than restrictive austerity, is on the books, a setup clearly favoring scarce assets like bitcoin."
No October peak?
While historical fractal analysis suggests bitcoin could be nearing a cyclical high — 1,051 days from the November 2022 bottom, roughly matching the approximate 1,060-day expansions of prior bull runs — Lunde dismissed such symmetry as a coincidence.
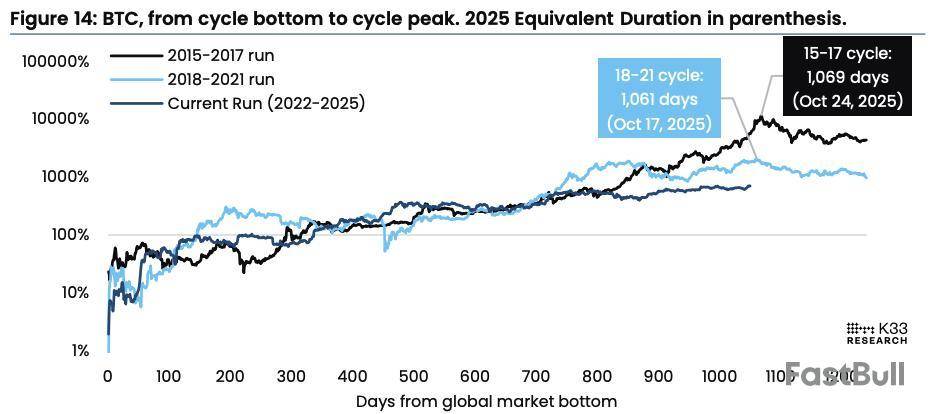
BTC from cycle bottom to cycle peak. Image: K33.
"Fractals are lazy," he said. Instead, K33 applies a six-part framework of market risk factors, including assessment of funding rates, RSI, bitcoin dominance decline, perps vs. spot volumes, social trends, and supply dynamics.
Only two indicators — perp/spot divergence and an overbought RSI metric — currently flash red. By K33's measure, that keeps the market outside the "danger zone" typical of prior peaks, and means bitcoin's price action remains healthy. "Nothing points toward another repeat of the dreaded 4-year cycle," Lunde concluded.
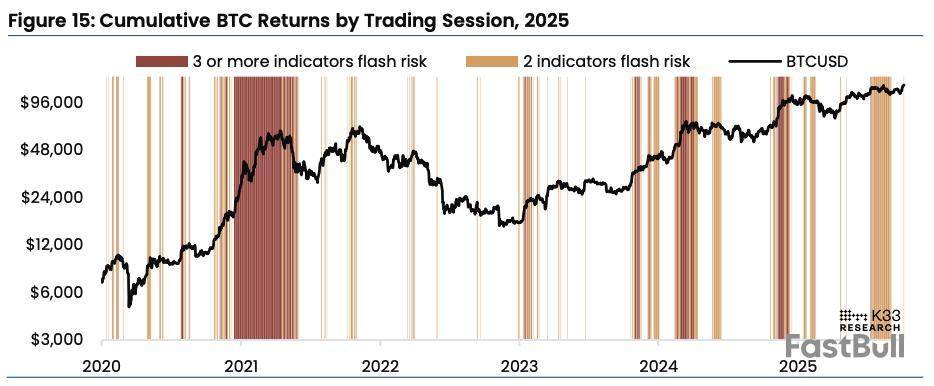
Cumulative BTC returns by trading session, 2025. Image: K33.
Disclaimer: The Block is an independent media outlet that delivers news, research, and data. As of November 2023, Foresight Ventures is a majority investor of The Block. Foresight Ventures invests in other companies in the crypto space. Crypto exchange Bitget is an anchor LP for Foresight Ventures. The Block continues to operate independently to deliver objective, impactful, and timely information about the crypto industry. Here are our current financial disclosures.
© 2025 The Block. All Rights Reserved. This article is provided for informational purposes only. It is not offered or intended to be used as legal, tax, investment, financial, or other advice.
728 RM B 7/F GEE LOK IND BLDG NO 34 HUNG TO RD KWUN TONG KLN HONG KONG


The risk of loss in trading financial instruments such as stocks, FX, commodities, futures, bonds, ETFs and crypto can be substantial. You may sustain a total loss of the funds that you deposit with your broker. Therefore, you should carefully consider whether such trading is suitable for you in light of your circumstances and financial resources.
No decision to invest should be made without thoroughly conducting due diligence by yourself or consulting with your financial advisors. Our web content might not suit you since we don't know your financial conditions and investment needs. Our financial information might have latency or contain inaccuracy, so you should be fully responsible for any of your trading and investment decisions. The company will not be responsible for your capital loss.
Without getting permission from the website, you are not allowed to copy the website's graphics, texts, or trademarks. Intellectual property rights in the content or data incorporated into this website belong to its providers and exchange merchants.
Not Logged In
Log in to access more features


Log In
Sign Up


