• Trade
  • Markets
  • Copy
  • Contests
  • 24/7
  • Calendar
  • Q&A
  • Chats
Screeners
SYMBOL
LAST
BID
ASK
HIGH
LOW
NET CHG.
%CHG.
SPREAD
SOURCE
SPX
S&P 500 Index
7316.16
7316.16
7316.16
7450.84
7313.92
-112.61
-1.52%
--
--
DJI
Dow Jones Industrial Average
51594.44
51594.44
51594.44
52674.21
51551.18
-1152.88
-2.19%
--
--
IXIC
NASDAQ Composite Index
24442.95
24442.95
24442.95
25054.53
24425.34
-433.95
-1.74%
--
--
USDX
US Dollar Index
100.520
100.520
100.600
100.880
100.410
-0.100
-0.10%
--
--
EURUSD
Euro / US Dollar
1.14709
1.14709
1.14716
1.14794
1.14341
+0.00057
+ 0.05%
--
--
GBPUSD
Pound Sterling / US Dollar
1.33792
1.33792
1.33801
1.33954
1.33325
+0.00127
+ 0.10%
--
--
XAUUSD
Gold / US Dollar
4076.50
4076.50
4076.91
4100.26
4028.33
+9.15
+ 0.22%
--
--
WTI
Light Sweet Crude Oil
82.914
82.914
82.944
84.435
82.122
-0.649
-0.78%
--
--

Community Accounts

Signal Accounts
--
Profit Accounts
--
Loss Accounts
--
View More

Become a signal provider

Sell trading signals to earn additional income

View More

Guide to Copy Trading

Get started with ease and confidence

View More

Signal Accounts for Members

All Signal Accounts

Best Return
  • Best Return
  • Best P/L
  • Best MDD
Past 1W
  • Past 1W
  • Past 1M
  • Past 1Y

All Contests

  • All
  • Recommend
  • Stocks
  • Cryptocurrencies
  • Central Banks
  • Trump Updates
  • Featured News
Top News Only
Share

Polish Prime Minister Tusk: The United States Is Willing To Participate In The Investigation Of The Missile

Share

Ministry Of Industry And Information Technology: China's Software Industry Generated RMB 7,718.2 Billion In Revenue In The First Half Of The Year, An Increase Of 9.5% Year-on-Year

Share

Polish Prime Minister Tusk: There Is No Reason To Believe That Poland Was The Target Of The Falling Missile

Share

The USD/JPY Pair Briefly Fell 70 Points Before Quickly Rebounding, And Is Currently Down About 0.4% At 162.75

Share

The EU Has Already Disbursed €3.47 Billion To Ukraine Under A €90 Billion Loan Program Supporting Ukraine

Share

Market Sources: Agricultural Market Sources Reported That Ukrainian Drones Struck Sunflower Oil Export Facilities At Russia's Taman Port, Located In The Kerch Strait

Share

The EU Says The Latest Funding For Ukraine Will Be Used For Drones, Missiles, Air Defense Systems And Fighter Jets

Share

Italy's June Year-on-Year PPI Rose By 6.8%, Down From The Previous Reading Of 9.10%

Share

Italy's June PPI M/m Was 0%, Compared To A Previous Reading Of -0.50%

Share

French President Emmanuel Macron Condemns The Violation Of Polish Airspace

Share

Japanese Prime Minister Sanae Takaichi: We Will Seek Ways To Allow Japan More Flexibility In Adjusting Sales Tax Rates

Share

Japanese Prime Minister Sanae Takaichi Plans To Reduce The Food Sales Tax To 1% Starting In April 2027, With A Two-year Grace Period

Share

Japanese Prime Minister Sanae Takaichi: We Will Review Potential Sources Of Revenue, Such As Foreign Exchange Reserves, Non-tax Revenue, And Spending Reforms

Share

The Russian Ministry Of Defense Announced That It Has Occupied Chernyshevka In The Donetsk Region Of Ukraine, Malaslobidka And Mokhlitsky In The Sumy Region, And Yurchenkov In The Kharkiv Region

Share

Japanese Prime Minister Sanae Takaichi: We Will Ensure Market Confidence By Providing Funding For Temporary Tax Cuts Without Resorting To Issuing Government Bonds

Share

Polish Prime Minister: Poland Is In Contact With NATO Regarding The Missile Incident

Share

The Ukrainian Military: The Commander Of The Ukrainian Drone Force Said That Ukrainian Troops Hit Four Russian Oil Tankers In The Black Sea And The Sea Of Azov

Share

The Ministry Of Commerce Has Released The Results Of The 2025 Assessment And Evaluation Of The Comprehensive Development Levels Of National-level Economic And Technological Development Zones

Share

Turkey Is Expected To Continue Receiving Oil Supplies From Iraq

Share

Italy's Unemployment Rate In June Was 5.7%, Compared With An Expected 5.1% And A Previous Reading Revised Upward From 5.00% To 5.3%

TIME
ACT
FCST
PREV
IMPACT
Russia Unemployment Rate (Jun)

A:--

F: --

P: --

WTI
  • WTI
  • XAUUSD
  • XAGUSD
  • USDX
Brazil CAGED Net Payroll Jobs (Jun)

A:--

F: --

P: --

XAUUSD
  • XAUUSD
  • XAGUSD
  • WTI
  • USDX
U.S. Target Federal Funds Rate Lower Limit (Overnight Reverse Repo Rate)

A:--

F: --

P: --

XAUUSD
  • XAUUSD
  • XAGUSD
  • WTI
  • USDX
U.S. Target Federal Funds Rate Upper Limit (Excess Reserves Ratio)

A:--

F: --

P: --

XAUUSD
  • XAUUSD
  • XAGUSD
  • WTI
  • USDX
FOMC Statement
FOMC Press Conference
Australia Building Permits MoM (SA) (Jun)

A:--

F: --

P: --
AUDUSD
  • AUDUSD
  • XAUUSD
  • XAGUSD
  • WTI
  • USDX
Australia Import Price Index YoY (Q2)

A:--

F: --

P: --

Australia Building Permits YoY (SA) (Jun)

A:--

F: --

P: --

AUDUSD
  • AUDUSD
  • XAUUSD
  • XAGUSD
  • WTI
  • USDX
Australia Private Building Permits MoM (SA) (Jun)

A:--

F: --

P: --

AUDUSD
  • AUDUSD
  • XAUUSD
  • XAGUSD
  • WTI
  • USDX
Japan Household Consumer Confidence Index (Jul)

A:--

F: --

P: --

USDJPY
  • USDJPY
  • XAUUSD
  • XAGUSD
  • WTI
  • USDX
France GDP Prelim YoY (SA) (Q2)

A:--

F: --

P: --

Turkey Economic Sentiment Indicator (Jul)

A:--

F: --

P: --

XAUUSD
  • XAUUSD
  • XAGUSD
  • WTI
  • USDX
Germany GDP Prelim YoY (Working-day Adjusted) (Q2)

A:--

F: --

P: --

EURUSD
  • EURUSD
  • XAUUSD
  • XAGUSD
  • WTI
  • USDX
Italy GDP Prelim YoY (SA) (Q2)

A:--

F: --

P: --

EURUSD
  • EURUSD
  • XAUUSD
  • XAGUSD
  • WTI
  • USDX
Germany GDP Prelim YoY (Not SA) (Q2)

A:--

F: --

P: --

EURUSD
  • EURUSD
  • XAUUSD
  • XAGUSD
  • WTI
  • USDX
Germany GDP Prelim QoQ (SA) (Q2)

A:--

F: --

P: --

EURUSD
  • EURUSD
  • XAUUSD
  • XAGUSD
  • WTI
  • USDX
Euro Zone GDP Prelim QoQ (SA) (Q2)

A:--

F: --

P: --
EURUSD
  • EURUSD
  • XAUUSD
  • XAGUSD
  • WTI
  • USDX
Euro Zone Consumer Confidence Index Final (Jul)

A:--

F: --

P: --

EURUSD
  • EURUSD
  • XAUUSD
  • XAGUSD
  • WTI
  • USDX
Euro Zone GDP Prelim YoY (SA) (Q2)

A:--

F: --

P: --

EURUSD
  • EURUSD
  • XAUUSD
  • XAGUSD
  • WTI
  • USDX
Euro Zone Services Sentiment Index (Jul)

A:--

F: --

P: --
EURUSD
  • EURUSD
  • XAUUSD
  • XAGUSD
  • WTI
  • USDX
Euro Zone Economic Sentiment Indicator (Jul)

A:--

F: --

P: --
EURUSD
  • EURUSD
  • XAUUSD
  • XAGUSD
  • WTI
  • USDX
Italy Quarterly Unemployment Rate (SA) (Jun)

A:--

F: --

P: --
EURUSD
  • EURUSD
  • XAUUSD
  • XAGUSD
  • WTI
  • USDX
Euro Zone Industrial Climate Index (Jul)

A:--

F: --

P: --
EURUSD
  • EURUSD
  • XAUUSD
  • XAGUSD
  • WTI
  • USDX
Euro Zone Unemployment Rate (Jun)

A:--

F: --

P: --
EURUSD
  • EURUSD
  • XAUUSD
  • XAGUSD
  • WTI
  • USDX
Italy Unemployment Rate (SA) (Jun)

A:--

F: --

P: --

EURUSD
  • EURUSD
  • XAUUSD
  • XAGUSD
  • WTI
  • USDX
Euro Zone Selling Price Expectations (Jul)

A:--

F: --

P: --

EURUSD
  • EURUSD
  • XAUUSD
  • XAGUSD
  • WTI
  • USDX
Euro Zone Consumer Inflation Expectations (Jul)

A:--

F: --

P: --

EURUSD
  • EURUSD
  • XAUUSD
  • XAGUSD
  • WTI
  • USDX
South Africa PPI YoY (Jun)

A:--

F: --

P: --

XAUUSD
  • XAUUSD
  • XAGUSD
  • WTI
  • USDX
Italy 10-Year BTP Bond Auction Avg. Yield

--

F: --

P: --

Italy 5-Year BTP Bond Auction Avg. Yield

--

F: --

P: --

Italy PPI YoY (Jun)

A:--

F: --

P: --

EURUSD
  • EURUSD
  • XAUUSD
  • XAGUSD
  • WTI
  • USDX
U.K. BOE MPC Vote Cut

--

F: --

P: --

U.K. BOE MPC Vote Hike

--

F: --

P: --

U.K. BOE MPC Vote Unchanged

--

F: --

P: --

U.K. Benchmark Interest Rate

--

F: --

P: --

MPC Rate Statement
Bank of England Governor Bailey held a press conference on monetary policy.
Germany GDP Final QoQ (SA) (Jul)

--

F: --

P: --

Germany HICP Prelim MoM (Jul)

--

F: --

P: --

Germany CPI Final MoM (Jul)

--

F: --

P: --

Germany HICP Prelim YoY (Jul)

--

F: --

P: --

Brazil Unemployment Rate (Jun)

--

F: --

P: --

U.S. Personal Outlays MoM (SA) (Jun)

--

F: --

P: --

U.S. Core PCE Price Index MoM (Jun)

--

F: --

P: --

U.S. PCE Price Index Prelim QoQ (SA) (Q2)

--

F: --

P: --

U.S. Real Personal Consumption Expenditures Prelim QoQ (Q2)

--

F: --

P: --

U.S. PCE Price Index YoY (SA) (Jun)

--

F: --

P: --

U.S. GDP Deflator Prelim QoQ (SA) (Q2)

--

F: --

P: --

U.S. Personal Income MoM (Jun)

--

F: --

P: --

U.S. PCE Price Index MoM (Jun)

--

F: --

P: --

U.S. Real Personal Consumption Expenditures MoM (Jun)

--

F: --

P: --

U.S. Initial Jobless Claims 4-Week Avg. (SA)

--

F: --

P: --

U.S. Weekly Continued Jobless Claims (SA)

--

F: --

P: --

U.S. Core PCE Price Index YoY (Jun)

--

F: --

P: --

U.S. Core PCE Price Index Annualized QoQ Prelim (SA) (Q2)

--

F: --

P: --

U.S. Weekly Initial Jobless Claims (SA)

--

F: --

P: --

U.S. Real GDP Annualized QoQ Prelim (SA) (Q2)

--

F: --

P: --

U.S. Dallas Fed PCE Price Index YoY (Jun)

--

F: --

P: --

U.S. EIA Weekly Natural Gas Stocks Change

--

F: --

P: --

Q&A with Experts
    • All
    • Chatrooms
    • Groups
    • Friends
    john flag
    EuroTrader flag
    Matthew
    thought we were bullish @EuroTrader
    @Matthewthe shorts is not to discount the fact that we are still bullish but its to take advantage of market oportunity
    Size flag
    Size flag
    Size
    @ZIDDYFXMy view on it mate...
    Matthew flag
    EuroTrader
    @Matthewthe shorts is not to discount the fact that we are still bullish but its to take advantage of market oportunity
    @EuroTraderoksy i understand better now
    EuroTrader flag
    Matthew
    @EuroTraderoksy i understand better now
    @Matthewthe fact that the market are trading higher dosent mean that we cant look for shorts in the opoosite direction
    Size flag
    ZIDDYFX
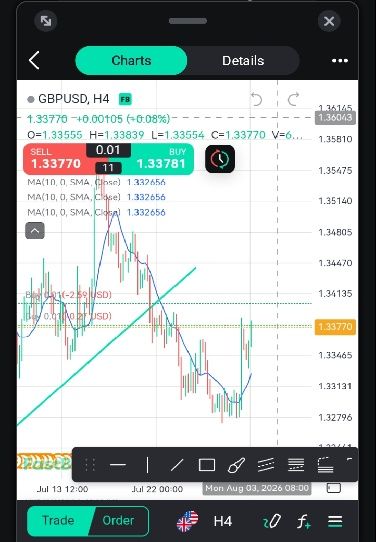
    Great traders, what are your thoughts on the current trends on gbpusd
    @ZIDDYFXI'm actually bullish on GBP/USD.. I shared my chart earlier mate..
    Matthew flag
    EuroTrader
    @Matthewthe fact that the market are trading higher dosent mean that we cant look for shorts in the opoosite direction
    @EuroTradercounyter trend
    Matthew flag
    EuroTrader
    @Matthewthe fact that the market are trading higher dosent mean that we cant look for shorts in the opoosite direction
    @EuroTraderi am following your leading hahahah
    Size flag
    It will be interesting to see whether buyers can build enough momentum for a sustained move higher. What's your bias?@ZIDDYFX
    Size flag
    EuroTrader flag
    Matthew
    @EuroTraderi am following your leading hahahah
    @Matthewlollsss hope you would not attack me if i take a loss and you take a loss also hahaha
    Size flag
    Size
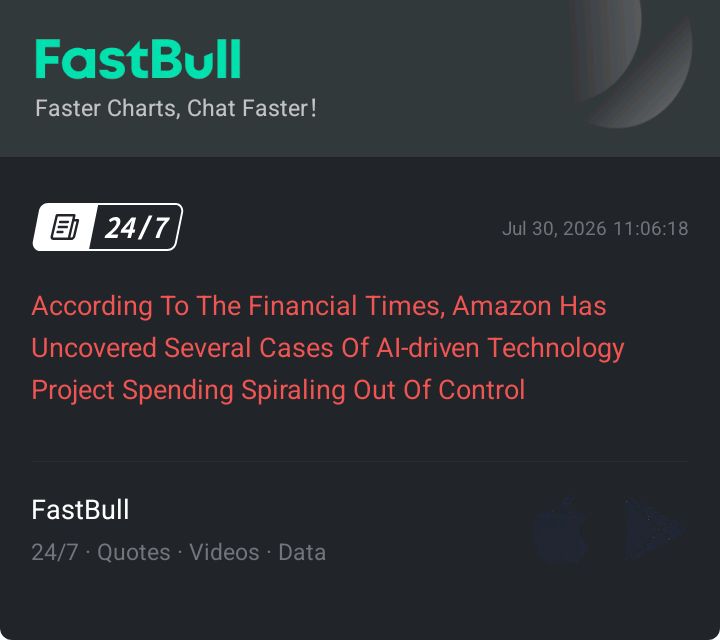
    It'll be interesting to see whether this is an isolated issue at Amazon or a broader challenge facing the AI industry.
    EuroTrader flag
    Matthew
    @EuroTradercounyter trend
    @Matthewyes you can also frame counter trend trades, once your parameters are met you execute
    Size flag
    EuroTrader flag
    Matthew
    @EuroTradercounyter trend
    @Matthewremember you trade based on logic not based on what you thin the markets would do
    Size flag
    Size
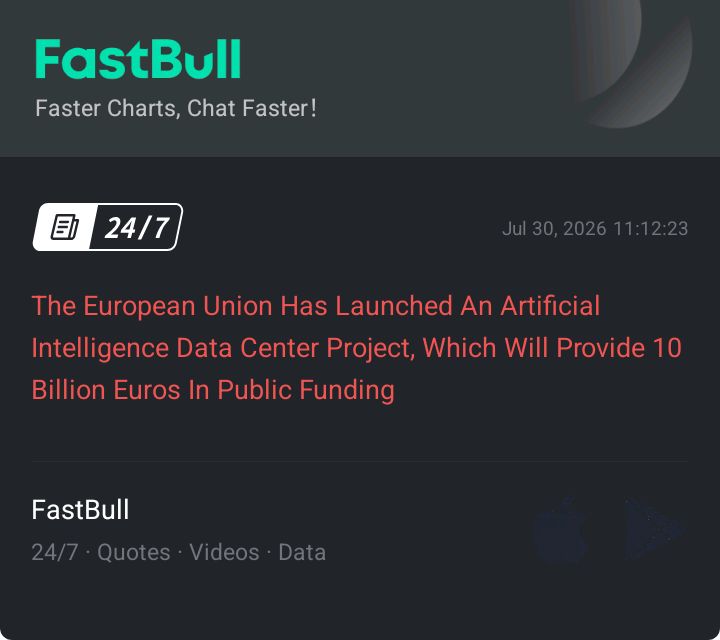
    That's a significant commitment.
    Edward Git flag
    Anyone selling gold now
    Sanjeev Ku flag
    Size
    @Sanjeev KuI'll be watching how price behaves around 4123 first, if that level gives way, 4150 becomes a realistic next target.
    @Size same here bro but once I will exit around 4123 if goes then will see wether to take next trade for 4150 plus else sl is there 4034
    Sanjeev Ku flag
    Sanjeev Ku
    @Size same here bro but once I will exit around 4123 if goes then will see wether to take next trade for 4150 plus else sl is there 4034
    sorry sl 4039
    Type here...
    Add Symbol or Code

      No matching data

      All
      Recommend
      Stocks
      Cryptocurrencies
      Central Banks
      Trump Updates
      Featured News
      • All
      • Russia-Ukraine Conflict
      • Middle East Flashpoint
      • All
      • Russia-Ukraine Conflict
      • Middle East Flashpoint
      Search
      Products

      Charts Free Forever

      Chats Q&A with Experts
      Screeners Economic Calendar Data Tools
      Membership Features
      Data Warehouse Market Trends Institutional Data Policy Rates Macro

      Market Trends

      Market Sentiment Order Book Forex Correlations

      Top Indicators

      Charts Free Forever
      Markets

      News

      24/7 Analysis Education

      Latest Views

      Latest Update

      Signals

      Copy Rankings Latest Signals Become a signal provider AI Rating
      Contests
      Brokers

      Overview Brokers Assessment Rankings Regulators News Claims
      Broker listing Forex Brokers Comparison Tool Live Spread Comparison Scam
      Q&A Complaint Scam Alert Videos Tips to Detect Scam
      More

      Business
      Events
      Careers About Us Advertising Help Center

      White Label

      Broker API

      Data API

      Web Plug-ins

      Affiliate Program

      Awards Institution Evaluation IB Seminar Salon Event Exhibition
      Vietnam Thailand Singapore Dubai
      Fans Party Investment Sharing Session
      FastBull Summit BrokersView Expo
      Recent Searches
        Top Searches
          Markets
          Analysis
          User
          24/7
          Economic Calendar
          Education
          Data
          • Names
          • Latest
          • Prev

          View All

          No data

          Scan to Download

          Faster Charts, Chat Faster!

          Download
          English
          • English
          • Español
          • العربية
          • Bahasa Indonesia
          • Bahasa Melayu
          • Tiếng Việt
          • ภาษาไทย
          • Français
          • Italiano
          • Türkçe
          • Русский язык
          • 简中
          • 繁中
          Open Account
          Search
          Products
          Charts Free Forever
          Markets
          News
          Signals

          Copy Rankings Latest Signals Become a signal provider AI Rating
          Contests
          Brokers

          Overview Brokers Assessment Rankings Regulators News Claims
          Broker listing Forex Brokers Comparison Tool Live Spread Comparison Scam
          Q&A Complaint Scam Alert Videos Tips to Detect Scam
          More

          Business
          Events
          Careers About Us Advertising Help Center

          White Label

          Broker API

          Data API

          Web Plug-ins

          Affiliate Program

          Awards Institution Evaluation IB Seminar Salon Event Exhibition
          Vietnam Thailand Singapore Dubai
          Fans Party Investment Sharing Session
          FastBull Summit BrokersView Expo

          Opthea Stock Price (OPT): Live Chart & 2026 Forecast

          FastBull
          Summary:

          Once a clinical powerhouse, a 98% collapse decimated the Opthea stock price. Inside the high-stakes pivot to salvage the shattered biotech pioneer.

          Tracking the Opthea stock price requires navigating one of the most dramatic corporate transformations in the recent biotechnology sector. Following a devastating late-stage clinical failure, the company has entirely rebranded as Ceryvyn Therapeutics, shedding its historical ophthalmology pipeline to pursue rare lung disease treatments. For investors, understanding this asset now means evaluating the residual value of a distressed micro-cap entity rather than a near-commercial powerhouse. This article examines the catalysts behind the stock's historic collapse, current live valuations under the new CYV ticker, and the financial runway dictating its highly speculative 2026 forecast.

          Opthea Stock Price (OPT): Live Chart & 2026 Forecast

          What Is Ceryvyn's Stock Price Right Now?

          Ceryvyn Therapeutics (ASX: CYV)—the entity formerly known as Opthea Limited—is trading at absolute lows of $0.012 AUD per share as of late July 2026. This prices the company at a micro-cap valuation of roughly $16.4 million AUD. Investors searching for the live Opthea stock price must now track the CYV ticker, as the corporate rebranding and ASX ticker change took effect in July 2026 following a 98% drawdown in equity value.

          Where CYV Is Trading Today Versus Recent Highs and Lows

          Ceryvyn is currently pinned to its 52-week low, trading fractionally above zero after the market entirely repriced the company's clinical pipeline. The historical Opthea stock price commanded a premium valuation prior to early 2025, driven by anticipation surrounding its late-stage eye disease treatments. Today, the asset trades as a distressed turnaround play.

          Market MetricCeryvyn Therapeutics (ASX: CYV)Ceryvyn ADR (OTC: CYVNY)
          Current Price (July 2026)$0.012 AUD$0.03 USD
          Pre-Crash High (Early 2025)~$0.60 AUD$3.17 USD
          Recent Low (Post-Relisting)$0.012 AUD<$0.01 USD
          Trailing Return-98.00%-99.05%

          The collapse in the Opthea stock price wiped out hundreds of millions in market capitalization. The current floor of $0.012 AUD represents the residual value of the company's remaining cash, its underlying intellectual property, and the speculative potential of its new clinical focus. Buying at these lows offers asymmetric upside to any positive clinical developments, but carries the near-certainty of future equity dilution as the company raises capital to fund new trials.

          Why Has CYV Been So Volatile in 2025–2026?

          The violent repricing of Ceryvyn's equity stems directly from the March 2025 clinical failure of its flagship wet AMD treatment, sozinibercept, and the resulting 15-month trading suspension. The timeline of the company's collapse and subsequent restructuring reveals exactly why the stock charts look like a falling knife.

          • The Sozinibercept Failure (March 2025): The primary catalyst for the 98% stock plunge was the Phase 3 trial failure of OPT-302 (sozinibercept). The VEGF-C/D trap inhibitor failed to demonstrate a statistically significant improvement over a placebo for patients with wet age-related macular degeneration (Wet AMD). The market instantly erased the premium associated with a late-stage, commercial-ready asset.
          • Trading Suspension and Cash Preservation (2025–2026): Following the trial results, the stock was suspended from trading on the ASX from March 19, 2025, until June 2026. During this dark period, management executed a drastic restructuring, terminating 80% of the workforce and half the board of directors to preserve remaining capital.
          • The Rebrand and Therapeutic Pivot (July 2026): Recent Opthea stock news has been dominated by the July 3, 2026, shareholder vote to rebrand as Ceryvyn Therapeutics. The company is pivoting away from ophthalmology to focus on lymphangioleiomyomatosis (LAM)—a rare, progressive lung disease. They are repurposing the OPT-302 molecule as a new development program designated CYV-101.

          This pivot salvages the company's existing intellectual property and non-clinical data package, but forces investors to underwrite a completely new, capital-intensive clinical pathway. The volatility will likely persist as the market weighs the long odds of CYV-101's success against the immediate realities of a depleted balance sheet.

          What Drove Ceryvyn's Price to Where It Is Today?

          Beyond the headline clinical miss, a sequence of catastrophic trial failures, late-stage shareholder dilution, and a subsequent retreat from the US stock market forced this dramatic corporate restructuring. The combined impact of these events decimated the company's valuation and triggered a 97% share price collapse when the stock resumed trading in mid-2026.

          How the Sozinibercept Clinical Trial Results Moved the Stock

          The complete failure of sozinibercept (OPT-302) to meet primary endpoints in two pivotal Phase 3 trials wiped out nearly the entirety of the company’s market capitalization in early 2025. Sozinibercept was engineered to inhibit VEGF-C and VEGF-D, and was intended to be administered alongside standard anti-VEGF-A therapies (like aflibercept or ranibizumab) to treat wet age-related macular degeneration (wet AMD).

          Because the core investment thesis rested on capturing a fraction of the multi-billion-dollar wet AMD market, the clinical miss in the COAST and ShORe trials proved fatal to the Opthea stock price. Wet-AMD development was abruptly discontinued, prompting a lengthy trading suspension. When shares finally resumed trading on the ASX on June 3, 2026, the stock plunged 97.17% in a single session to A$0.017. The company has since redirected the underlying VEGF-C/D biology toward lymphangioleiomyomatosis (LAM)—a rare, chronic lung disease—under the new asset name CYV-101.

          What Happened After Ceryvyn's Nasdaq Listing and Capital Raises

          An aggressive capital strategy resulted in extreme shareholder dilution right before the clinical trials failed, ultimately making the company's dual-listing financially unsustainable. Following its initial $128 million Nasdaq debut in 2020, Opthea executed a massive A$227 million (US$150 million) capital raise in mid-2024 via institutional placements and accelerated non-renounceable entitlement offers. This heavily diluted the existing share pool to fund the final stages of the clinical trials.

          When the trials subsequently failed, the expanded share count compounded the downward pressure on the Opthea stock. Facing a decimated market cap and the high administrative costs of remaining on a major US exchange, the company voluntarily delisted its American Depositary Shares (ADSs) from the Nasdaq Global Select Market in November 2025. The equity was relegated to the US over-the-counter (OTC) market, where it now trades under the ticker CYVNY.

          How Analyst Downgrades or Upgrades Have Shifted CYV's Valuation

          Following the trial failures, analyst consensus abruptly shifted from projecting a commercial biotech breakout to valuing the company as a distressed, early-stage restructuring play. Prior to 2025, analysts modeled the Opthea stock price on the probability of FDA approval for sozinibercept, issuing optimistic price targets based on future ophthalmology revenues.

          The clinical failure triggered a wave of brutal downgrades and a complete repricing of the asset. Analysts now assign zero value to the ophthalmology pipeline, shifting their Opthea stock price prediction to reflect the high-risk, early-stage development of CYV-101.

          Valuation MetricPre-2025 (Opthea)Mid-2026 (Ceryvyn Therapeutics)
          Primary CatalystSozinibercept (wet AMD)CYV-101 (LAM disease)
          2027 Earnings ConsensusUS$1.26 million profitUS$80.6 million loss
          Analyst RatingsSpeculative Buy / OutperformSell / Underperform (e.g., Bell Potter)
          Trading VenueASX & Nasdaq (OPT)ASX (CYV) & US OTC (CYVNY)

          Current Opthea stock news reflects this harsh reality. Major institutions like Bell Potter issued consecutive "Sell" ratings throughout late 2025 and 2026, driven by the company's reduced cash runway and the 18-month stage-gated preclinical and clinical timeline required for the new LAM indication.

          Is Ceryvyn Stock Expected to Go Up or Down in 2026?

          Looking ahead, CYV stock volatility will remain extreme throughout 2026 as the market digests this transition to a repurposed micro-cap targeting rare lung diseases. The former Opthea stock price collapsed to roughly A$0.013 following the 2025 Phase III clinical failures, turning CYV into a highly speculative binary play dependent entirely on its new clinical direction.

          What Analyst Price Targets Say About CYV's Upside

          Institutional analyst coverage fundamentally broke down when sozinibercept failed its pivotal wet AMD trials, rendering previous Opthea stock price prediction models obsolete. Major funds, including Regal, slashed the biotechnology firm's valuation by two-thirds or more, driving the market capitalization down to approximately A$16.4 million by mid-July 2026. Current price targets are no longer based on discounted cash flows of a near-commercial blockbuster; they reflect the liquidation value of its remaining A$31.2 million cash balance against ongoing liabilities and the unproven probability of success for its repurposed pipeline. Upside targets are mathematically high in percentage terms due to the sub-two-cent share price, but traditional institutional price targets will likely remain absent until new clinical data validates the company's pivot.

          Which Upcoming Catalysts Could Push the Stock Higher or Lower

          The stock's trajectory in late 2026 depends on executing its strategic restart rather than late-stage clinical readouts. Specific catalysts include:

          • Scientific Advisory Board (SAB) Directives: Updates from the newly formed SAB, co-chaired by pulmonary specialists Prof. Deborah Yates and Prof. Frank McCormack, will dictate the exact clinical pathway and trial design for targeting pathological lymphangiogenesis.
          • CYV-101 Preclinical and Dosing Milestones: Any data demonstrating that the legacy VEGF-C/D inhibitor successfully translates to in vivo efficacy for Lymphangioleiomyomatosis (LAM) will trigger sharp upward volatility.
          • Cash Burn Rate Announcements: The company reported an estimated 18-month cash runway in mid-2026. Quarterly filings showing higher-than-expected burn rates to fund third-party clinical providers will heavily pressure the stock lower.
          • Opthea Stock News Residue: Retail investors unaware of the July 9, 2026 ticker change (from OPT to CYV) periodically create low-volume trading spikes as they react to outdated Opthea stock price feeds.

          What the Pipeline Timeline Means for CYV's Price in the Second Half of 2026

          The timeline reset means investors holding out for a rapid return to historical valuation levels will be disappointed. The company has shifted from expecting imminent commercialization to essentially starting over in a completely different therapeutic area.

          Development EraLead Asset NameTarget IndicationCurrent Clinical Status
          Opthea (Pre-2026)Sozinibercept (OPT-302)Wet AMD & Diabetic Macular EdemaPhase III (Failed 2025); Abandoned
          Ceryvyn (H2 2026+)CYV-101Lymphangioleiomyomatosis (LAM)Early Clinical Repurposing

          Because the H2 2026 timeline is dedicated strictly to early-stage trial design, outsourced manufacturing setup, and preclinical bridging studies for CYV-101, there are no immediate Phase III readouts to force a major re-rating. The asset relies on the exact same biological mechanism—blocking VEGF-C and VEGF-D—but applying it to LAM fundamentally alters the risk profile. Investors buying at current levels are trading on cash runway survival and the long-term novelty of treating a rare, progressive lung disease in women, rather than expecting a near-term revenue breakthrough.

          Should You Buy, Hold, or Avoid CYV Right Now?

          The decision to buy, hold, or avoid the stock hinges entirely on whether you view Ceryvyn as a deeply discounted biological asset or broken equity. With the historical Opthea stock price wiped out and the company no longer pursuing ophthalmology, investors must weigh the merits of its new rare disease focus against severe financial constraints.

          • Buy if: You believe the repurposed biology of CYV-101 (a fusion protein targeting VEGF-C and VEGF-D) is fundamentally sound for treating LAM, and you are willing to hold through the extreme volatility typical of penny-status biotech turnarounds.
          • Hold if: You are a trapped shareholder holding legacy Opthea stock hoping the current micro-valuation (roughly A$13.36 million market cap as of mid-2026) offers asymmetric upside as the newly branded company stabilizes and initiates LAM trials.
          • Avoid if: You require near-term commercial revenue, insist on a clean capitalization table, or are unwilling to accept the near-certainty of future equity dilution to fund upcoming clinical phases.

          What the Financials Tell You About Ceryvyn's Burn Rate and Runway

          Ceryvyn’s current financial structure reflects a drastic post-failure restructuring, shifting from a cash-incinerating late-stage developer to a tightly budgeted pipeline reset. Prior to the failure of sozinibercept, the company burned roughly US$40–45 million per quarter running massive global trials. Today, the fiscal reality is entirely different:

          • Headcount Reduction: A 65% staff reduction executed in April 2025 immediately compressed administrative and clinical overhead.
          • Operating Budget: The company is currently operating on an approximate A$13.1 million budget, strictly allocated to advancing CYV-101 in LAM rather than broad platform development.
          • Capital Runway: As of mid-2026, Ceryvyn projects roughly an 18-month cash runway, theoretically funding operations into late 2027 before a mandatory capital raise.
          • Legacy Obligations: Active negotiations regarding the legacy Development Funding Agreement (DFA) investors remain a structural overhang that complicates the company's enterprise value.

          Investors checking the latest Opthea stock news expecting a return to massive institutional funding rounds will instead find a distressed biotech strictly rationing capital to reach early, cost-effective LAM data milestones.

          How Much Risk Does CYV Carry Compared to Other Biotech Stocks

          CYV carries severe, specialized risk even relative to the inherently volatile biotechnology sector, acting more like a distressed turnaround than a traditional clinical-stage asset. While a standard early-stage biotech builds valuation on unproven science, Ceryvyn is actively shedding the market penalty of a high-profile, late-stage failure using the exact same underlying mechanism of action.

          Risk VectorCeryvyn (CYV)Standard Clinical BiotechCommercial Biotech
          Pipeline DependencyExtreme (Single viable asset: CYV-101 for LAM)High (Multiple pre-clinical/Phase 1 assets)Low (Approved cash-generating products)
          Funding OverhangHigh (Legacy DFA obligations complicate the cap table)Moderate (Standard equity dilution cycles)Low (Self-funded through product sales)
          Biological ValidationMixed (Pathway failed in wet AMD; unproven in LAM)Speculative (Mechanism entirely unproven in humans)Proven (Efficacy established by regulators)
          Market PerceptionDistressed (Rebuilding trust post-Opthea collapse)Neutral (Valued on future milestones)Stable (Valued on earnings and P/E ratios)

          Anyone making an Opthea stock price prediction for the remainder of 2026 must factor in that Ceryvyn is effectively a brand-new, early-stage enterprise trading inside the battered shell of a former late-stage developer. The investment thesis rests entirely on binary execution: proving that neutralizing VEGF-C and VEGF-D is the definitive key to arresting LAM disease progression, and surviving long enough financially to prove it.

          FAQs about opthea stock price

          What is happening with Opthea?

          In July 2026, Opthea shareholders approved a company name change to Ceryvyn Therapeutics Limited, trading under the new ASX code CYV. This followed a major corporate restructuring in 2025, during which the company discontinued its lead treatment for wet AMD after failed clinical trials and significantly reduced its workforce. The company is now focusing its resources on developing CYV 101, a therapeutic candidate targeting lymphangioleiomyomatosis (LAM), a rare progressive lung disease.

          Is Opthea stock a buy?

          Analyst ratings for Opthea—now operating as Ceryvyn Therapeutics—are mixed, with very limited active coverage following its recent restructuring. Some automated consensus models indicate a speculative "Strong Buy" based on remaining analyst projections, while other historical analyses lean toward "Hold" or "Sell" ratings. Analysts note that the stock remains highly volatile due to its lack of commercial revenue, significant financial losses, and pre-commercial biopharmaceutical status.

          Who are Opthea's main competitors?

          Before discontinuing its wet age-related macular degeneration (AMD) program in 2025, Opthea competed with large pharmaceutical companies like Regeneron, Novartis, Roche, and Bayer. It also faced competition from emerging biotech firms developing novel ophthalmic therapies, such as Kodiak Sciences, REGENXBIO, and Outlook Therapeutics. Following its strategic pivot to treating the rare lung disease LAM, its competitive landscape is now shifting toward other biopharmaceutical companies operating in that specialized therapeutic space.

          What is the share price of Opthea Limited?

          As of late July 2026, shares of the company (now trading as Ceryvyn Therapeutics under the ticker CYV) were priced at approximately A$0.012 on the Australian Securities Exchange (ASX). The stock experienced a decline of roughly 98% over the preceding year following the failure of its legacy clinical trials. Its U.S. listings have similarly plummeted, with its American Depositary Receipts trading at just a few cents per share.

          Conclusion

          The complete repricing of the Opthea stock price into the Ceryvyn Therapeutics micro-cap serves as a stark reminder of the binary risks inherent to late-stage biotechnology development. For prospective investors, the newly minted CYV ticker represents an entirely reset investment thesis centered on the speculative repurposing of VEGF-C/D biology for rare lung diseases. Navigating this asset requires carefully monitoring the company's cash burn rate, upcoming preclinical milestones for CYV-101, and its ability to secure vital clinical funding before its current operating runway expires.

          Risk Warnings and Disclaimers
          You understand and acknowledge that there is a high degree of risk involved in trading. Following any strategies or investment methods may lead to potential losses. The content on the site is provided by our contributors and analysts for information purposes only. You are solely responsible for determining whether any trading assets, securities, strategy, or any other product is suitable for investing based on your own investment objectives and financial situation.
          Add to Favorites
          Share
          FastBull
          Copyright © 2026 FastBull Ltd

          728 RM B 7/F GEE LOK IND BLDG NO 34 HUNG TO RD KWUN TONG KLN HONG KONG

          TelegramInstagramTwitterfacebooklinkedin
          App Store Google Play Android Windows
          Products
          Charts

          Chats

          Q&A with Experts
          Screeners
          Economic Calendar
          Data
          Tools
          Membership
          Features
          Function
          Markets
          Copy Trading
          Latest Signals
          Contests
          24/7
          Analysis
          Education
          Company
          Careers
          About Us
          Contact Us
          Advertising
          Download FastBull
          Help Center
          Feedback
          User Agreement
          Privacy Policy
          Personal Information Protection Statement
          Business

          White Label

          Broker API

          Data API

          Web Plug-ins

          Poster Maker

          Affiliate Program

          Risk Disclosure

          The risk of loss in trading financial instruments such as stocks, FX, commodities, futures, bonds, ETFs and crypto can be substantial. You may sustain a total loss of the funds that you deposit with your broker. Therefore, you should carefully consider whether such trading is suitable for you in light of your circumstances and financial resources.

          No decision to invest should be made without thoroughly conducting due diligence by yourself or consulting with your financial advisors. Our web content might not suit you since we don't know your financial conditions and investment needs. Our financial information might have latency or contain inaccuracy, so you should be fully responsible for any of your trading and investment decisions. The company will not be responsible for your capital loss.

          Without getting permission from the website, you are not allowed to copy the website's graphics, texts, or trademarks. Intellectual property rights in the content or data incorporated into this website belong to its providers and exchange merchants.

          Not Logged In

          Log in to access more features

          Connect Broker
          Become a signal provider
          Help Center
          Customer Service
          Dark Mode
          Price Up/Down Colors

          Log In

          Sign Up

          Position
          Layout
          Fullscreen
          Default to Chart
          The chart page opens by default when you visit fastbull.com