• Trade
  • Markets
  • Copy
  • Contests
  • 24/7
  • Calendar
  • Q&A
  • Chats
Screeners
SYMBOL
LAST
BID
ASK
HIGH
LOW
NET CHG.
%CHG.
SPREAD
SOURCE
SPX
S&P 500 Index
7580.07
7580.07
7580.07
7637.48
7527.56
-140.32
-1.82%
--
--
DJI
Dow Jones Industrial Average
51770.31
51770.31
51770.31
52383.90
51563.76
-572.25
-1.09%
--
--
IXIC
NASDAQ Composite Index
25436.99
25436.99
25436.99
25673.00
25177.33
-747.73
-2.86%
--
--
USDX
US Dollar Index
101.807
101.807
101.887
101.913
101.400
+0.104
+ 0.10%
--
--
EURUSD
Euro / US Dollar
1.11561
1.11561
1.11616
1.12144
1.11353
-0.00230
-0.21%
--
--
GBPUSD
Pound Sterling / US Dollar
1.33860
1.33860
1.33926
1.34334
1.33702
+0.00095
+ 0.07%
--
--
XAUUSD
Gold / US Dollar
3875.25
3875.25
3875.25
4026.26
3869.98
-145.70
-3.62%
--
--
WTI
Light Sweet Crude Oil
102.072
102.072
102.102
104.014
101.471
+0.099
+ 0.10%
--
--

Community Accounts

Signal Accounts
--
Profit Accounts
--
Loss Accounts
--
View More

Become a signal provider

Sell trading signals to earn additional income

View More

Guide to Copy Trading

Get started with ease and confidence

View More

Signal Accounts for Members

All Signal Accounts

Best Return
  • Best Return
  • Best P/L
  • Best MDD
Past 1W
  • Past 1W
  • Past 1M
  • Past 1Y

All Contests

  • All
  • Recommend
  • Stocks
  • Cryptocurrencies
  • Central Banks
  • Trump Updates
  • Featured News
Top News Only
Share

Trump's Proposed Asylum For Bolsonaro Has Escalated Tensions Between The US And Brazil, Prompting Rubio And The Brazilian Foreign Minister To Agree To Meet Again

Share

Lavrov: Putin Is Willing To Meet With Zelensky, Provided That The Latter Travels To Moscow

Share

Japan, The United States, And South Korea Signed A Memorandum Of Understanding On Arctic And Pacific Cooperation, And Will Establish A Working Group To Promote Maritime And Economic Cooperation

Share

The Mayor Of Kyiv: The City's Water Supply Has Been Disrupted Following The Russian Airstrikes

Share

China's National Bureau Of Statistics: The PMI For High-tech Manufacturing And Equipment Manufacturing In October Were 51.3% And 50.6%, Respectively

Share

Brent Crude Oil Fell Below $113 In Grey Market Trading, Down More Than 0.7% On The Day

Share

China's National Bureau Of Statistics: The Non-manufacturing Business Activity Index Was 49.7% In October

Share

US Natural Gas Futures Fell Below $2.90 In The Grey Market, Down 0.7% On The Day

Share

China's National Bureau Of Statistics Reported That The Manufacturing Purchasing Managers' Index (PMI) Was 49.3% In October, Down 0.8 Percentage Points From The Previous Month, Indicating A Slight Decline In Manufacturing Activity. By Enterprise Size, The PMI For Large Enterprises Was 50.2%, Down 0.4 Percentage Points From The Previous Month, But Still Above The Critical Point; The PMIs For Medium-sized And Small Enterprises Were 48.4% And 47.5% Respectively, Down 1.3 And 1.4 Percentage Points From The Previous Month, And Below The Critical Point

Share

China's National Bureau Of Statistics: The Manufacturing Purchasing Managers' Index (PMI) Was 49.3% In October

Share

The Polish Prime Minister Is Accused Of Staging A Coup Against The Constitutional Court

Share

Russian Foreign Minister Sergey Lavrov Stated That Poland's Accession To The G20 Would Not Benefit The Group, And Moscow Believes There Is No Need For The Group To Add Another European Voice

Share

A U.S. Judge Ruled That The Justice Department Is Prohibited From Threatening Election Workers

Share

The Trump Administration Plans To Repatriate Some Afghan Migrants To Afghanistan

Share

Trump: Fannie Mae And Freddie Mac Will Invest $40 Billion In Florida Mortgage Lending

Share

Trump: We Have Built The Most Secure Border In American History. In The Past 17 Months, Not A Single Illegal Immigrant Has Been Allowed To Enter The United States. We Have Achieved The Largest Decline In Violent Crime On Record, And The Murder Rate Has Fallen To Its Lowest Level Since 1900, Or In 125 Years

Share

Trump: Provide $40 Million In Federal Funding For The Apprenticeship Program

Share

In Florida, Trump Announced That Johnson & Johnson Will Invest $1 Billion To Build A Large Distribution Center In Jacksonville. Blue Origin Will Invest $600 Million To Expand Its Rocket Campus At Cape Canaveral Space Port. Williams International Will Invest Another $1 Billion To Produce Aircraft Engines In Ocala County, Florida

Share

The CEO Of Alaska Airlines Group Stated That Fuel Prices And Geopolitical Challenges Have Placed Significant Financial Pressure On The Business

Share

Alaska Airlines Will Lay Off Approximately 200 Non-contract Workers; The Layoffs Will Not Affect Frontline Non-management Positions

TIME
ACT
FCST
PREV
IMPACT
Turkey Economic Sentiment Indicator (Oct)

A:--

F: --

P: --

XAUUSD
  • XAUUSD
  • XAGUSD
  • WTI
  • USDX
U.K. Nationwide House Price Index MoM (Oct)

A:--

F: --

P: --
GBPUSD
  • GBPUSD
  • XAUUSD
  • XAGUSD
  • WTI
  • USDX
U.K. Nationwide House Price Index YoY (Oct)

A:--

F: --

P: --

GBPUSD
  • GBPUSD
  • XAUUSD
  • XAGUSD
  • WTI
  • USDX
France PPI MoM (Sept)

A:--

F: --

P: --

EURUSD
  • EURUSD
  • XAUUSD
  • XAGUSD
  • WTI
  • USDX
Germany Unemployment Rate (SA) (Oct)

A:--

F: --

P: --

EURUSD
  • EURUSD
  • XAUUSD
  • XAGUSD
  • WTI
  • USDX
Germany GDP Prelim YoY (Working-day Adjusted) (Q3)

A:--

F: --

P: --

EURUSD
  • EURUSD
  • XAUUSD
  • XAGUSD
  • WTI
  • USDX
Germany GDP Prelim YoY (Not SA) (Q3)

A:--

F: --

P: --

EURUSD
  • EURUSD
  • XAUUSD
  • XAGUSD
  • WTI
  • USDX
Germany GDP Prelim QoQ (SA) (Q3)

A:--

F: --

P: --

EURUSD
  • EURUSD
  • XAUUSD
  • XAGUSD
  • WTI
  • USDX
Italy GDP Prelim YoY (SA) (Q3)

A:--

F: --

P: --

EURUSD
  • EURUSD
  • XAUUSD
  • XAGUSD
  • WTI
  • USDX
Euro Zone GDP Prelim QoQ (SA) (Q3)

A:--

F: --

P: --

EURUSD
  • EURUSD
  • XAUUSD
  • XAGUSD
  • WTI
  • USDX
Italy HICP Prelim YoY (Oct)

A:--

F: --

P: --

EURUSD
  • EURUSD
  • XAUUSD
  • XAGUSD
  • WTI
  • USDX
Euro Zone Unemployment Rate (Sept)

A:--

F: --

P: --
EURUSD
  • EURUSD
  • XAUUSD
  • XAGUSD
  • WTI
  • USDX
Euro Zone GDP Prelim YoY (SA) (Q3)

A:--

F: --

P: --

EURUSD
  • EURUSD
  • XAUUSD
  • XAGUSD
  • WTI
  • USDX
Italy Average Hourly Wage MoM (Sept)

A:--

F: --

P: --

EURUSD
  • EURUSD
  • XAUUSD
  • XAGUSD
  • WTI
  • USDX
Brazil Unemployment Rate (Sept)

A:--

F: --

P: --

XAUUSD
  • XAUUSD
  • XAGUSD
  • WTI
  • USDX
South Africa Trade Balance (Sept)

A:--

F: --

P: --

XAUUSD
  • XAUUSD
  • XAGUSD
  • WTI
  • USDX
U.S. Labor Cost Index QoQ (Q3)

A:--

F: --

P: --

XAUUSD
  • XAUUSD
  • XAGUSD
  • WTI
  • USDX
Canada GDP YoY (Aug)

A:--

F: --

P: --

WTI
  • WTI
  • XAUUSD
  • XAGUSD
  • USDX
Canada GDP MoM (SA) (Aug)

A:--

F: --

P: --

WTI
  • WTI
  • XAUUSD
  • XAGUSD
  • USDX
Germany HICP Prelim MoM (Oct)

A:--

F: --

P: --

EURUSD
  • EURUSD
  • XAUUSD
  • XAGUSD
  • WTI
  • USDX
Germany HICP Prelim YoY (Oct)

A:--

F: --

P: --

EURUSD
  • EURUSD
  • XAUUSD
  • XAGUSD
  • WTI
  • USDX
Germany CPI Final MoM (Oct)

A:--

F: --

P: --

EURUSD
  • EURUSD
  • XAUUSD
  • XAGUSD
  • WTI
  • USDX
Germany GDP Final QoQ (SA) (Oct)

A:--

F: --

P: --

U.S. Chicago PMI (Oct)

A:--

F: --

P: --

USDX
  • USDX
  • XAUUSD
  • XAGUSD
  • WTI
Canada Federal Government Budget Balance (Aug)

A:--

F: --

P: --

USDCAD
  • USDCAD
  • XAUUSD
  • XAGUSD
  • WTI
  • USDX
U.S. Weekly Total Rig Count

A:--

F: --

P: --

WTI
  • WTI
  • XAUUSD
  • XAGUSD
  • USDX
U.S. Weekly Total Oil Rig Count

A:--

F: --

P: --

WTI
  • WTI
  • XAUUSD
  • XAGUSD
  • USDX
China, Mainland NBS Non-manufacturing PMI (Oct)

A:--

F: --

P: --

XAUUSD
  • XAUUSD
  • XAGUSD
  • WTI
  • USDX
China, Mainland NBS Manufacturing PMI (Oct)

A:--

F: --

P: --

XAUUSD
  • XAUUSD
  • XAGUSD
  • WTI
  • USDX
China, Mainland Composite PMI (Oct)

A:--

F: --

P: --

XAUUSD
  • XAUUSD
  • XAGUSD
  • WTI
  • USDX
South Korea Trade Balance Prelim (Oct)

--

F: --

P: --
Indonesia IHS Markit Manufacturing PMI (Oct)

--

F: --

P: --

Australia Building Permits YoY (SA) (Sept)

--

F: --

P: --

Australia Building Permits MoM (SA) (Sept)

--

F: --

P: --

Australia Private Building Permits MoM (SA) (Sept)

--

F: --

P: --

Japan Manufacturing PMI Final (Oct)

--

F: --

P: --

South Korea IHS Markit Manufacturing PMI (SA) (Oct)

--

F: --

P: --

China, Mainland Caixin Manufacturing PMI (SA) (Oct)

--

F: --

P: --

Indonesia Inflation Rate YoY (Oct)

--

F: --

P: --

Indonesia Trade Balance (Sept)

--

F: --

P: --

Indonesia Core Inflation YoY (Oct)

--

F: --

P: --

India HSBC Manufacturing PMI Final (Oct)

--

F: --

P: --

Australia Commodity Price YoY (Oct)

--

F: --

P: --

Russia IHS Markit Manufacturing PMI (Oct)

--

F: --

P: --

Germany Actual Retail Sales MoM (Sept)

--

F: --

P: --

Turkey Manufacturing PMI (Oct)

--

F: --

P: --

Italy Manufacturing PMI (SA) (Oct)

--

F: --

P: --

South Africa Manufacturing PMI (Oct)

--

F: --

P: --

Euro Zone Manufacturing PMI Final (Oct)

--

F: --

P: --

U.K. Manufacturing PMI Prelim (Oct)

--

F: --

P: --

Canada National Economic Confidence Index

--

F: --

P: --

Canada Manufacturing PMI (SA) (Oct)

--

F: --

P: --

U.S. IHS Markit Manufacturing PMI Final (Oct)

--

F: --

P: --

U.S. ISM Inventories Index (Oct)

--

F: --

P: --

U.S. Construction Spending MoM (Sept)

--

F: --

P: --

U.S. ISM Output Index (Oct)

--

F: --

P: --

U.S. ISM Manufacturing Employment Index (Oct)

--

F: --

P: --

U.S. ISM Manufacturing PMI (Oct)

--

F: --

P: --

Q&A with Experts
    • All
    • Chatrooms
    • Groups
    • Friends
    Skylark flag
    5948210
    adolesencia
    @Visitor5948210hello visitor 👋 how are you doing today hope you are good welcome
    2460732 flag
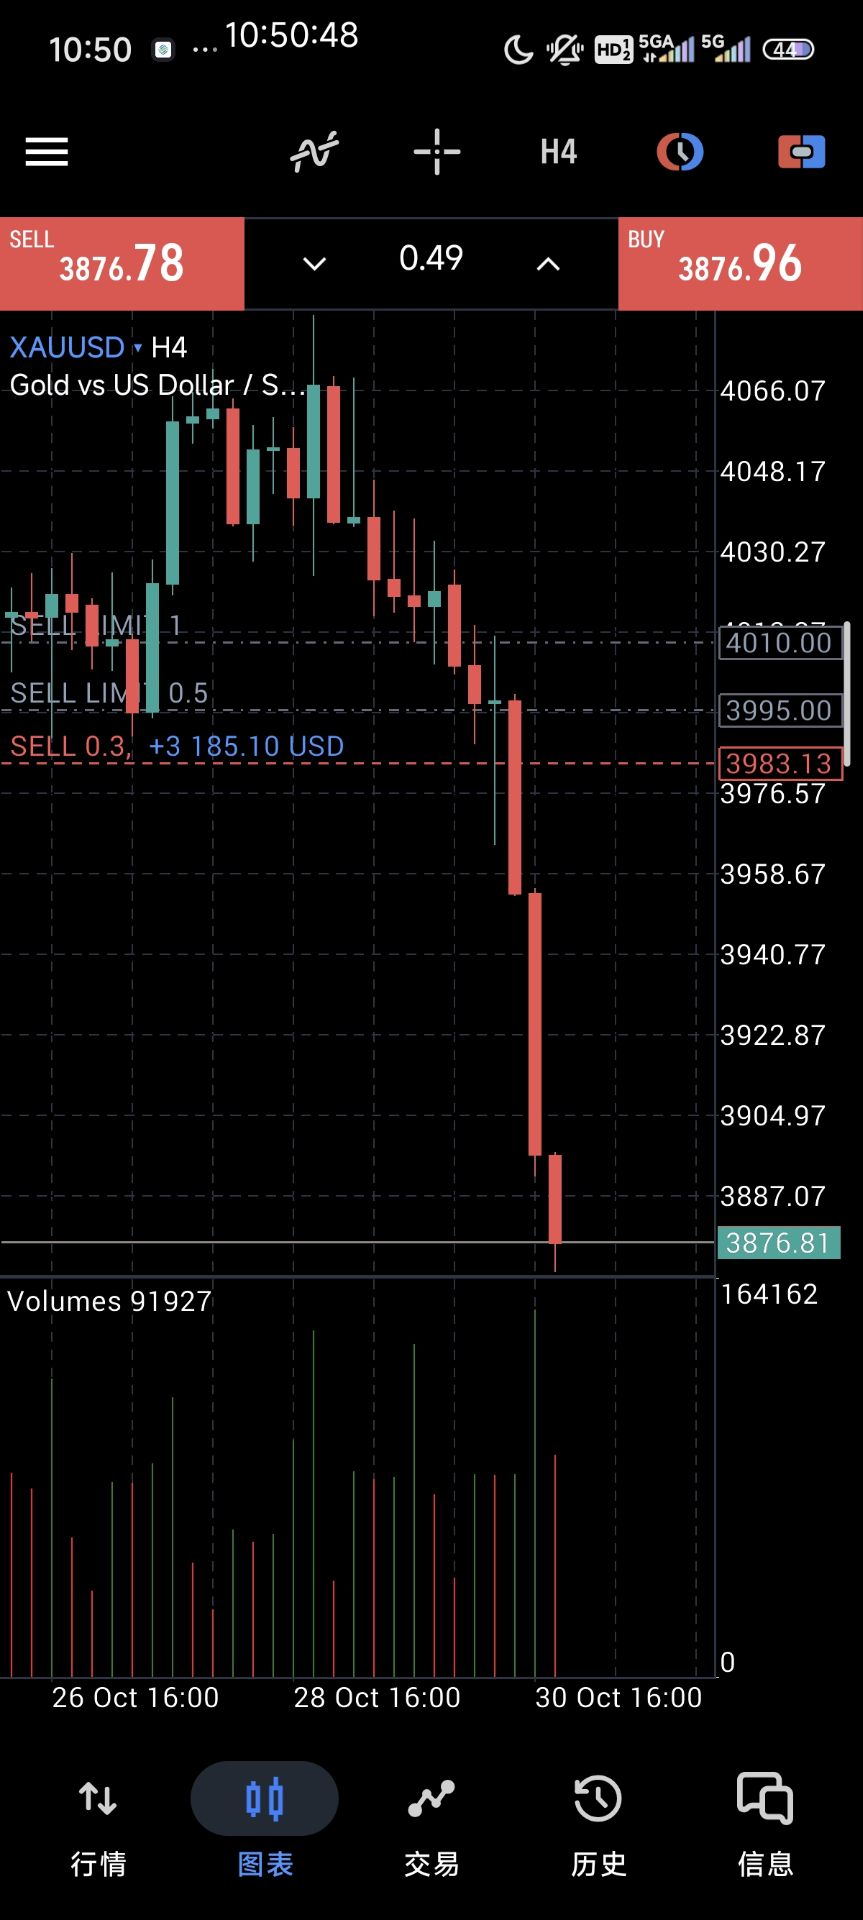
    If any positive news about war comes before Monday market open is there a chance this can go back to 4000 levels, i am on long from 4000 levels and now. My account is 53% one more drop and my account is wiped. I can put some money if any chance of recovery.Any valuable suggestions.?
    Skylark flag
    suvam giri
    @EuroTraderits going to rain here
    @suvam girihello mate how are you doing today hope you are good welcome
    Trade With Jabo flag
    2460732
    If any positive news about war comes before Monday market open is there a chance this can go back to 4000 levels, i am on long from 4000 levels and now. My account is 53% one more drop and my account is wiped. I can put some money if any chance of recovery.Any valuable suggestions.?
    @Visitor2460732yes i shall help u sir
    Trade With Jabo flag
    IF Anyone need any help in trading send me friend reguest i shall help you
    Đinh Kiên flag
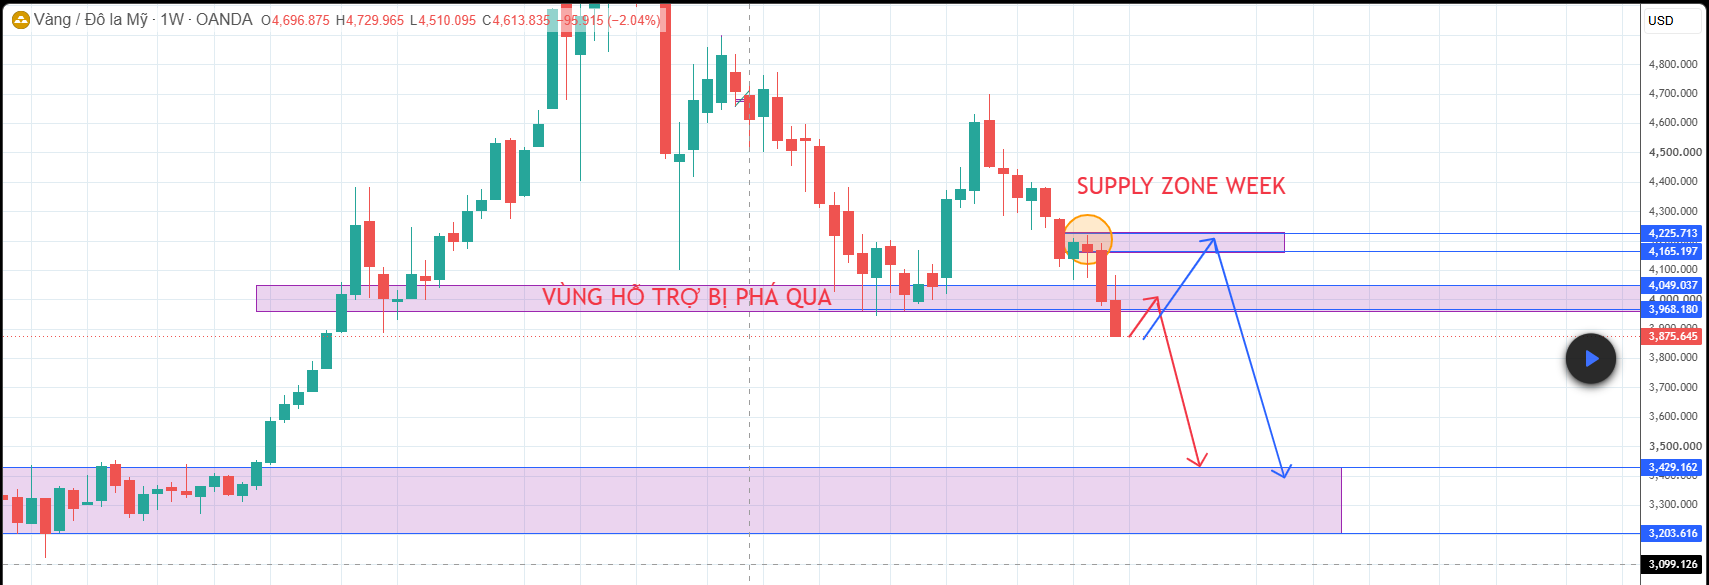
    2. Kịch bản VÀNG trong những tuần tiếp theo - Kịch bản 1 – Tiếp tục giảm trực tiếp: Ngay trong tuần tới, VÀNG có thể tiếp tục chịu áp lực bán và giảm thẳng về các vùng giá thấp hơn, mà không xuất hiện nhịp hồi đáng kể. - Kịch bản 2 – Hồi về vùng kháng cự gần: VÀNG có thể xuất hiện một nhịp hồi lên vùng 3.968 – 4.050. Đây là vùng hỗ trợ cũ đã bị phá vỡ và có khả năng chuyển thành kháng cự. Nếu giá phản ứng tại vùng này, VÀNG có thể tiếp tục quay đầu giảm. - Kịch bản 3 – Hồi sâu về Supply Zone: Trong trường hợp lực hồi mạnh hơn, VÀNG có thể tiếp tục tăng lên SUPPLY ZONE trên khung WEEK, vùng 4.165 – 4.225. Đây là vùng có thể xuất hiện lực bán trở lại. Nếu giá phản ứng và hình thành tín hiệu đảo chiều, xu hướng chính vẫn có thể tiếp tục là giảm. 3. Kết luận - Hiện tại, xu hướng trên khung WEEK vẫn đang nghiêng về phía giảm. Vì vậy, ưu tiên trong vài tuần tới là theo dõi các nhịp hồi lên vùng kháng cự/Supply Zone để tìm tín hiệu tiếp diễn xu hướng giảm, thay vì kỳ vọng VÀNG đảo chiều tăng ngay. - Vùng 3.968 – 4.050 là vùng cần theo dõi trước; nếu giá hồi sâu hơn, chú ý tiếp 4.165 – 4.225. Mục tiêu giảm phía dưới có thể hướng tới 3.200 – 3.400.
    Đinh Kiên flag
    Trade With Jabo flag
    IF Anyone need any help in trading send me friend reguest i shall help you
    Skylark flag
    2460732
    If any positive news about war comes before Monday market open is there a chance this can go back to 4000 levels, i am on long from 4000 levels and now. My account is 53% one more drop and my account is wiped. I can put some money if any chance of recovery.Any valuable suggestions.?
    Bro, I understand the pressure 53% that's heavy. About 4000 again — *nobody can guarantee it before Monday.* Yes, gold is very sensitive to war news. If there's a de-escalation / ceasefire headline over the weekend, we can see a sharp gap DOWN, not up. Gold pumps on fear. Positive war news (peace) usually dumps Gold. So if you're long from 4000, positive news is actually AGAINST your long. Negative war news / escalation would be what pushes Gold back up towards 4000. @Visitor2460732
    Skylark flag
    2460732
    If any positive news about war comes before Monday market open is there a chance this can go back to 4000 levels, i am on long from 4000 levels and now. My account is 53% one more drop and my account is wiped. I can put some money if any chance of recovery.Any valuable suggestions.?
    @Visitor2460732Don't add money to a losing trade just to avoid a margin call.* That's how accounts get fully wiped. Adding money doesn't change the chart, it just makes the loss bigger if it goes lower. Pros call it throwing good money after bad.
    Skylark flag
    2460732
    If any positive news about war comes before Monday market open is there a chance this can go back to 4000 levels, i am on long from 4000 levels and now. My account is 53% one more drop and my account is wiped. I can put some money if any chance of recovery.Any valuable suggestions.?
    @Visitor2460732What is your plan?* If it opens and drops another 1-2%, you said you're wiped. Is it worth risking more capital you can't afford to lose on hope? What most would do in your spot: - Cut the lot size / close half to save the account from liquidation and live to trade another day - Set a hard stop loss where you accept the loss, don't let broker liquidate you - Don't trade the weekend gap — Monday open can be wild with slippage
    Skylark flag
    2460732
    If any positive news about war comes before Monday market open is there a chance this can go back to 4000 levels, i am on long from 4000 levels and now. My account is 53% one more drop and my account is wiped. I can put some money if any chance of recovery.Any valuable suggestions.?
    Not financial advice — just risk management. If you're stressed, step away from the chart for a bit and talk to someone you trust. What was your original stop loss for this trade? @Visitor2460732
    "Trade With Jabo" recalled a message
    Trade With Jabo flag
    2460732
    If any positive news about war comes before Monday market open is there a chance this can go back to 4000 levels, i am on long from 4000 levels and now. My account is 53% one more drop and my account is wiped. I can put some money if any chance of recovery.Any valuable suggestions.?
    @Visitor2460732@Visitor2460732if u want i will help you sir i shall handle your account i shall change your loss into huge profit only i need your trust big loss recovery soon
    "Trade With Jabo" recalled a message
    5920320 flag
    Skylark
    Not financial advice — just risk management. If you're stressed, step away from the chart for a bit and talk to someone you trust. What was your original stop loss for this trade? @Visitor2460732
    @Skylark I did not have a stop loss for this trade, could not cut my fingers on time now I guess its time when the throat gets cut due to bad risk management. I get always caught in these big swings down, Down 9850.00 in this trade.
    fulltimetrader flag
    fulltimetrader flag
    5920320
    @Skylark I did not have a stop loss for this trade, could not cut my fingers on time now I guess its time when the throat gets cut due to bad risk management. I get always caught in these big swings down, Down 9850.00 in this trade.
    @游客5920320中国资管
    fulltimetrader flag
    fulltimetrader flag
    5920320
    @Skylark I did not have a stop loss for this trade, could not cut my fingers on time now I guess its time when the throat gets cut due to bad risk management. I get always caught in these big swings down, Down 9850.00 in this trade.
    @游客5920320翻译聊天记录,你就知道了
    Type here...
    Add Symbol or Code

      No matching data

      All
      Recommend
      Stocks
      Cryptocurrencies
      Central Banks
      Trump Updates
      Featured News
      • All
      • Russia-Ukraine Conflict
      • Middle East Flashpoint
      • All
      • Russia-Ukraine Conflict
      • Middle East Flashpoint
      Search
      Products

      Charts Free Forever

      Chats Q&A with Experts
      Screeners Economic Calendar Data Tools
      Membership Features
      Data Warehouse Market Trends Institutional Data Policy Rates Macro

      Market Trends

      Market Sentiment Order Book Forex Correlations

      Top Indicators

      Charts Free Forever
      Markets

      News

      24/7 Analysis Education

      Latest Views

      Latest Update

      Signals

      Copy Rankings Latest Signals Become a signal provider AI Rating
      Contests
      Brokers

      Overview Brokers Assessment Rankings Regulators News Claims
      Broker listing Forex Brokers Comparison Tool Live Spread Comparison Scam
      Q&A Complaint Scam Alert Videos Tips to Detect Scam
      More

      Business
      Events
      Careers About Us Advertising Help Center

      White Label

      Broker API

      Data API

      Web Plug-ins

      Affiliate Program

      Awards Institution Evaluation IB Seminar Salon Event Exhibition
      Vietnam Thailand Singapore Dubai
      Fans Party Investment Sharing Session
      FastBull Summit BrokersView Expo
      Recent Searches
        Top Searches
          Markets
          Analysis
          User
          24/7
          Economic Calendar
          Education
          Data
          • Names
          • Latest
          • Prev

          View All

          No data

          Scan to Download

          Faster Charts, Chat Faster!

          Download
          English
          • English
          • Español
          • العربية
          • Bahasa Indonesia
          • Bahasa Melayu
          • Tiếng Việt
          • ภาษาไทย
          • Français
          • Italiano
          • Türkçe
          • Русский язык
          • 简中
          • 繁中
          Open Account
          Search
          Products
          Charts Free Forever
          Markets
          News
          Signals

          Copy Rankings Latest Signals Become a signal provider AI Rating
          Contests
          Brokers

          Overview Brokers Assessment Rankings Regulators News Claims
          Broker listing Forex Brokers Comparison Tool Live Spread Comparison Scam
          Q&A Complaint Scam Alert Videos Tips to Detect Scam
          More

          Business
          Events
          Careers About Us Advertising Help Center

          White Label

          Broker API

          Data API

          Web Plug-ins

          Affiliate Program

          Awards Institution Evaluation IB Seminar Salon Event Exhibition
          Vietnam Thailand Singapore Dubai
          Fans Party Investment Sharing Session
          FastBull Summit BrokersView Expo

          NVDA Stock Prediction 2026–2030: How High Can Nvidia Go?

          zhan chen
          Summary:

          Explore the NVDA stock prediction for 2026–2030, including Nvidia's growth outlook, AI chip demand, price forecasts, key catalysts, and investment risks.

          Nvidia remains one of the biggest beneficiaries of the artificial intelligence boom, but its stock faces a different challenge in 2026: how much more growth can investors reasonably expect? With revenue still expanding rapidly and competition increasing, NVDA's next move will depend on whether AI infrastructure spending can sustain its current pace.
          NVDA Stock Prediction 2026–2030: How High Can Nvidia Go?_1

          Table of Contents

          • 1. NVDA Stock Prediction 2026–2030: Key Forecasts
          • 2. NVDA Stock Prediction 2026: Can Nvidia Recover Its Momentum?
          • 3. NVDA Stock Prediction 2027–2030: Long-Term Outlook
          • 4. What Could Push Nvidia Stock Higher?
          • 5. Key Risks That Could Affect NVDA Stock
          • 6. Is Nvidia Stock a Buy in 2026?

          NVDA Stock Prediction 2026–2030: Key Forecasts

          Nvidia's long-term outlook remains positive, supported by demand for AI chips, data center expansion, and its strong position in the semiconductor industry. However, a strong business does not automatically mean its stock will keep rising at the same rate.

          As of October 30, 2026, NVDA recently traded around $213.38, based on its latest reported Thursday closing price. The following forecasts are independent scenario estimates rather than guaranteed price targets.

          YearBearish ScenarioBase ScenarioBullish Scenario
          End of 2026$150–$190$200–$260$260–$300
          2027$160–$210$240–$320$330–$400
          2028$170–$230$270–$370$400–$500
          2029$180–$240$300–$430$460–$600
          2030$180–$250$350–$500$550–$700

          These ranges reflect different assumptions about AI infrastructure spending, Nvidia's market position, earnings growth, and valuation.

          The base case assumes AI demand continues growing, although at a more moderate pace than during the initial expansion of generative AI. The bullish case requires sustained investment from major technology companies, while the bearish case assumes slower spending and greater pressure on Nvidia's valuation.

          NVDA Stock Prediction 2026: Can Nvidia Recover Its Momentum?

          Nvidia's near-term outlook depends heavily on its upcoming earnings and whether investors remain confident in the AI infrastructure cycle.

          The company reported impressive financial results in its second quarter of fiscal 2027.

          According to Nvidia's August 26 earnings announcement:

          • Total revenue reached $96.2 billion, up 106% year over year.
          • Data Center revenue reached $89 billion, up 117% year over year.
          • GAAP gross margin was 75%.
          • GAAP diluted earnings per share reached $2.46.

          These figures show that demand for Nvidia's AI infrastructure remains substantial. Data Center revenue alone accounted for the overwhelming majority of quarterly sales. Nvidia's official Q2 fiscal 2027 financial results provide the full breakdown.

          However, strong earnings are no longer enough to guarantee a stock rally. Investors are increasingly focused on whether Nvidia can maintain its growth rate and convert its massive demand pipeline into sustainable profits.

          What Could Drive NVDA Higher in Late 2026?

          Three factors could support Nvidia shares before the end of 2026.

          1. Continued AI infrastructure spending

          Major cloud providers and technology companies continue investing in AI data centers. Nvidia supplies the GPUs and networking infrastructure needed to train and operate increasingly sophisticated AI models.

          If these companies maintain their spending plans, Nvidia could continue benefiting from strong orders.

          2. The transition to next-generation AI chips

          Nvidia's product roadmap is another important catalyst. Its transition from Blackwell-based systems toward its upcoming Rubin platform could create another upgrade cycle.

          Newer systems may offer better performance and efficiency, encouraging data center operators to upgrade their infrastructure.

          3. Upcoming earnings

          Nvidia is scheduled to report its third-quarter fiscal 2027 financial results on November 17, 2026. Investors will pay particular attention to revenue growth, Data Center performance, gross margins, and management's forward guidance. Nvidia's official earnings announcement confirms the scheduled date.

          A strong earnings report could support a move toward the upper end of the 2026 forecast range. However, disappointing guidance could trigger another correction.

          NVDA Stock Prediction 2027–2030: Long-Term Outlook

          Nvidia's long-term potential depends on whether artificial intelligence becomes a lasting source of corporate spending rather than a temporary investment cycle.

          The company has several advantages, including its CUDA software ecosystem, established relationships with major cloud providers, and a broad portfolio of AI computing products.

          Nevertheless, the semiconductor industry is competitive, and Nvidia cannot assume its current market position will remain unchanged.

          2027: AI Demand Remains the Main Growth Driver

          By 2027, Nvidia could benefit from continued deployment of AI infrastructure and demand for increasingly powerful computing systems.

          The base-case forecast places NVDA between $240 and $320.

          A stronger outcome would require sustained capital expenditure from hyperscalers and successful adoption of newer chip architectures. If AI spending slows or customers delay infrastructure projects, the stock could struggle to maintain its valuation.

          2028: Can Nvidia Maintain Its Competitive Advantage?

          By 2028, investors may focus less on the initial AI expansion and more on how companies generate revenue from their AI investments.

          This distinction matters for Nvidia.

          If AI applications produce measurable productivity improvements and commercial returns, businesses may continue purchasing computing capacity. That would support long-term demand for Nvidia's products.

          However, if AI monetization disappoints, customers could become more cautious about expanding their data center budgets.

          The base-case estimate for 2028 is $270–$370.

          2029–2030: A Larger AI Market, but More Competition

          Looking toward 2030, Nvidia could remain a major player in AI computing, but its growth may become less predictable.

          Several developments will matter:

          • Enterprise adoption of AI applications.
          • Demand for inference computing.
          • Development of more efficient AI chips.
          • Competition from AMD and custom-designed chips.
          • Growth in robotics, autonomous systems, and accelerated computing.

          Under the base scenario, NVDA could reach $350–$500 by 2030. A bullish outcome of $550–$700 is possible if Nvidia maintains strong earnings growth and investors continue assigning a premium valuation to its business.

          These are scenario estimates, not Wall Street consensus targets.

          What Could Push Nvidia Stock Higher?

          Nvidia has several long-term growth opportunities beyond selling GPUs for AI model training.

          AI Inference and Enterprise Adoption

          AI inference involves running trained models to generate responses, analyze information, and perform tasks.

          As AI applications become more widely used, demand for inference computing could become another significant revenue source.

          This creates an opportunity for Nvidia to benefit not only from companies building AI models but also from businesses operating them at scale.

          Robotics and Autonomous Systems

          Nvidia is also investing in robotics, autonomous driving, and physical AI.

          These markets are still developing, but they could expand the company's addressable market over time.

          If AI-powered machines become more commercially viable, demand for advanced computing platforms could increase beyond traditional data centers.

          Software and Networking Ecosystem

          Nvidia's competitive advantage is not limited to hardware.

          Its CUDA ecosystem, networking products, and integrated computing systems make it easier for customers to build AI infrastructure around Nvidia technology.

          This creates switching costs and strengthens customer relationships, although competitors are actively working to reduce dependence on Nvidia's ecosystem.

          Key Risks That Could Affect NVDA Stock

          Despite its strong financial performance, Nvidia faces several risks that could limit its stock price growth.

          1. High Expectations and Valuation Risk

          Nvidia is already valued as one of the leading companies in the AI industry.

          When investors expect exceptional growth, even strong earnings can disappoint if results fall short of expectations.

          A slowdown in revenue growth or weaker forward guidance could cause the stock to decline.

          2. Competition From AMD and Custom AI Chips

          Nvidia faces competition from AMD and custom-designed accelerators developed by major cloud providers.

          Companies such as Google and Amazon have incentives to develop their own AI chips to reduce costs and dependence on external suppliers.

          If these alternatives become more competitive, Nvidia could face pricing pressure or lose some market share.

          3. US-China Export Restrictions

          Export controls remain an important risk for Nvidia.

          Restrictions on advanced semiconductor sales to China can limit the company's access to a major market and create uncertainty around future revenue.

          Changes in government policy could also affect product availability and international supply chains.

          4. AI Spending Could Slow Down

          Nvidia's recent growth has been closely connected to substantial investments by major technology companies.

          If these companies reduce capital expenditure, delay data center construction, or fail to generate sufficient returns from AI investments, demand for Nvidia products could weaken.

          This is particularly important because a large portion of Nvidia's revenue comes from its Data Center business.

          Is Nvidia Stock a Buy in 2026?

          Nvidia remains one of the strongest companies positioned to benefit from long-term AI adoption. Its revenue growth, data center business, and software ecosystem provide a solid foundation for future expansion.

          However, investors should distinguish between the company's business performance and its stock valuation.

          For investors considering NVDA in 2026, three factors deserve attention:

          • Long-term investors: Watch AI infrastructure spending, earnings growth, and Nvidia's ability to maintain its competitive advantage.
          • Short-term traders: Pay attention to the November 17 earnings announcement, forward guidance, and price reactions around major support and resistance levels.
          • Risk-conscious investors: Consider valuation risk, competition, and the possibility that AI spending could slow.

          The base-case forecast suggests that NVDA could reach $350–$500 by 2030. However, this outcome depends on continued earnings growth and sustained demand for AI computing.

          Overall, Nvidia has attractive long-term growth potential, but its stock is not without risk. Investors should avoid assuming that past gains will automatically translate into similar returns over the next four years.

          Forecast ranges are independent scenario estimates as of October 30, 2026. This article is for informational purposes only and does not constitute investment advice.

          Sources

          1. NVIDIA – Second Quarter Fiscal 2027 Financial Results
          2. NVIDIA Investor Relations – Third-Quarter Financial Results Announcement
          3. NVIDIA – Annual Reports and Proxies
          Risk Warnings and Disclaimers
          You understand and acknowledge that there is a high degree of risk involved in trading. Following any strategies or investment methods may lead to potential losses. The content on the site is provided by our contributors and analysts for information purposes only. You are solely responsible for determining whether any trading assets, securities, strategy, or any other product is suitable for investing based on your own investment objectives and financial situation.
          Add to Favorites
          Share
          FastBull
          Copyright © 2026 FastBull Ltd

          728 RM B 7/F GEE LOK IND BLDG NO 34 HUNG TO RD KWUN TONG KLN HONG KONG

          TelegramInstagramTwitterfacebooklinkedin
          App Store Google Play Android Windows
          Products
          Charts

          Chats

          Q&A with Experts
          Screeners
          Economic Calendar
          Data
          Tools
          Membership
          Features
          Function
          Markets
          Copy Trading
          Latest Signals
          Contests
          24/7
          Analysis
          Education
          Company
          Careers
          About Us
          Contact Us
          Advertising
          Download FastBull
          Help Center
          Feedback
          User Agreement
          Privacy Policy
          Personal Information Protection Statement
          Business

          White Label

          Broker API

          Data API

          Web Plug-ins

          Poster Maker

          Affiliate Program

          Risk Disclosure

          The risk of loss in trading financial instruments such as stocks, FX, commodities, futures, bonds, ETFs and crypto can be substantial. You may sustain a total loss of the funds that you deposit with your broker. Therefore, you should carefully consider whether such trading is suitable for you in light of your circumstances and financial resources.

          No decision to invest should be made without thoroughly conducting due diligence by yourself or consulting with your financial advisors. Our web content might not suit you since we don't know your financial conditions and investment needs. Our financial information might have latency or contain inaccuracy, so you should be fully responsible for any of your trading and investment decisions. The company will not be responsible for your capital loss.

          Without getting permission from the website, you are not allowed to copy the website's graphics, texts, or trademarks. Intellectual property rights in the content or data incorporated into this website belong to its providers and exchange merchants.

          Not Logged In

          Log in to access more features

          Connect Broker
          Become a signal provider
          Help Center
          Customer Service
          Dark Mode
          Price Up/Down Colors

          Log In

          Sign Up

          Position
          Layout
          Fullscreen
          Default to Chart
          The chart page opens by default when you visit fastbull.com