• Trade
  • Markets
  • Copy
  • Contests
  • News
  • 24/7
  • Calendar
  • Q&A
  • Chats
Trending
Screeners
SYMBOL
LAST
BID
ASK
HIGH
LOW
NET CHG.
%CHG.
SPREAD
SPX
S&P 500 Index
6857.13
6857.13
6857.13
6865.94
6827.13
+7.41
+ 0.11%
--
DJI
Dow Jones Industrial Average
47850.93
47850.93
47850.93
48049.72
47692.96
-31.96
-0.07%
--
IXIC
NASDAQ Composite Index
23505.13
23505.13
23505.13
23528.53
23372.33
+51.04
+ 0.22%
--
USDX
US Dollar Index
98.860
98.940
98.860
98.980
98.840
-0.120
-0.12%
--
EURUSD
Euro / US Dollar
1.16573
1.16581
1.16573
1.16589
1.16408
+0.00128
+ 0.11%
--
GBPUSD
Pound Sterling / US Dollar
1.33435
1.33444
1.33435
1.33450
1.33165
+0.00164
+ 0.12%
--
XAUUSD
Gold / US Dollar
4220.05
4220.48
4220.05
4221.12
4194.54
+12.88
+ 0.31%
--
WTI
Light Sweet Crude Oil
59.328
59.365
59.328
59.469
59.187
-0.055
-0.09%
--

Community Accounts

Signal Accounts
--
Profit Accounts
--
Loss Accounts
--
View More

Become a signal provider

Sell trading signals to earn additional income

View More

Guide to Copy Trading

Get started with ease and confidence

View More

Signal Accounts for Members

All Signal Accounts

Best Return
  • Best Return
  • Best P/L
  • Best MDD
Past 1W
  • Past 1W
  • Past 1M
  • Past 1Y

All Contests

  • All
  • Trump Updates
  • Recommend
  • Stocks
  • Cryptocurrencies
  • Central Banks
  • Featured News
Top News Only
Share

[Market Update] Spot Silver Broke Through $58/ounce, Up 1.56% On The Day

Share

Dollar/Yen Down 0.33% To 154.61

Share

Kremlin Says No Plans For Putin-Trump Call For Now

Share

Kremlin Says Moscow Is Waiting For USA Reaction After Putin-Witkoff Meeting

Share

Cctv - China, France: Say Both Sides Support All Efforts For A Ceasefire, Restore Peace According To Intl Law

Share

[Chinese Ambassador To The US Xie Feng Hopes Chinese And American Business Communities Will Focus On Three Lists] On December 4, Chinese Ambassador To The US Xie Feng Delivered A Speech At The China-US Economic And Trade Cooperation Forum Jointly Hosted By The China Council For The Promotion Of International Trade And The Meridian International Center. Xie Feng Said That In November 2026, China Will Host The APEC Leaders' Informal Meeting For The Third Time In Shenzhen, Guangdong Province. In December 2026, The United States Will Also Host The G20 Meeting. Regarding How Chinese And American Business Communities Can Seize These Opportunities, He Suggested Focusing On Three Lists: First, Continue To Expand The Dialogue List; Second, Continuously Lengthen The Cooperation List; And Third, Constantly Reduce The Problem List

Share

India's Nifty Financial Services Index Extends Gains, Last Up 0.75%

Share

Eni : Jp Morgan Cuts To Underweight From Overweight

Share

Cctv - China, France: Signed Protocol On Sanitary, Phytosanitary Requirements For Export Of French Alfalfa Grass

Share

India's NIFTY IT Index Last Up 1.3%

Share

India's Nifty 50 Index Rises 0.35%

Share

Israel Sets 2026 Defence Budget At $34 Billion

Share

Russia Says Azov Sea's Port Of Temryuk Damaged In Ukrainian Attack

Share

Israel's Defense Budget For 2026 Will Be 112 Billion Israeli Shekels - Defense Minister Office

Share

One India Rate Panel Member Ram Singh Was Of View That Stance Should Be Changed To 'Accommodative' From 'Neutral' - Monetary Policy Committee Statement

Share

Reserve Bank Of India Chief: Will Continue To Meet Productive Needs Of Economy In Proactive Manner

Share

Reserve Bank Of India Chief: System Level Financial Parameters Of Nbfcs Sound

Share

Reserve Bank Of India Chief: Dollar Rupee Swap To Be For 3 Years, To Be Conducted This Month

Share

India's Nifty Realty Index Extend Gains, Last Up 1.4%

Share

India's Nifty Psu Bank Index Rises 1%

TIME
ACT
FCST
PREV
Turkey Trade Balance

A:--

F: --

P: --

Germany Construction PMI (SA) (Nov)

A:--

F: --

P: --

Euro Zone IHS Markit Construction PMI (Nov)

A:--

F: --

P: --

Italy IHS Markit Construction PMI (Nov)

A:--

F: --

P: --

U.K. Markit/CIPS Construction PMI (Nov)

A:--

F: --

P: --

France 10-Year OAT Auction Avg. Yield

A:--

F: --

P: --

Euro Zone Retail Sales MoM (Oct)

A:--

F: --

P: --

Euro Zone Retail Sales YoY (Oct)

A:--

F: --

P: --

Brazil GDP YoY (Q3)

A:--

F: --

P: --

U.S. Challenger Job Cuts (Nov)

A:--

F: --

P: --

U.S. Challenger Job Cuts MoM (Nov)

A:--

F: --

P: --

U.S. Challenger Job Cuts YoY (Nov)

A:--

F: --

P: --

U.S. Initial Jobless Claims 4-Week Avg. (SA)

A:--

F: --

P: --

U.S. Weekly Initial Jobless Claims (SA)

A:--

F: --

P: --

U.S. Weekly Continued Jobless Claims (SA)

A:--

F: --

P: --

Canada Ivey PMI (SA) (Nov)

A:--

F: --

P: --

Canada Ivey PMI (Not SA) (Nov)

A:--

F: --

P: --

U.S. Non-Defense Capital Durable Goods Orders Revised MoM (Excl. Aircraft) (SA) (Sept)

A:--

F: --

P: --
U.S. Factory Orders MoM (Excl. Transport) (Sept)

A:--

F: --

P: --

U.S. Factory Orders MoM (Sept)

A:--

F: --

P: --

U.S. Factory Orders MoM (Excl. Defense) (Sept)

A:--

F: --

P: --

U.S. EIA Weekly Natural Gas Stocks Change

A:--

F: --

P: --

Saudi Arabia Crude Oil Production

A:--

F: --

P: --

U.S. Weekly Treasuries Held by Foreign Central Banks

A:--

F: --

P: --

Japan Foreign Exchange Reserves (Nov)

A:--

F: --

P: --

India Repo Rate

A:--

F: --

P: --

India Benchmark Interest Rate

A:--

F: --

P: --

India Reverse Repo Rate

A:--

F: --

P: --

India Cash Reserve Ratio

A:--

F: --

P: --

Japan Leading Indicators Prelim (Oct)

A:--

F: --

P: --

U.K. Halifax House Price Index YoY (SA) (Nov)

--

F: --

P: --

U.K. Halifax House Price Index MoM (SA) (Nov)

--

F: --

P: --

France Current Account (Not SA) (Oct)

--

F: --

P: --

France Trade Balance (SA) (Oct)

--

F: --

P: --

France Industrial Output MoM (SA) (Oct)

--

F: --

P: --

Italy Retail Sales MoM (SA) (Oct)

--

F: --

P: --

Euro Zone Employment YoY (SA) (Q3)

--

F: --

P: --

Euro Zone GDP Final YoY (Q3)

--

F: --

P: --

Euro Zone GDP Final QoQ (Q3)

--

F: --

P: --

Euro Zone Employment Final QoQ (SA) (Q3)

--

F: --

P: --

Euro Zone Employment Final (SA) (Q3)

--

F: --

P: --
Brazil PPI MoM (Oct)

--

F: --

P: --

Mexico Consumer Confidence Index (Nov)

--

F: --

P: --

Canada Unemployment Rate (SA) (Nov)

--

F: --

P: --

Canada Labor Force Participation Rate (SA) (Nov)

--

F: --

P: --

Canada Employment (SA) (Nov)

--

F: --

P: --

Canada Part-Time Employment (SA) (Nov)

--

F: --

P: --

Canada Full-time Employment (SA) (Nov)

--

F: --

P: --

U.S. Dallas Fed PCE Price Index YoY (Sept)

--

F: --

P: --

U.S. PCE Price Index YoY (SA) (Sept)

--

F: --

P: --

U.S. PCE Price Index MoM (Sept)

--

F: --

P: --

U.S. Personal Outlays MoM (SA) (Sept)

--

F: --

P: --

U.S. Core PCE Price Index MoM (Sept)

--

F: --

P: --

U.S. UMich 5-Year-Ahead Inflation Expectations Prelim YoY (Dec)

--

F: --

P: --

U.S. Core PCE Price Index YoY (Sept)

--

F: --

P: --

U.S. 5-10 Year-Ahead Inflation Expectations (Dec)

--

F: --

P: --

U.S. UMich Current Economic Conditions Index Prelim (Dec)

--

F: --

P: --

U.S. UMich Consumer Sentiment Index Prelim (Dec)

--

F: --

P: --

U.S. UMich 1-Year-Ahead Inflation Expectations Prelim (Dec)

--

F: --

P: --

U.S. UMich Consumer Expectations Index Prelim (Dec)

--

F: --

P: --

Q&A with Experts
    • All
    • Chatrooms
    • Groups
    • Friends
    Connecting
    .
    .
    .
    Type here...
    Add Symbol or Code

      No matching data

      All
      Trump Updates
      Recommend
      Stocks
      Cryptocurrencies
      Central Banks
      Featured News
      • All
      • Russia-Ukraine Conflict
      • Middle East Flashpoint
      • All
      • Russia-Ukraine Conflict
      • Middle East Flashpoint
      Search
      Products

      Charts Free Forever

      Chats Q&A with Experts
      Screeners Economic Calendar Data Tools
      Membership Features
      Data Warehouse Market Trends Institutional Data Policy Rates Macro

      Market Trends

      Market Sentiment Order Book Forex Correlations

      Top Indicators

      Charts Free Forever
      Markets

      News

      News Analysis 24/7 Columns Education
      From Institutions From Analysts
      Topics Columnists

      Latest Views

      Latest Views

      Trending Topics

      Top Columnists

      Latest Update

      Signals

      Copy Rankings Latest Signals Become a signal provider AI Rating
      Contests
      Brokers

      Overview Brokers Assessment Rankings Regulators News Claims
      Broker listing Forex Brokers Comparison Tool Live Spread Comparison Scam
      Q&A Complaint Scam Alert Videos Tips to Detect Scam
      More

      Business
      Events
      Careers About Us Advertising Help Center

      White Label

      Data API

      Web Plug-ins

      Affiliate Program

      Awards Institution Evaluation IB Seminar Salon Event Exhibition
      Vietnam Thailand Singapore Dubai
      Fans Party Investment Sharing Session
      FastBull Summit BrokersView Expo
      Recent Searches
        Top Searches
          Markets
          News
          Analysis
          User
          24/7
          Economic Calendar
          Education
          Data
          • Names
          • Latest
          • Prev

          View All

          No data

          Scan to Download

          Faster Charts, Chat Faster!

          Download App
          English
          • English
          • Español
          • العربية
          • Bahasa Indonesia
          • Bahasa Melayu
          • Tiếng Việt
          • ภาษาไทย
          • Français
          • Italiano
          • Türkçe
          • Русский язык
          • 简中
          • 繁中
          Open Account
          Search
          Products
          Charts Free Forever
          Markets
          News
          Signals

          Copy Rankings Latest Signals Become a signal provider AI Rating
          Contests
          Brokers

          Overview Brokers Assessment Rankings Regulators News Claims
          Broker listing Forex Brokers Comparison Tool Live Spread Comparison Scam
          Q&A Complaint Scam Alert Videos Tips to Detect Scam
          More

          Business
          Events
          Careers About Us Advertising Help Center

          White Label

          Data API

          Web Plug-ins

          Affiliate Program

          Awards Institution Evaluation IB Seminar Salon Event Exhibition
          Vietnam Thailand Singapore Dubai
          Fans Party Investment Sharing Session
          FastBull Summit BrokersView Expo

          Newbie Bitcoin Whales Capitulating, But Old Hands Stay Silent

          NewsBTC
          Cardano / Tether
          -3.11%
          DASH / Tether
          -0.22%
          DASH / USD Coin
          -0.40%
          Zcash / USD Coin
          +8.42%
          Zcash / Tether
          +9.21%

          On-chain data shows New Whales on the Bitcoin network have been realizing losses recently, while Old Whales have remained at the sidelines.

          Bitcoin Has Faced Loss Selling From The Newbie Whales

          In a new post on X, CryptoQuant community analyst Maartunn has talked about the latest trend in the profit/loss realization behavior of the Bitcoin whales. “Whales” broadly refer to the BTC investors that hold at least 1,000 tokens in their balance.

          At the current exchange rate, the cutoff for the cohort is equivalent to $91.6 million, which is quite significant. As such, this group represents the big-money hands of the market, who can carry some degree of influence.

          Whales can be divided into two subgroups based on holding time. Investors of this size who purchased their coins within the past 155 days are known as the short-term holder (STH) or New Whales. Similarly, whales with a longer holding time are called the long-term holder (LTH) or Old Whales.

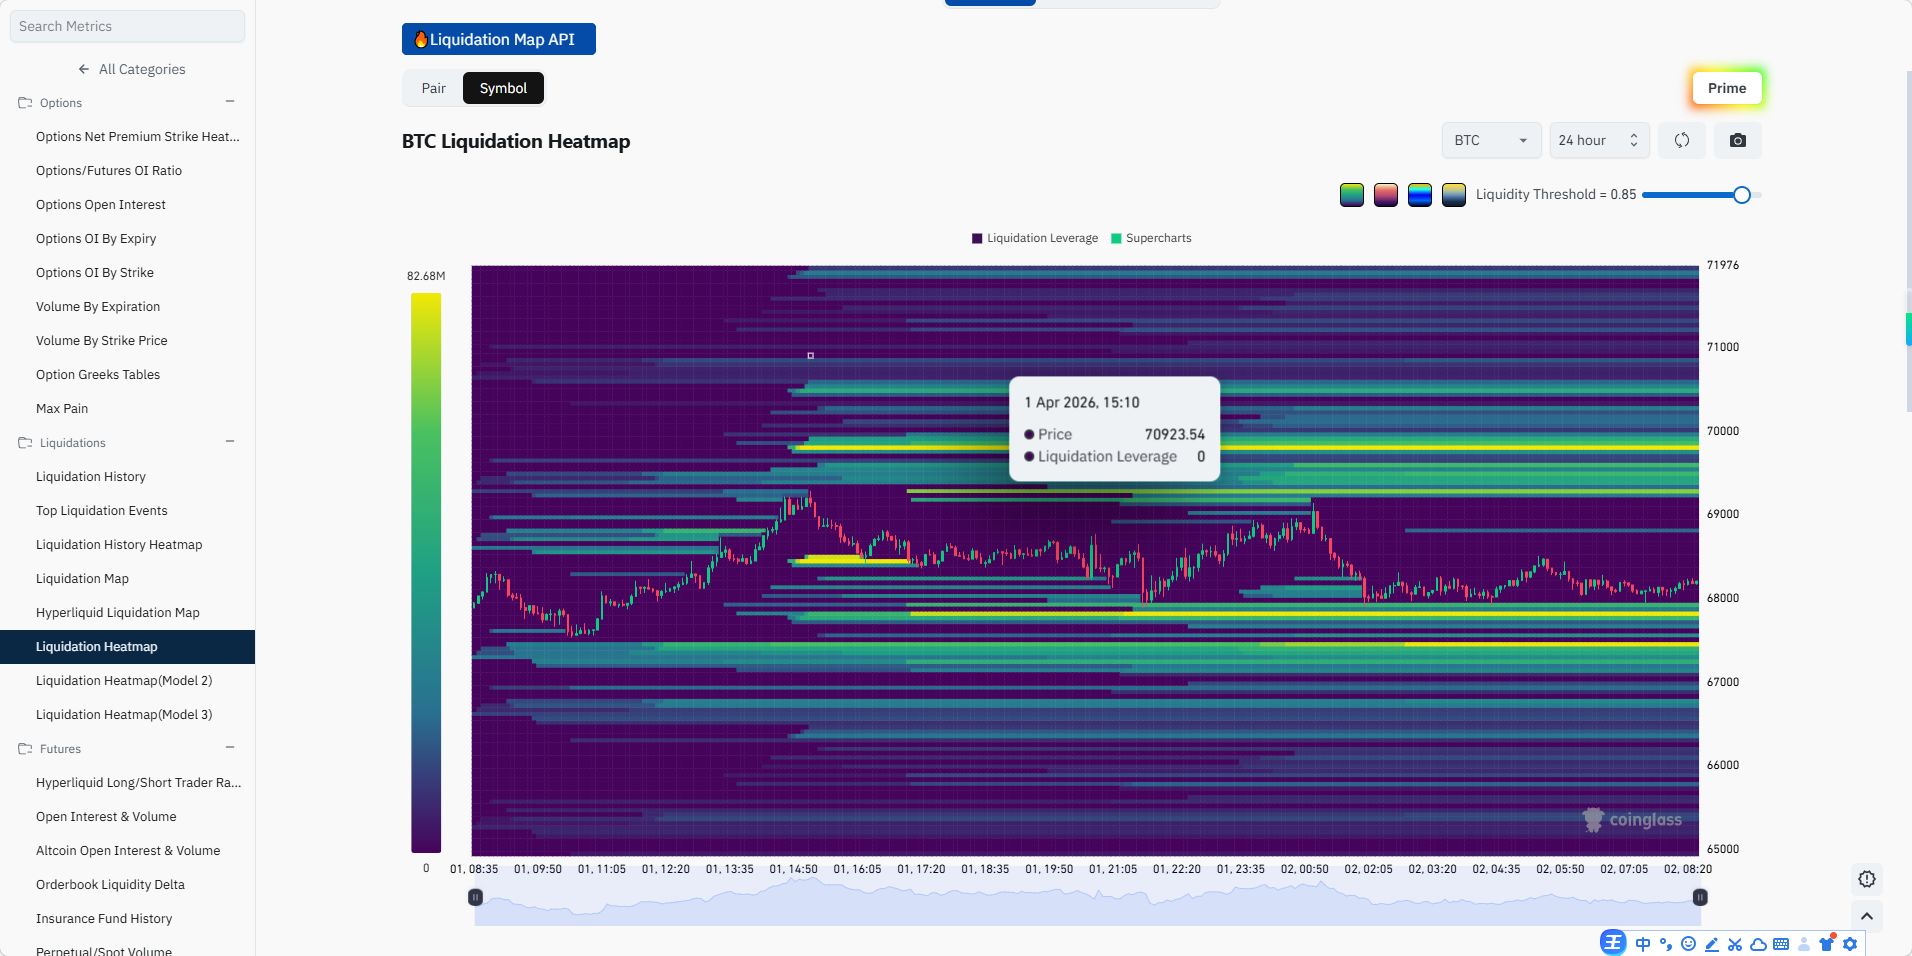
          Now, here is the chart shared by Maartunn that shows the trend in the net amount of profit/loss that these Bitcoin whale groups have been realizing through their selling over the last few months:

          As displayed in the above graph, the Bitcoin New Whales have shown some loss realization spikes recently. This underwater selling from the cohort has come as the cryptocurrency’s price has gone through a decline.

          The New Whales include the inexperienced hands of the market who tend to easily panic in the face of volatility. It would appear that this quality of the group has held through the latest crash as well.

          The Old Whales, on the other hand, are considered to represent the resolute side of the network. From the chart, it’s visible that there has been some loss selling from these large dormant entities recently, but its scale has been small compared to the New Whale capitulation.

          The fact that the presence of the Old Whales has been relatively muted through the bearish shift, as well as the rebound that has followed, could be a signal worth keeping an eye on.

          Speaking of the recovery, the Bitcoin rally has meant that its price has climbed back above a major on-chain cost basis level. As analyst Ali Martinez has shared in an X post, the Bitcoin UTXO Realized Price Distribution (URPD) suggests a strong amount of buying last occurred at $84,500.

          In on-chain analysis, strong demand zones below the spot price are considered points of potential support for Bitcoin. Similarly, levels above are assumed to be sources of resistance instead. One such major level is present at $112,300.
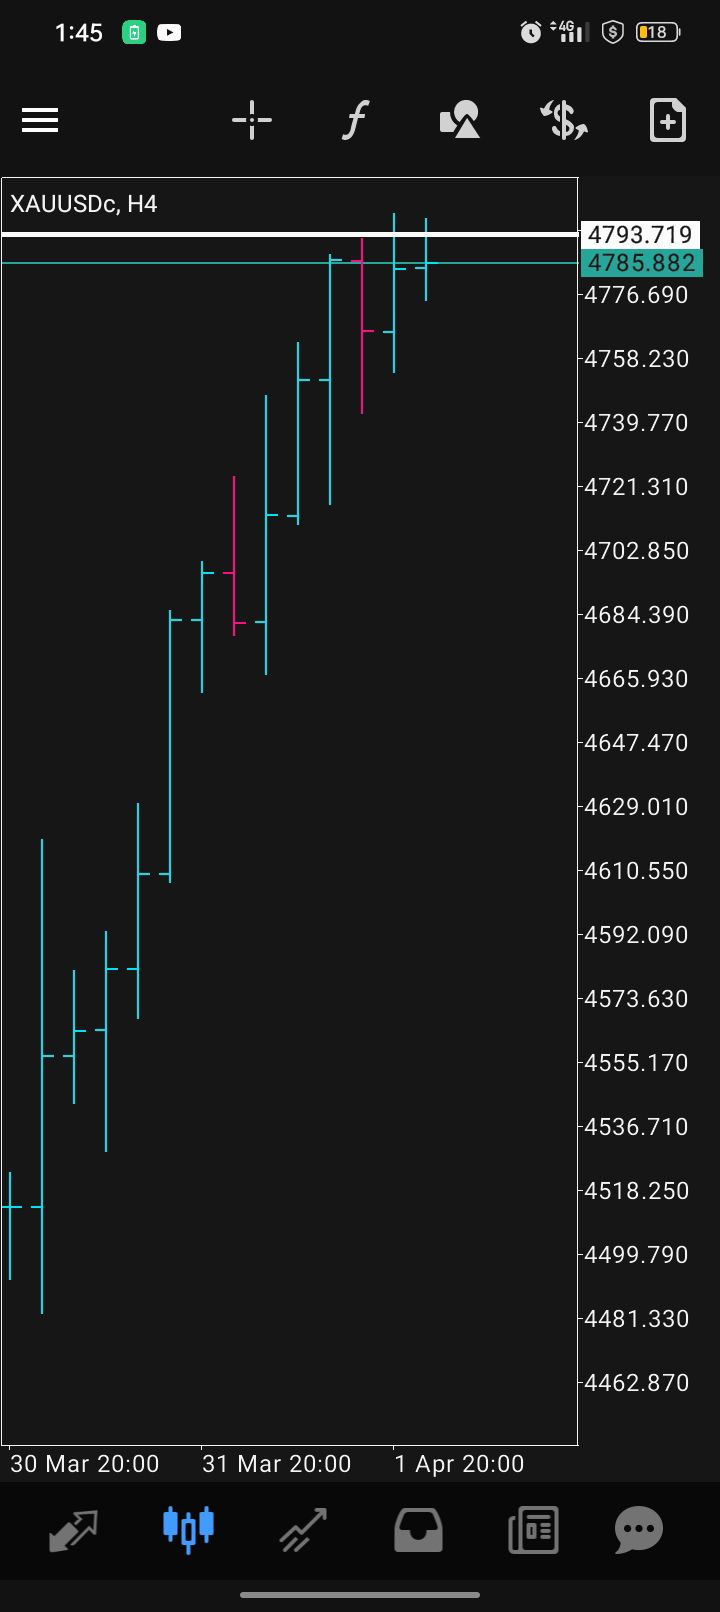
          BTC Price

          Bitcoin’s recovery has furthered during the past day as its price has returned to $92,300.

          Risk Warnings and Disclaimers
          You understand and acknowledge that there is a high degree of risk involved in trading. Following any strategies or investment methods may lead to potential losses. The content on the site is provided by our contributors and analysts for information purposes only. You are solely responsible for determining whether any trading assets, securities, strategy, or any other product is suitable for investing based on your own investment objectives and financial situation.
          Add to Favorites
          Share

          Will Bitcoin (BTC) End 2025 In Green? November Close May Hold The Key

          NewsBTC
          Cardano / Tether
          -3.11%
          DASH / Tether
          -0.22%
          DASH / USD Coin
          -0.40%
          Zcash / USD Coin
          +8.42%
          Zcash / Tether
          +9.21%

          While the crypto market bounces from last week’s correction, Bitcoin (BTC) is attempting to reclaim a crucial area as support to continue its recovery rally. As the flagship crypto faces some resistance, some market watchers have suggested that this week’s close may be key for its end-of-year performance.

          Bitcoin Faces Rejection Ahead Of November Close

          Bitcoin has retested a crucial resistance level for the first time in a week, hitting a one-week high of $93,092 on Friday morning before retracing. The flagship crypto has failed to hold crucial support levels throughout the November corrections, trading below $100,000 for nearly two weeks.

          A week ago, BTC plunged below $90,000 during the latest market correction, reaching a seven-month low of $80,600. However, the cryptocurrency led this week’s broader recovery, reclaiming key levels over the past few days.

          Amid its recent performance, some market observers have noted that Bitcoin is currently retesting a crucial re-accumulation region, between $82,000 and $93,000, where the price consolidated after previous pullbacks, including the Q1 market correction.

          Analyst Rekt Capital highlighted that BTC rebounded more than 7% from the local bottom and has revisited the range high resistance during Friday’s recovery. Now, Bitcoin is attempting to hold the high zone of its local range, retesting the $90,000-$91,000 area as support after being rejected from the key resistance.

          Previously, he pointed out that last week’s weekly close aligned with the flagship crypto’s monthly range, setting the stage for a potential floor around the $86,000 area, which would develop a new range between this level and the $93,000 resistance.

          To the analyst, Bitcoin must close the week, which also coincides with November’s monthly close, above $93,5000 and turn this level into support if it wants to further build on its newfound momentum and potentially revisit its two-month downtrend line, which currently sits near the $96,000 mark.

          “The ~$93500 level happens to be a Four-Year Cycle level. History suggests price should be able to find a way to 12-month close above ~$93500 to finish 2025 green,” Rekt Capital added on X.

          $98,000 Rally or $88,000 Drop Next?

          Market watcher Ted Pillows discussed BTC’s short-term future as it faces some resistance around the $92,000-$93,000 levels. To the analysts, reclaiming this area could propel the price towards the $98,000-$100,000 barrier in the coming weeks.

          On the contrary, he suggested that failing to reclaim this level will send Bitcoin’s price below the $88,000 mark. Earlier this week, Ted warned that this was one of the most important levels to reclaim and hold as support in the short term, as a rejection from this area could trigger a significant drop below the recent lows.

          Similarly, Daan Crypto Trades noted that the constant sell-off of the past few weeks has created “a ton of marginally lower highs, creating such a big liquidity pocket” between the $97,000-$98,000 zone.

          This region also aligns with key horizontal price levels in bigger timeframes, making it a “good area to watch,” as BTC continues to consolidate in a relatively tight range.

          The trader considers that if BTC’s price breaks down, the $88,000 mark could be a good place for a higher low. However, if the price holds above the $91,800 level, it may trigger another retest of the $93,000 resistance.

          Ultimately, He warned that the market could likely see a “Choppy environment in the short-term surrounding Thanksgiving, which always sees pretty low volume & liquidity.”

          As of this writing, Bitcoin is trading at $90,500, a 1.1% decline in the daily timeframe.

          Risk Warnings and Disclaimers
          You understand and acknowledge that there is a high degree of risk involved in trading. Following any strategies or investment methods may lead to potential losses. The content on the site is provided by our contributors and analysts for information purposes only. You are solely responsible for determining whether any trading assets, securities, strategy, or any other product is suitable for investing based on your own investment objectives and financial situation.
          Add to Favorites
          Share

          Ethereum Gained 0.11% to $3037.22 — Data Talk

          Dow Jones Newswires
          Cardano / Tether
          -3.11%
          DASH / Tether
          -0.22%
          DASH / USD Coin
          -0.40%
          Zcash / USD Coin
          +8.42%
          Zcash / Tether
          +9.21%

          Ethereum is up $3.28 today or 0.11% to $3037.22

          • Highest 5 p.m. level since Nov. 18, 2025, when it traded at $3097.14
          • Largest percentage increase since Nov. 27, 2025, when it gained 0.43%
          • Up five of the past six days
          • Up three consecutive days, up 3.61% over this period
          • Up 9.91% this week
          • Best weekly performance since the week ending Oct. 3, 2025, when it rose 13.01%
          • Down 21.3% month-to-date; On pace for worst month since Feb. 2025 when it dropped 32.98%
          • Down 9.19% year-to-date
          • Down 38.71% from its all-time intraday high of $4955.23 on Aug. 24, 2025
          • Down 15.44% from 52 weeks ago (Nov. 29, 2024), when it traded at $3591.82
          • Up 115.86% from its 52-week intraday low of $1387.85 on April 9, 2025
          • Traded as high as $3092.77; highest intraday level since Nov. 19, 2025
          • Up 1.94% at today's intraday high

          Note: The Ethereum price is a 5 p.m. ET snapshot from Kraken

          Data compiled by Dow Jones Market Data

          Risk Warnings and Disclaimers
          You understand and acknowledge that there is a high degree of risk involved in trading. Following any strategies or investment methods may lead to potential losses. The content on the site is provided by our contributors and analysts for information purposes only. You are solely responsible for determining whether any trading assets, securities, strategy, or any other product is suitable for investing based on your own investment objectives and financial situation.
          Add to Favorites
          Share

          CME Blackout: Traders Cry “Manipulation” After 10-Hour Halt Freezes Markets

          CryptoNews
          Cardano / Tether
          -3.11%
          DASH / Tether
          -0.22%
          DASH / USD Coin
          -0.40%
          Zcash / USD Coin
          +8.42%
          Zcash / Tether
          +9.21%

          The Chicago Mercantile Exchange faced one of its most disruptive trading incidents in years after a cooling failure at a major Illinois data center forced a halt that stretched for roughly 10 hours, freezing markets across multiple regions and igniting accusations of manipulation from frustrated traders.

          CME confirmed that trading because of a cooling system malfunction at the CyrusOne-operated facility in Aurora, a site that has served as the backbone of CME’s Globex electronic markets for nearly two decades.

          Due to a cooling issue at CyrusOne data centers, our markets are currently halted. Support is working to resolve the issue in the near term and will advise clients of Pre-Open details as soon as they are available.— CME Group (@CMEGroup)

          The exchange full functionality at 1:30 p.m. UTC on Friday, but the interruption had already rippled through Asia and Europe, where participants were dealing with thin post-Thanksgiving liquidity.CME Outage on Thin Thanksgiving Liquidity Sparks Questions From Traders

          During the outage, traders across asset classes—equities, currencies, commodities, energy, and crypto—reported being unable to close or adjust positions, a scenario that several described as a “nightmare.”

          One stock trader, Timothy Bozman, publicly CME of allowing a “simple issue” to cripple the entire futures complex, questioning how all major markets could be taken offline by a single point of failure.

          Manipulation at it's best. How in the actual $&#@ could the entire Index Futures, FX Futures, Metals futures, Energy Futures, Agriculture Futures markets and options be halted because of a server overheating. A simple issue could take down entire futures platform? — Timothy Bozman (@MrAmazingBoz)

          Others went further, that the timing was “too convenient,” given that the halt arrived during the low-volume Asia session on Thanksgiving, when sudden price moves can unfold with limited resistance.

          Some traders out that silver futures were approaching a record high near $54 just minutes before prices froze, adding fuel to the speculation and frustration.

          The outage was widespread because the Globex platform handles the majority of CME’s volume.

          An earlier cryptonews report stated that crude and palm oil markets stopped moving during the halt, while crypto traders saw Bitcoin and Ethereum futures go offline entirely.

          The timing added complexity for firms preparing month-end rolls, particularly those needing to adjust Treasury futures or SOFR-linked positions

          Several traders later noted that even after markets reopened, delays continued in Treasury futures and certain rate products.

          Trading activity had already been muted due to the U.S. Thanksgiving holiday, but the outage further slowed an already quiet session.

          Official communication from CME Group on their website has been posted. It’s officially ruled as a technical halt. Carry on. I’d expect your prop firm to cancel losses for any stuck trades but we’ll see. — KD (@KingDipsX)

          One user on X publicly CME to cancel losses for trades affected during the freeze, reflecting the broader anxiety of traders locked into moving markets with no ability to act.CME Suffers Major Outage as It Prepares Shift to 24/7 Crypto Trading in 2026

          CyrusOne, which operates more than 55 data centers globally and is backed by KKR and BlackRock’s Global Infrastructure Partners, the cooling malfunction.

          The Aurora facility is well-known among high-frequency trading firms that place servers as physically close as possible to CME’s matching engines to shave off microseconds.

          The exchange acknowledged that CME Direct, a platform used for some markets, remained unavailable even after Globex reopened, showing the extent of the disruption.

          The incident lasted far longer than a similar 2019 CME outage, and it was the latest reminder of how centralized infrastructure can pose systemic risk in electronic markets.

          CME has faced technical issues in the past, including a triggered by a software malfunction affecting agricultural contracts.

          Despite the friction, markets resumed and continued adjusting to broader price movements.

          Bitcoin futures, which closed on Wednesday at $90,355 before the holiday, reopened at $90,940 on Friday and pushed above $93,000 later in the session as BTC rebounded from its recent low of around $80,522. Source: Cryptonews

          Analysts noted that Bitcoin faces resistance near $95,000, but reclaiming that level could reopen the path toward six-figure territory.

          The blackout also comes at a moment when CME is expanding its role in the digital asset sector. In October, the exchange said it plans to move its cryptocurrency futures and options into a full 24/7 trading cycle starting in early 2026, subject to regulatory approval.

          The firm cited rapidly rising demand for continuous risk management in crypto markets, which never close.

          CME said trading will run nonstop on Globex, aside from a brief weekly maintenance window, and weekend transactions will be assigned to the next business day for clearing and settlement.

          Risk Warnings and Disclaimers
          You understand and acknowledge that there is a high degree of risk involved in trading. Following any strategies or investment methods may lead to potential losses. The content on the site is provided by our contributors and analysts for information purposes only. You are solely responsible for determining whether any trading assets, securities, strategy, or any other product is suitable for investing based on your own investment objectives and financial situation.
          Add to Favorites
          Share

          SOON (SOON) - 21.88MM Token Unlock - 23 Dec 2025

          CoinMarketCal
          Cardano / Tether
          -3.11%
          DASH / Tether
          -0.22%
          DASH / USD Coin
          -0.40%
          Zcash / USD Coin
          +8.42%
          Zcash / Tether
          +9.21%

          On December 23, 2025, SOON will unlock almost 22 million tokens, which is about 5.97% of its available supply. This event can cause a bigger movement in SOON's price. If most of these unlocked tokens are sold, the price may go down because there are more tokens to buy in the market. If investors keep their tokens instead, the price may not change much. It is important to watch trading volumes and social media before and after this event to guess where the price could move. source

          Risk Warnings and Disclaimers
          You understand and acknowledge that there is a high degree of risk involved in trading. Following any strategies or investment methods may lead to potential losses. The content on the site is provided by our contributors and analysts for information purposes only. You are solely responsible for determining whether any trading assets, securities, strategy, or any other product is suitable for investing based on your own investment objectives and financial situation.
          Add to Favorites
          Share

          Sahara AI (SAHARA) - 132.93MM Token Unlock - 26 Dec 2025

          CoinMarketCal
          Cardano / Tether
          -3.11%
          DASH / Tether
          -0.22%
          DASH / USD Coin
          -0.40%
          Zcash / USD Coin
          +8.42%
          Zcash / Tether
          +9.21%

          Sahara AI plans to unlock about 133 million tokens on December 26, 2025, making up 5.3% of its released supply. This will increase the number of tokens traders can buy or sell. If many holders sell their newly unlocked tokens, the price may fall because of more supply in the market. If investors trust the project and hold onto their tokens, the effect may be smaller. Traders should pay attention to community talks and previous unlock patterns. source

          Risk Warnings and Disclaimers
          You understand and acknowledge that there is a high degree of risk involved in trading. Following any strategies or investment methods may lead to potential losses. The content on the site is provided by our contributors and analysts for information purposes only. You are solely responsible for determining whether any trading assets, securities, strategy, or any other product is suitable for investing based on your own investment objectives and financial situation.
          Add to Favorites
          Share

          Slash Vision Labs (SVL) - 275MM Token Unlock - 30 Nov 2025

          CoinMarketCal
          Cardano / Tether
          -3.11%
          DASH / Tether
          -0.22%
          DASH / USD Coin
          -0.40%
          Zcash / USD Coin
          +8.42%
          Zcash / Tether
          +9.21%

          On November 30, 2025, Slash Vision Labs will unlock 275 million tokens, around 3.68% of its supply. This is a large number of tokens, and it could change the price of SVL a lot. If many people sell these tokens, the price will likely drop because there is more supply. If most holders do not sell, the price could stay stable. Traders should watch trading action and news near the unlock date to understand what might happen. source

          Risk Warnings and Disclaimers
          You understand and acknowledge that there is a high degree of risk involved in trading. Following any strategies or investment methods may lead to potential losses. The content on the site is provided by our contributors and analysts for information purposes only. You are solely responsible for determining whether any trading assets, securities, strategy, or any other product is suitable for investing based on your own investment objectives and financial situation.
          Add to Favorites
          Share
          FastBull
          Copyright © 2025 FastBull Ltd

          728 RM B 7/F GEE LOK IND BLDG NO 34 HUNG TO RD KWUN TONG KLN HONG KONG

          TelegramInstagramTwitterfacebooklinkedin
          App Store Google Play Google Play
          Products
          Charts

          Chats

          Q&A with Experts
          Screeners
          Economic Calendar
          Data
          Tools
          Membership
          Features
          Function
          Markets
          Copy Trading
          Latest Signals
          Contests
          News
          Analysis
          24/7
          Columns
          Education
          Company
          Careers
          About Us
          Contact Us
          Advertising
          Help Center
          Feedback
          User Agreement
          Privacy Policy
          Business

          White Label

          Data API

          Web Plug-ins

          Poster Maker

          Affiliate Program

          Risk Disclosure

          The risk of loss in trading financial instruments such as stocks, FX, commodities, futures, bonds, ETFs and crypto can be substantial. You may sustain a total loss of the funds that you deposit with your broker. Therefore, you should carefully consider whether such trading is suitable for you in light of your circumstances and financial resources.

          No decision to invest should be made without thoroughly conducting due diligence by yourself or consulting with your financial advisors. Our web content might not suit you since we don't know your financial conditions and investment needs. Our financial information might have latency or contain inaccuracy, so you should be fully responsible for any of your trading and investment decisions. The company will not be responsible for your capital loss.

          Without getting permission from the website, you are not allowed to copy the website's graphics, texts, or trademarks. Intellectual property rights in the content or data incorporated into this website belong to its providers and exchange merchants.

          Not Logged In

          Log in to access more features

          FastBull Membership

          Not yet

          Purchase

          Become a signal provider
          Help Center
          Customer Service
          Dark Mode
          Price Up/Down Colors

          Log In

          Sign Up

          Position
          Layout
          Fullscreen
          Default to Chart
          The chart page opens by default when you visit fastbull.com