• Trade
  • Markets
  • Copy
  • Contests
  • 24/7
  • Calendar
  • Q&A
  • Chats
Screeners
SYMBOL
LAST
ASK
BID
HIGH
LOW
NET CHG.
%CHG.
SPREAD
SPX
S&P 500 Index
6932.31
6932.31
6932.31
6944.90
6828.78
+133.91
+ 1.97%
--
DJI
Dow Jones Industrial Average
50115.66
50115.66
50115.66
50169.65
49032.19
+1206.95
+ 2.47%
--
IXIC
NASDAQ Composite Index
23031.20
23031.20
23031.20
23088.46
22586.40
+490.63
+ 2.18%
--
USDX
US Dollar Index
97.550
97.630
97.550
97.550
97.510
+0.030
+ 0.03%
--
EURUSD
Euro / US Dollar
1.18141
1.18150
1.18141
1.18219
1.18110
-0.00002
0.00%
--
GBPUSD
Pound Sterling / US Dollar
1.36057
1.36079
1.36057
1.36092
1.35876
+0.00007
+ 0.01%
--
XAUUSD
Gold / US Dollar
4986.31
4987.81
4986.31
4991.93
4965.47
+20.27
+ 0.41%
--
WTI
Light Sweet Crude Oil
62.599
62.636
62.599
62.797
62.523
-0.711
-1.12%
--

Community Accounts

Signal Accounts
--
Profit Accounts
--
Loss Accounts
--
View More

Become a signal provider

Sell trading signals to earn additional income

View More

Guide to Copy Trading

Get started with ease and confidence

View More

Signal Accounts for Members

All Signal Accounts

Best Return
  • Best Return
  • Best P/L
  • Best MDD
Past 1W
  • Past 1W
  • Past 1M
  • Past 1Y

All Contests

  • All
  • Trump Updates
  • Recommend
  • Stocks
  • Cryptocurrencies
  • Central Banks
  • Featured News
Top News Only
Share

Crude Oil Futures Drop More Than 1% As Iran-US Nuclear Talks Continue

Share

S&P 500 Eminis Rise 0.2%, Nasdaq Futures Also Up 0.2%

Share

[South African Reserve Bank Governor Warns Of Risks From Rising Stablecoin Usage] South African Reserve Bank (SARB) Governor Lesetja Kganyago Has Warned Of The Risks Posed By The Increasing Adoption Of Stablecoins, Stating That These Crypto Assets Risk A "break Apart." He Emphasized The Central Bank's Responsibility To Protect The "unity Of The Currency" And Its Affordability For The Public. The Central Bank Needs To "protect The Unity Of The Currency And Its Affordability For The Public… The Truth Is, These Things Can Break Apart."

Share

North Korea Leader Kim Jong UN Visited Ministry Of Defence To Mark Armed Forces Foundation Anniversary

Share

[US House Minority Leader: Democrats Will Not Pass Homeland Security Funding Agreement Without ICE Reform] House Minority Leader Hakeem Jeffries Stated That Democrats Are Insisting On Comprehensive Reform Of Immigration And Customs Enforcement (ICE) By Friday's (February 13) Deadline, Threatening To Withhold Remaining Government Funding For The Department Of Homeland Security (DHS) Otherwise. Key Demands From The Democrats Include: Prohibiting Law Enforcement Officers From Entering Private Property Without Judicial Authorization, Mandating The Use Of Body Cameras And Identification Badges, And Prohibiting Face Coverings (masks) During Law Enforcement. If An Agreement Is Not Reached By The End Of This Week, The DHS Will Face Another Shutdown, Which Will Impact Customs And Border Protection (CBP), Federal Emergency Management Agency (FEMA), Transportation Security Administration (TSA), And The Coast Guard

Share

[Trump's Treasury Secretary Recommends: Justice Department Investigation And Senate Hearings For Kevin Warsh's Nomination Should Proceed Simultaneously] Despite Key Republican Senator Thom Tillis's Vow To Block All Federal Reserve Nominations, Treasury Secretary Scott Bessant Has Recommended That The Senate Begin Hearings On President Trump's Nominee For Federal Reserve Chair, Kevin Warsh. Bessant Stated That Trump Nominated Warsh On January 30 To Succeed Powell, And That Warsh Received Broad Senate Support During His Confirmation As A Fed Governor. He Believes That Despite The Blockade, Hearings On Warsh's Latest Nomination Should Continue

Share

US President Trump: We Are Withdrawing (DHS) Officials From Minneapolis; They Are Doing A Good Job There

Share

US President Trump Addressed The Inflation Issue, Declaring: "I've Solved The Problem."

Share

The US Will Hold Midterm Elections In November, And Treasury Secretary Bessant Sees The Dow Jones Industrial Average's New High As Evidence That The Country's Economy Is In An Upward Cycle, Benefiting Ordinary People. Speaking About The Federal Reserve's Policy, Bessant Said He Expects The Central Bank To Be Cautious About Any Efforts To Shrink Its Balance Sheet

Share

Dollar/Yen Rises 0.2% To 157.5 After Japanese Prime Minister Takaichi's Decisive Election Victory

Share

United Arab Emirates Says Algeria's Cancellation Of Air Services Agreement Between Both Countries Doesn't Result In Any Immediate Impact On Air Traffic Operations

Share

Media: Israel To Take More West Bank Powers And Relax Settler Land Buys

Share

[U.S. Treasury Secretary Yellen: Gold Seems Like A Classic Speculative Sell-Off Rally] February 9Th, According To Market Sources, U.S. Treasury Secretary Yellen Said Gold Is Looking Like A Typical Speculative Sell-Off.

Share

US Treasury's Bessent Says Fed Will Take Its Time On Balance Sheet Moves

Share

Residential Building Collapses In Lebanese City Of Tripoli, Trapping Unknown Number Of People Under Rubble - Security Sources And Officials

Share

Bessent: New Japan Prime Minister Is A Great Ally, Has Great Relationship With Trump

Share

Taiwan President: Look Forward To Cooperating With You So Taiwan And Japan Can Continue To Face Regional Challenges Together And Promote Peace And Prosperity In The Indo-Pacific

Share

Taiwan President: Congratulates Sanae Takaichi On Winning Japan Election

Share

Ukraine President Zelenskiy: Russian Energy Infrastructure Is A Legal Target For Ukrainian Strikes

Share

Ukraine President Zelenskiy: Ukraine Will Launch Drone Production In Germany By Mid-February

TIME
ACT
FCST
PREV
India Reverse Repo Rate

A:--

F: --

P: --

Japan Leading Indicators Prelim (Dec)

A:--

F: --

P: --

Germany Industrial Output MoM (SA) (Dec)

A:--

F: --

P: --
Germany Exports MoM (SA) (Dec)

A:--

F: --

P: --

U.K. Halifax House Price Index YoY (SA) (Jan)

A:--

F: --

P: --
U.K. Halifax House Price Index MoM (SA) (Jan)

A:--

F: --

P: --
France Trade Balance (SA) (Dec)

A:--

F: --

P: --
Canada Leading Index MoM (Jan)

A:--

F: --

P: --
Mexico Consumer Confidence Index (Jan)

A:--

F: --

P: --

Canada Employment (SA) (Jan)

A:--

F: --

P: --
Canada Full-time Employment (SA) (Jan)

A:--

F: --

P: --
Canada Part-Time Employment (SA) (Jan)

A:--

F: --

P: --
Canada Unemployment Rate (SA) (Jan)

A:--

F: --

P: --

Canada Labor Force Participation Rate (SA) (Jan)

A:--

F: --

P: --

Due to the previous government shutdown, the release date of the US January non-farm payroll report has been changed to February 11.
U.S. UMich Consumer Sentiment Index Prelim (Feb)

A:--

F: --

P: --

U.S. UMich Consumer Expectations Index Prelim (Feb)

A:--

F: --

P: --

Canada Ivey PMI (Not SA) (Jan)

A:--

F: --

P: --

U.S. UMich Current Economic Conditions Index Prelim (Feb)

A:--

F: --

P: --

Canada Ivey PMI (SA) (Jan)

A:--

F: --

P: --

U.S. UMich 5-Year-Ahead Inflation Expectations Prelim YoY (Feb)

A:--

F: --

P: --

U.S. UMich 1-Year-Ahead Inflation Expectations Prelim (Feb)

A:--

F: --

P: --

U.S. 5-10 Year-Ahead Inflation Expectations (Feb)

A:--

F: --

P: --

Russia Retail Sales YoY (Dec)

A:--

F: --

P: --

Russia Unemployment Rate (Dec)

A:--

F: --

P: --

Russia Quarterly GDP Prelim YoY (Q1)

--

F: --

P: --

U.S. Weekly Total Oil Rig Count

A:--

F: --

P: --

U.S. Weekly Total Rig Count

A:--

F: --

P: --

U.S. Consumer Credit (SA) (Dec)

A:--

F: --

P: --
China, Mainland Foreign Exchange Reserves (Jan)

A:--

F: --

P: --

Japan Wages MoM (Dec)

--

F: --

P: --

Japan Trade Balance (Customs Data) (SA) (Dec)

--

F: --

P: --

Japan Trade Balance (Dec)

--

F: --

P: --

Euro Zone Sentix Investor Confidence Index (Feb)

--

F: --

P: --

Mexico CPI YoY (Jan)

--

F: --

P: --

Mexico 12-Month Inflation (CPI) (Jan)

--

F: --

P: --

Mexico PPI YoY (Jan)

--

F: --

P: --

Mexico Core CPI YoY (Jan)

--

F: --

P: --

ECB Chief Economist Lane Speaks
Canada National Economic Confidence Index

--

F: --

P: --

China, Mainland M0 Money Supply YoY (Jan)

--

F: --

P: --

China, Mainland M2 Money Supply YoY (Jan)

--

F: --

P: --

China, Mainland M1 Money Supply YoY (Jan)

--

F: --

P: --

ECB President Lagarde Speaks
U.K. BRC Overall Retail Sales YoY (Jan)

--

F: --

P: --

U.K. BRC Like-For-Like Retail Sales YoY (Jan)

--

F: --

P: --

Indonesia Retail Sales YoY (Dec)

--

F: --

P: --

France ILO Unemployment Rate (SA) (Q4)

--

F: --

P: --

U.S. NFIB Small Business Optimism Index (SA) (Jan)

--

F: --

P: --

Brazil IPCA Inflation Index YoY (Jan)

--

F: --

P: --

Brazil CPI YoY (Jan)

--

F: --

P: --

U.S. Retail Sales YoY (Dec)

--

F: --

P: --

U.S. Labor Cost Index QoQ (Q4)

--

F: --

P: --

U.S. Import Price Index MoM (Dec)

--

F: --

P: --

U.S. Export Price Index YoY (Dec)

--

F: --

P: --

U.S. Export Price Index MoM (Dec)

--

F: --

P: --

U.S. Import Price Index YoY (Dec)

--

F: --

P: --

U.S. Retail Sales MoM (Dec)

--

F: --

P: --

U.S. Core Retail Sales MoM (Dec)

--

F: --

P: --

U.S. Core Retail Sales (Dec)

--

F: --

P: --

U.S. Retail Sales MoM (Excl. Gas Stations & Vehicle Dealers) (SA) (Dec)

--

F: --

P: --

Q&A with Experts
    • All
    • Chatrooms
    • Groups
    • Friends
    john flag
    Jamolla
    But you we can't ignore the US reserve rumors which is a big narrative shift.
    @JamollaRumors aren’t policy. Gold doesn’t move on rumors; crypto does
    Sandeep99%loss flag
    All are failed traders, I too
    long flag
    40JR04NOX7
    All are failed traders, I too
    Nope you are not.
    GHO$T flag
    Good evening everyone
    long flag
    Evening
    long flag
    You trade?
    long flag
    Market volatility is still high — especially in tech, while blue-chip stocks are holding stronger ground.
    john flag
    Gulsas
    Market volatility is still high — especially in tech, while blue-chip stocks are holding stronger ground.
    @Gulsas buckle up for another week of volatility
    Javier Sal flag
    meta
    NJGME6M73L flag
    Anyone know about gold can it be bullish at Monday
    NJGME6M73L flag
    2357328
    i Swear Please
    @Visitor2357328 there is no crash right now bruh it’s correction now
    3574357 flag
    can i see extended hours prices in charts for stocks trading on nasdaq n nyse. plz tell me the setting for that
    Kung Fu flag
    3574357
    can i see extended hours prices in charts for stocks trading on nasdaq n nyse. plz tell me the setting for that
    @Visitor3574357are you on the mobile app
    3575270 flag
    gold will be bullish monday
    WhereisAB flag
    3575270
    gold will be bullish monday
    @Visitor3575270 ?
    Kung Fu flag
    3575270
    gold will be bullish monday
    @Visitor3575270how do you know this? The market will open soon
    Vjesttt flag
    How long will the review contest last?
    Kung Fu flag
    Vjesttt
    How long will the review contest last?
    @Vjestttyou mean how long the review of the just concluded FastBull contest
    Vjesttt flag
    Kung Fu
    @Kung Fuyes
    Abraham Ad flag
    Hello everyone
    Type here...
    Add Symbol or Code

      No matching data

      All
      Trump Updates
      Recommend
      Stocks
      Cryptocurrencies
      Central Banks
      Featured News
      • All
      • Russia-Ukraine Conflict
      • Middle East Flashpoint
      • All
      • Russia-Ukraine Conflict
      • Middle East Flashpoint
      Search
      Products

      Charts Free Forever

      Chats Q&A with Experts
      Screeners Economic Calendar Data Tools
      Membership Features
      Data Warehouse Market Trends Institutional Data Policy Rates Macro

      Market Trends

      Market Sentiment Order Book Forex Correlations

      Top Indicators

      Charts Free Forever
      Markets

      News

      24/7 Analysis Education

      Latest Views

      Latest Update

      Signals

      Copy Rankings Latest Signals Become a signal provider AI Rating
      Contests
      Brokers

      Overview Brokers Assessment Rankings Regulators News Claims
      Broker listing Forex Brokers Comparison Tool Live Spread Comparison Scam
      Q&A Complaint Scam Alert Videos Tips to Detect Scam
      More

      Business
      Events
      Careers About Us Advertising Help Center

      White Label

      Broker API

      Data API

      Web Plug-ins

      Affiliate Program

      Awards Institution Evaluation IB Seminar Salon Event Exhibition
      Vietnam Thailand Singapore Dubai
      Fans Party Investment Sharing Session
      FastBull Summit BrokersView Expo
      Recent Searches
        Top Searches
          Markets
          Analysis
          User
          24/7
          Economic Calendar
          Education
          Data
          • Names
          • Latest
          • Prev

          View All

          No data

          Scan to Download

          Faster Charts, Chat Faster!

          Download App
          English
          • English
          • Español
          • العربية
          • Bahasa Indonesia
          • Bahasa Melayu
          • Tiếng Việt
          • ภาษาไทย
          • Français
          • Italiano
          • Türkçe
          • Русский язык
          • 简中
          • 繁中
          Open Account
          Search
          Products
          Charts Free Forever
          Markets
          News
          Signals

          Copy Rankings Latest Signals Become a signal provider AI Rating
          Contests
          Brokers

          Overview Brokers Assessment Rankings Regulators News Claims
          Broker listing Forex Brokers Comparison Tool Live Spread Comparison Scam
          Q&A Complaint Scam Alert Videos Tips to Detect Scam
          More

          Business
          Events
          Careers About Us Advertising Help Center

          White Label

          Broker API

          Data API

          Web Plug-ins

          Affiliate Program

          Awards Institution Evaluation IB Seminar Salon Event Exhibition
          Vietnam Thailand Singapore Dubai
          Fans Party Investment Sharing Session
          FastBull Summit BrokersView Expo

          How to Track Commodities With Li Keqiang Index

          Summary:

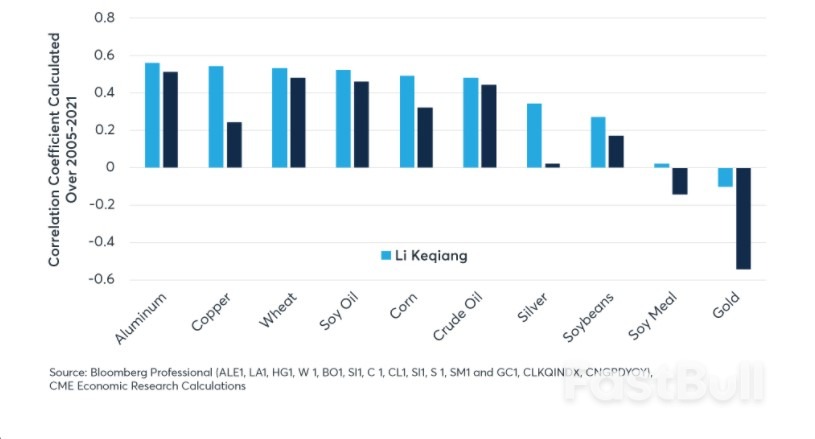
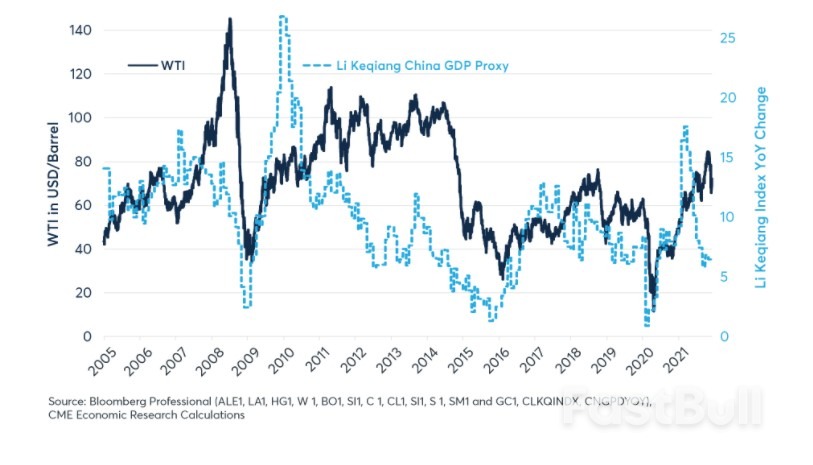
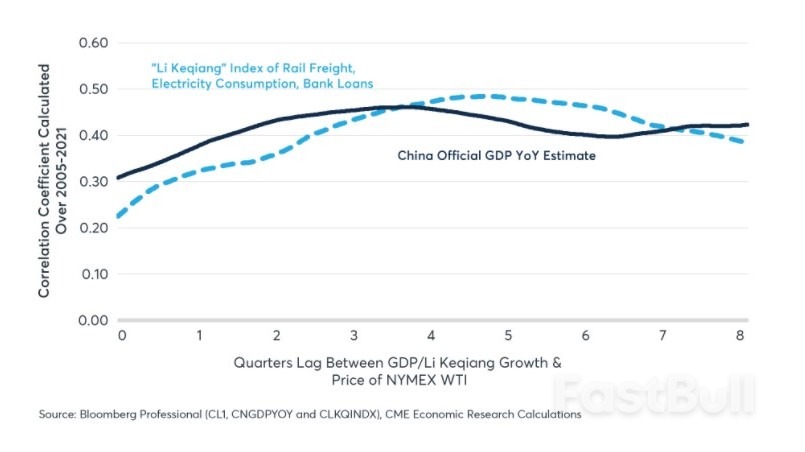
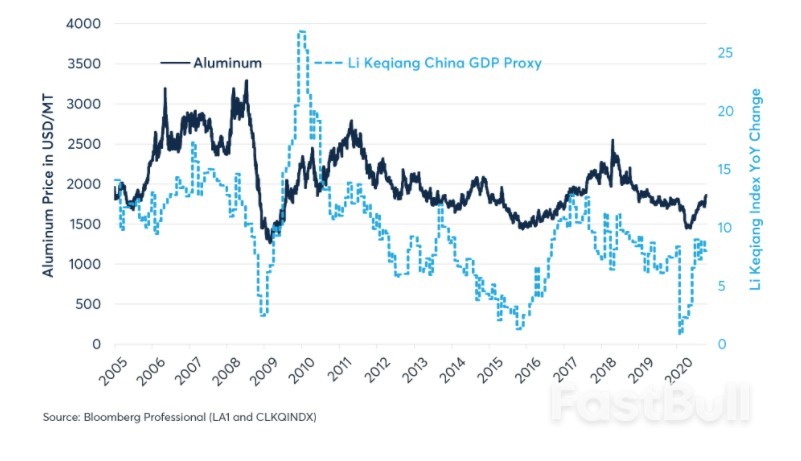
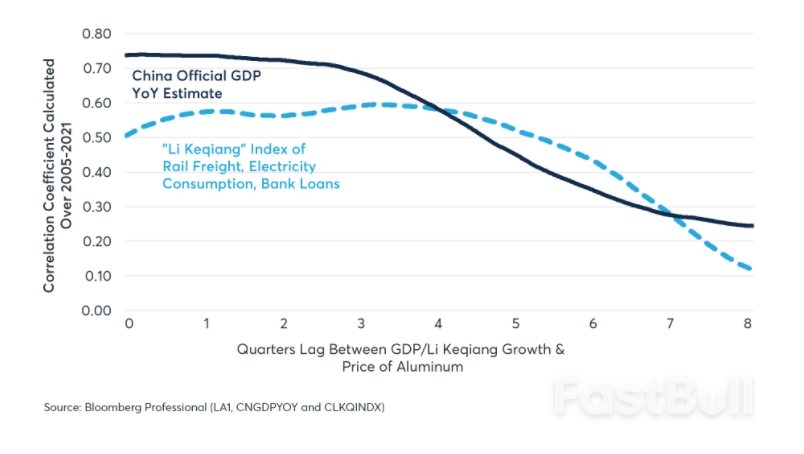
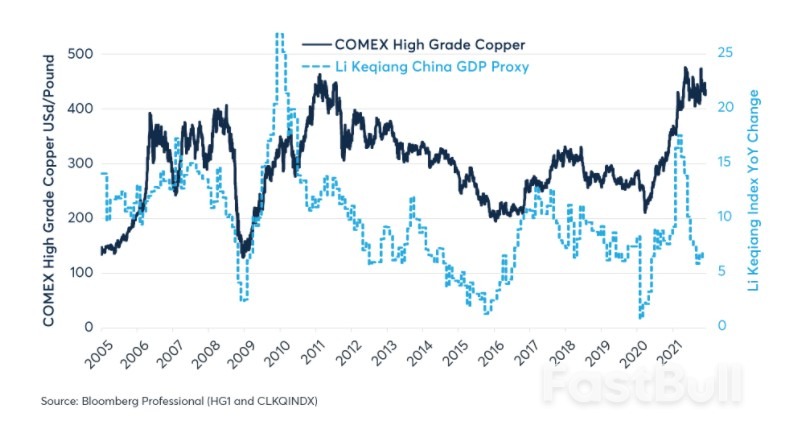
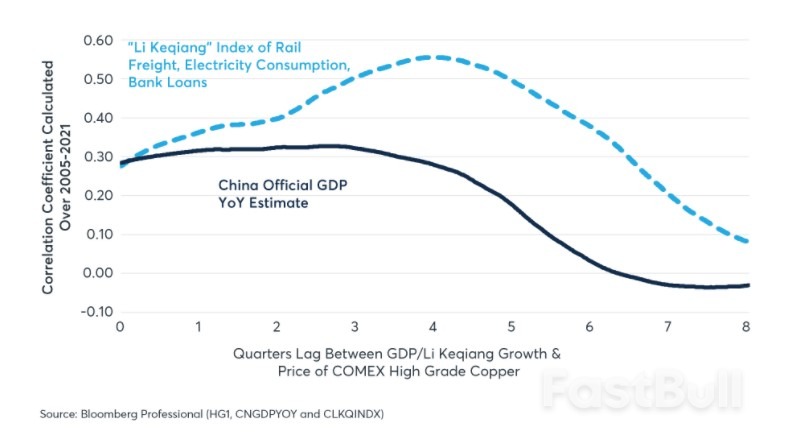
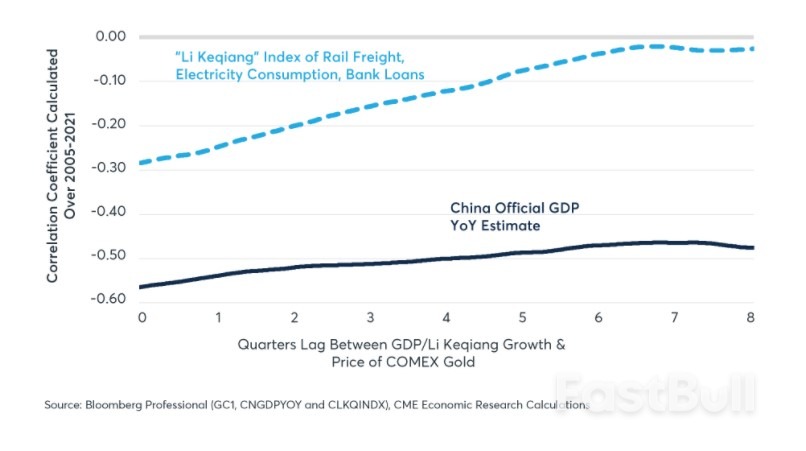
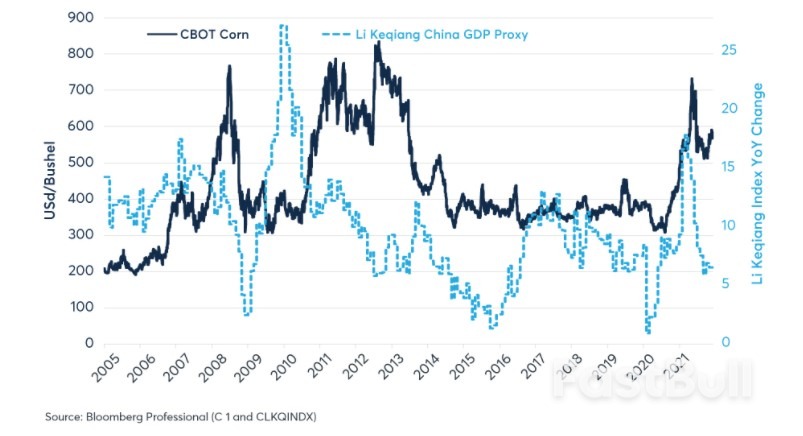
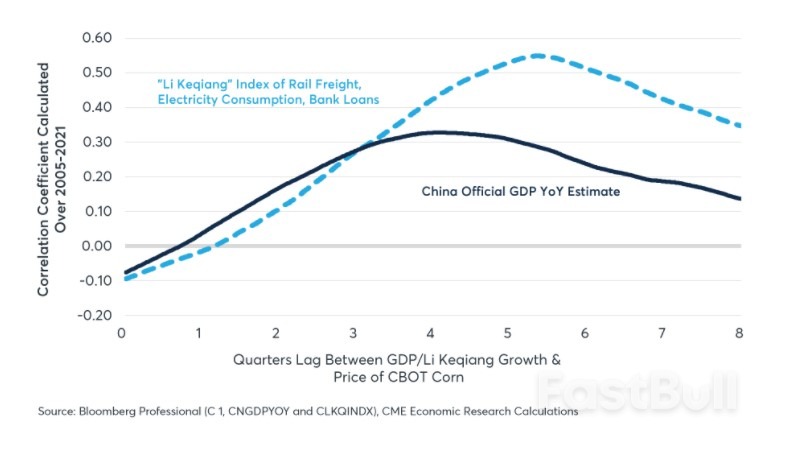
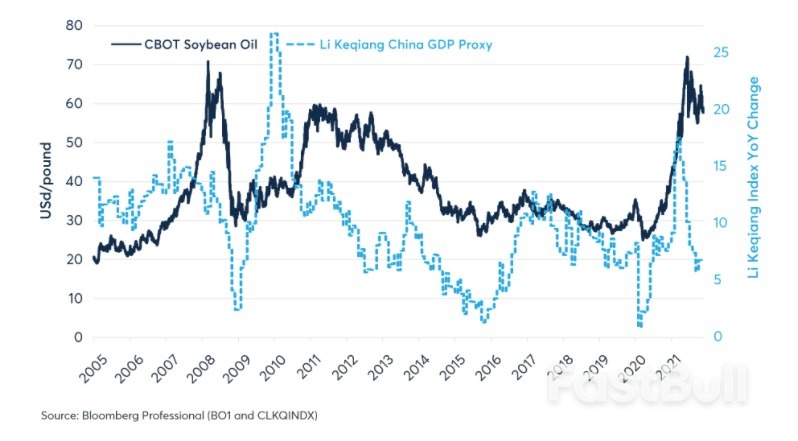
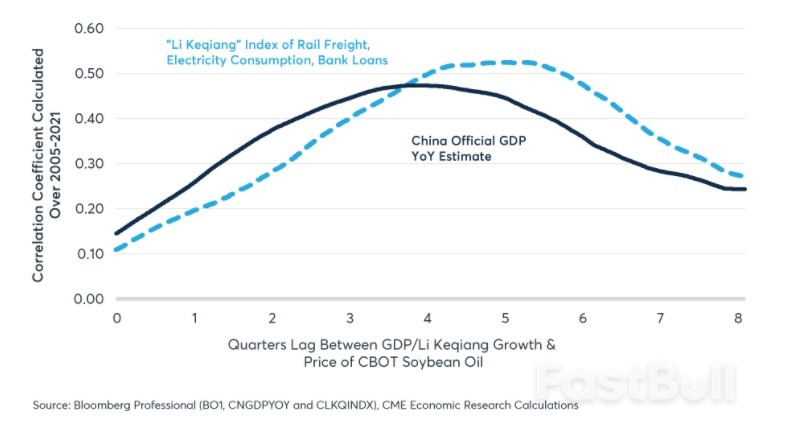
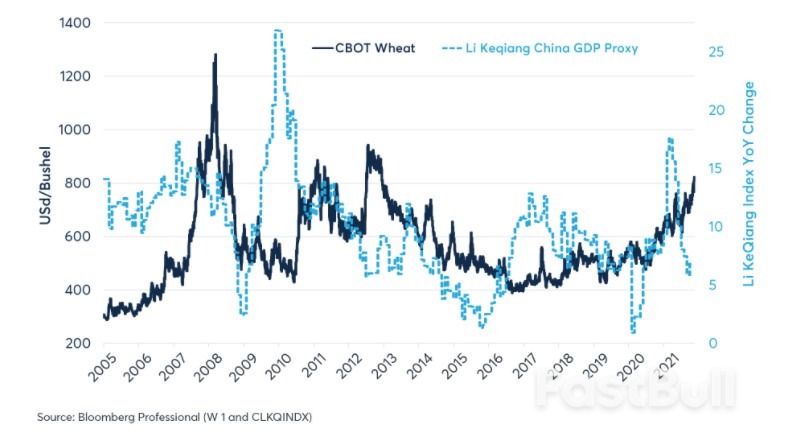
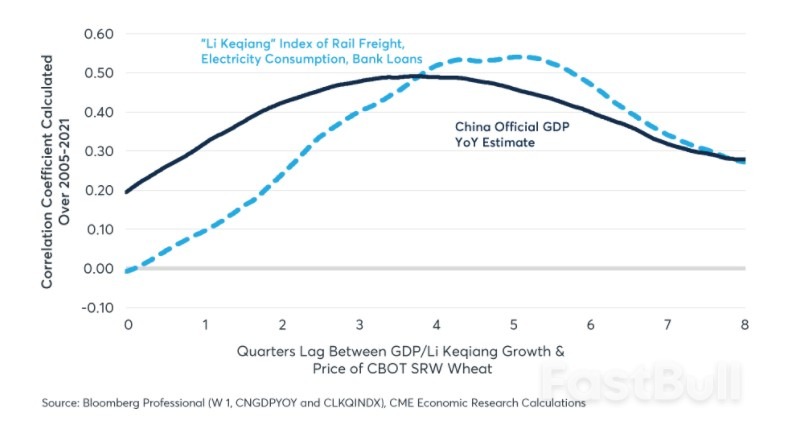
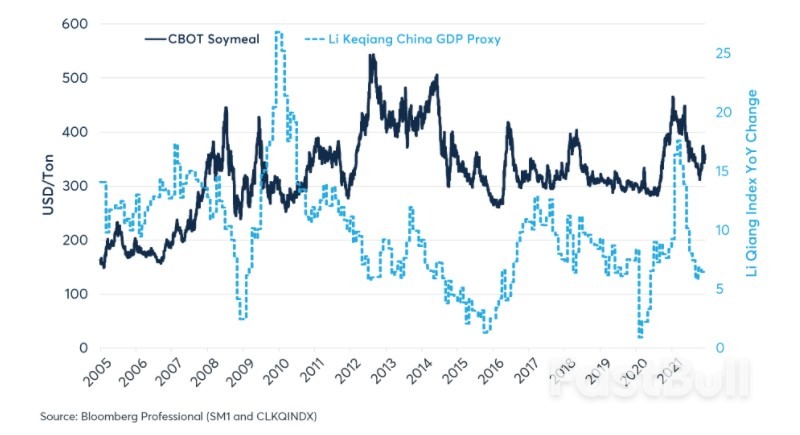
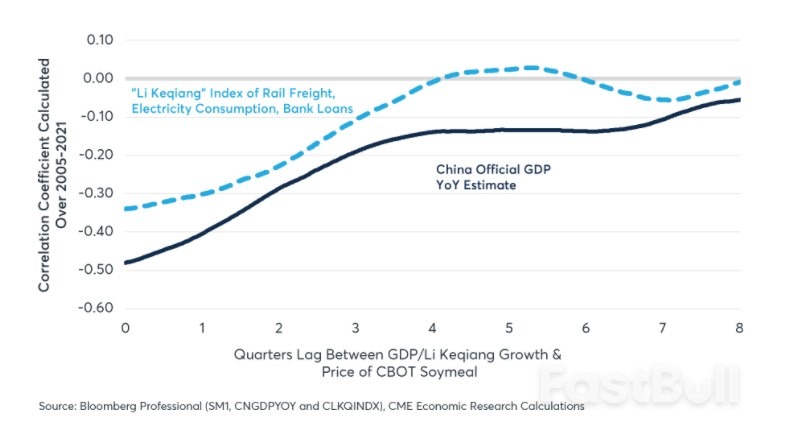
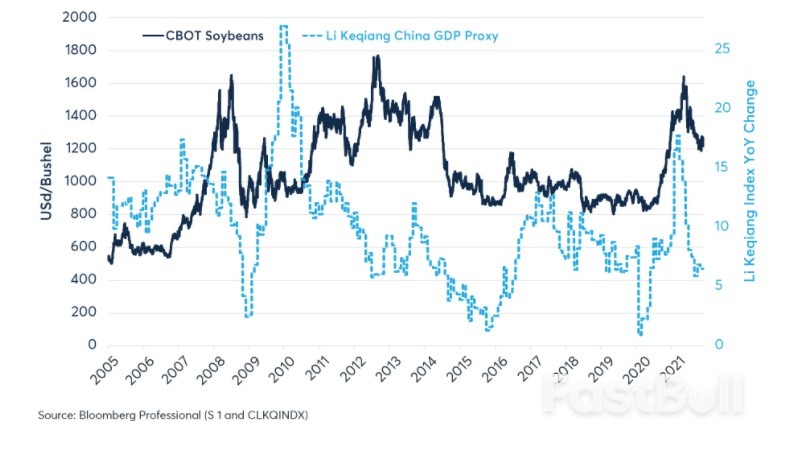
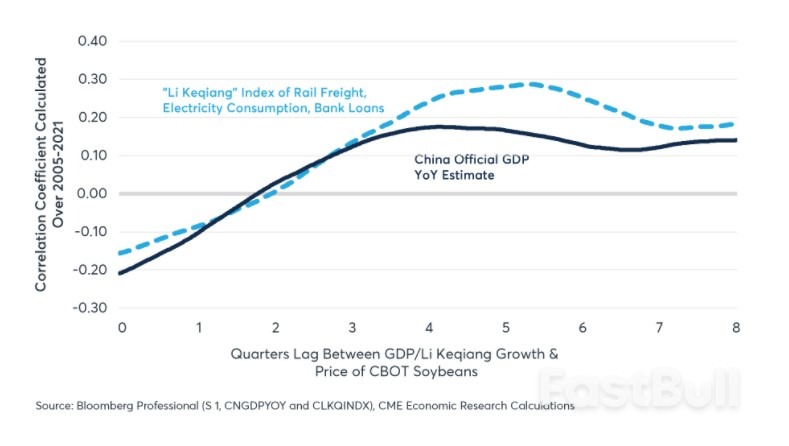
          A comparison of the Li Keqiang Index and commodity prices found that many commodity movements are highly correlated with the KCI movements. Industrials metals such as aluminium and copper show the strongest correlations, followed by crude oil, corn and wheat. Does this also mean that China's economic growth is slowing down and the corresponding demand for commodities will also decrease?

          Over the past 16 years, China' s "Li Keqiang" Index, has been highly correlated with the prices of many commodities including agricultural and energy products, and industrial metals. The pandemic period has been no exception. In fact, between 2005 and 2021, the index has consistently shown a more positive correlation with every major commodity than has China' s official GDP (Figure 1). This may be because it works especially well as a proxy for China' s manufacturing sector.

          Figure 1: Correlation between Commodities Prices and Li Keqiang Index

          The Li Keqiang Index includes only three components: rail freight volumes, electricity production, and bank loans.  The index dipped sharply in Q1 2020 amid China’s lockdown, corresponding to a sharp drop in the prices of most commodities.  It then rebounded to show year-on-year economic growth rates of as high as 17% by early 2021.  During this period, commodity prices surged with the prices of many goods rising 100% or more off their 2020 lows.  In recent months China’s growth has slowed sharply to around 5-6% and commodity markets have tended to see more sideways price action.
          Prior to the pandemic, the Li Keqiang Index showed a great deal more variability than China’s official GDP, which spent many years growing at an annualized pace of around 6.5-7.0% per year.  The Li Keqiang index showed much sharper slowdowns in 2009 and in 2014-16 than the official GDP did, while showing much stronger economic growth from 2010-12 and 2017-19 (Figure 2).  With a few exceptions like gold, commodity markets tended to follow what the Li Keqiang index was doing -  sometimes with a significant lag of up to one year or more.  

          Figure 2: China' s official GDP and The Li Keqiang Index

          Going into 2022, the index might continue to correlate highly with global commodity prices. China continues to consume 40%-70% of the world’ s industrial metals as well as close to one-fifth of the world’ s energy and one-sixth of the world’s food. The Li Keqiang index would likely detect any significant change in China’s pace of economic growth, and since the index is released monthly rather than quarterly, it might pick up those variations before it becomes apparent in China’ s official GDP.
          Going into 2022, the main downside risk for China is its property sector, where construction activity is slowing, and real estate prices have begun to decline. Balanced against this risk is easier monetary policy. At a time when many central banks have either begun to tighten policy, or appear potentially poised to do so soon, the People’ s Bank of China is actively easing monetary policy, having recently reduced its reserve requirement ratio for the second time this year (Figure 3). A lower reserve requirement ratio might boost the availability loans to China’ s corporations. Bank loans account for 40% of the index.

          Figure 3: Chinese Yuan and Monetary Policy

          Here is a quick look at how different commodities have responded to variations in the Li Keqiang Index in the past:
          Crude Oil: energy markets pay a great deal of attention to the swing producers of oil, but China may well be the swing consumer. Pre-pandemic oil consumption was fairly stable in Europe and the U.S., but it grew rapidly in China, especially during periods when China’ s economy was growing quickly. As such, it comes as little surprise that crude oil prices follow the Li Keqiang index, and sometimes with long lags. Peak correlation for oil comes 4-5 quarters after a change in the Li Keqiang index (Figure 4 and 5).

          Figure 4: WTI and YoY change in Li Keqiang Index

          Figure 5: Correlation between GDP & "Li Keqiang" Growth Rates and Price of NYMEX WTI

          Industrials metals: aluminum and copper show the strongest correlation to the Li Keqiang index. Unlike most other commodities, the metals have shown a strong contemporaneous correlation to changes in the Li Keqiang index as well as strong lagged correlations. That said, the correlation peaks at around one year (four quarters) for both metals (Figure 6-9).

          Figure 6: Aluminum and YoY change in Li Keqiang Index

          Figure 7: Correlation between GDP & "Li Keqiang" Growth Rates and Price of aluminum

          Figure 8: COMEX High Grade Copper and YoY change in Li Keqiang Index

          Figure 9: Correlation between GDP & "Li Keqiang" Growth Rates and Price of COMEX High Grade Copper 

          Precious metals: silver has a somewhat weaker but still positive correlation that peaks at around 5-6 quarters after a change in the Li Keqiang index. Silver prices correlate negatively with GDP. Meanwhile, gold is one of the few commodities that correlates negatively with the Li Keqiang index.
          Stronger Chinese economic growth may be good news for most commodities but, on balance, it tends not be good news for gold (Appendix figures 7-10). Silver’s positive correlation is probably best explained by the fact that it has many industrial uses while gold has relatively few. Around 65% of silver is used for some sort of industrial purpose compared to only around 5% for gold. Unlike other metals, the yellow metal is used overwhelmingly for investment purposes.

          Figure 10: COMEX Silver and YoY change in Li Keqiang Index

          Figure 11: Correlation between GDP & "Li Keqiang" Growth Rates and Price of COMEX Silver

          Figure 12: Gold and YoY change in Li Keqiang Index

          Figure 13: Correlation between GDP & "Li Keqiang" Growth Rates and Price of COMEX Gold

          Agricultural goods: corn, soybean oil and wheat demonstrate among the highest correlations with the Li Keqiang index and the correlation tends to peak five to six quarters after a move in the index –somewhat later than the peak correlation for metals and energy goods. Soymeal, like gold, tends to have a negative correlation with Li Keqiang. The difference is that corn, wheat and soybean oil can be used as biofuels and tend to correlate positively with crude oil prices. As such, they may be more heavily influenced by changes in the pace of China’s growth rate.
          By contrast, soybean meal is used primarily as animal feed and, like lean hog prices, shows little response to changes in the pace of Chinese growth. Finally, soybeans fall somewhere between bean oil, which is strongly correlated, and soymeal, which shows little correlation (Figure 14-23).

          Figure 14: CBTO Corn and YoY change in Li Keqiang Index

          Figure 15: Correlation between GDP & "Li Keqiang" Growth Rates and Price of CBTO Corn


          Figure 16: CBTO Soy Oil and YoY change in Li Keqiang Index

          Figure 17: Correlation between GDP & "Li Keqiang" Growth Rates and Price of CBTO Soy Oil

          Figure 18: CBTO Wheat and YoY change in Li Keqiang Index

          Figure 19: Correlation between GDP & "Li Keqiang" Growth Rates and Price of CBTO Wheat

          Figure 20: CBTO Soymeal and YoY change in Li Keqiang Index

          Figure 21: Correlation between GDP & "Li Keqiang" Growth Rates and Price of CBTO Soymeal  


          Figure 22: CBTO Soybean and YoY change in Li Keqiang Index

          Figure 23: Correlation between GDP & "Li Keqiang" Growth Rates and Price of CBTO Soybean

           Conclusion

          The bottom line is that variations in the pace of China’s growth rate have continued to reverberate through commodity markets, often with significant lags of one year of more.
          For the moment, many commodity markets may still be benefitting from the extraordinary rebound in China’s manufacturing sector in the second half of 2020 and the first half of 2021. The future of China’s manufacturing growth depends on which forces prove more powerful: booming demand for manufactured goods and an easier monetary policy or a sharp slowdown in the pace of growth in China’s real estate and construction sectors. Data from the second half of 2021 suggest that the pace of growth in China has slowed substantially and, if the past is any guide, this might suggest somewhat softer demand for many commodities in 2022.

          Reference: Erik Norland, Tracking Commodities With Li Keqiang Index, CME Group

          Risk Warnings and Disclaimers
          You understand and acknowledge that there is a high degree of risk involved in trading. Following any strategies or investment methods may lead to potential losses. The content on the site is provided by our contributors and analysts for information purposes only. You are solely responsible for determining whether any trading assets, securities, strategy, or any other product is suitable for investing based on your own investment objectives and financial situation.
          Add to Favorites
          Share
          FastBull
          Copyright © 2026 FastBull Ltd

          728 RM B 7/F GEE LOK IND BLDG NO 34 HUNG TO RD KWUN TONG KLN HONG KONG

          TelegramInstagramTwitterfacebooklinkedin
          App Store Google Play Google Play
          Products
          Charts

          Chats

          Q&A with Experts
          Screeners
          Economic Calendar
          Data
          Tools
          Membership
          Features
          Function
          Markets
          Copy Trading
          Latest Signals
          Contests
          24/7
          Analysis
          Education
          Company
          Careers
          About Us
          Contact Us
          Advertising
          Help Center
          Feedback
          User Agreement
          Privacy Policy
          Personal Information Protection Statement
          Business

          White Label

          Broker API

          Data API

          Web Plug-ins

          Poster Maker

          Affiliate Program

          Risk Disclosure

          The risk of loss in trading financial instruments such as stocks, FX, commodities, futures, bonds, ETFs and crypto can be substantial. You may sustain a total loss of the funds that you deposit with your broker. Therefore, you should carefully consider whether such trading is suitable for you in light of your circumstances and financial resources.

          No decision to invest should be made without thoroughly conducting due diligence by yourself or consulting with your financial advisors. Our web content might not suit you since we don't know your financial conditions and investment needs. Our financial information might have latency or contain inaccuracy, so you should be fully responsible for any of your trading and investment decisions. The company will not be responsible for your capital loss.

          Without getting permission from the website, you are not allowed to copy the website's graphics, texts, or trademarks. Intellectual property rights in the content or data incorporated into this website belong to its providers and exchange merchants.

          Not Logged In

          Log in to access more features

          Connect Broker
          Become a signal provider
          Help Center
          Customer Service
          Dark Mode
          Price Up/Down Colors

          Log In

          Sign Up

          Position
          Layout
          Fullscreen
          Default to Chart
          The chart page opens by default when you visit fastbull.com