


- WTI
- XAUUSD
- XAGUSD
- USDX


Markets
Analysis
User
24/7
Economic Calendar
Education
Data
- Names
- Latest
- Prev









Learn how to calculate inflation using the CPI formula, with step-by-step examples for monthly, annual, and cumulative inflation rates.
To calculate inflation, compare the Consumer Price Index (CPI) between two periods and convert the change into a percentage. This method shows how much overall consumer prices have risen or fallen. Below, you'll find the inflation formula, a step-by-step calculation, and examples you can apply to different time periods.
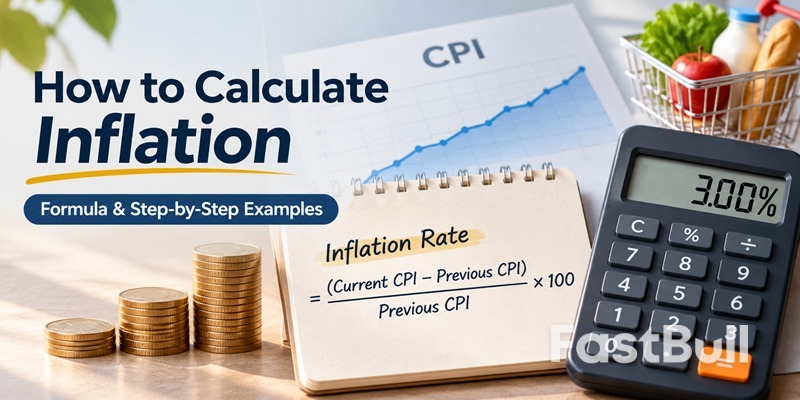
The standard way to calculate inflation is to measure the percentage change in the Consumer Price Index (CPI). The CPI tracks changes in the prices consumers pay for a basket of goods and services, including food, housing, transportation, and medical care.
Inflation Rate (%) = [(Current CPI − Previous CPI) ÷ Previous CPI] × 100
Here's what each part means:
The formula works for monthly, yearly, or longer periods. What changes is which CPI values you compare.
In the United States, the Bureau of Labor Statistics (BLS) publishes official CPI data. For measuring overall consumer inflation, the CPI for All Urban Consumers (CPI-U), All Items, is a commonly used benchmark.
Make sure both CPI values come from the same index series and use the same reference base. Otherwise, the calculation may be misleading.
Suppose you want to calculate how much consumer prices increased over one year. You can do it in three steps using two CPI values.
First, choose the period you want to measure and find the CPI at the beginning and end.
For example, suppose the following CPI values are available:
These are hypothetical values used to demonstrate the calculation, not actual BLS figures.
Because the two observations are exactly 12 months apart, the result will represent year-over-year inflation. Comparing January with January also avoids confusing a full-year change with a shorter period.
Now substitute the CPI values into the inflation formula.
Inflation Rate = [(309 − 300) ÷ 300] × 100
Calculate it in order:
Result: The annual inflation rate is 3%.
Notice that the CPI increased by 9 index points, but the inflation rate is 3%, not 9%. The percentage depends on the starting index value, which is why dividing by the previous CPI matters.
A 3% inflation rate means the overall price level measured by the CPI increased by 3% during the selected year.
For example, a representative basket of goods and services costing $100 at the beginning of the year would cost approximately $103 at the end, assuming its cost changed at the same rate as the CPI.
The sign of the result also matters:
One important distinction: if inflation falls from 5% to 3%, prices are generally still rising, just more slowly. Prices actually decline only when the inflation rate turns negative.
This calculation measures the change in the overall CPI basket, not the price increase of every individual product. Your personal expenses may rise faster or slower depending on what you buy.
The inflation formula stays the same whether you're measuring one month, one year, or several years. The difference is which CPI values you compare and how you interpret the result.
Monthly inflation compares the CPI with the previous month. For example, if the CPI rises from 300 in March to 301.2 in April:
Monthly Inflation = [(301.2 − 300) ÷ 300] × 100 = 0.4%
This means consumer prices increased by 0.4% in one month. Monthly CPI changes are commonly reported using seasonally adjusted data to reduce predictable seasonal fluctuations.
Annual inflation typically compares the CPI with the same month one year earlier.
For example, if the CPI increases from 300 in April 2025 to 309 in April 2026, the year-over-year inflation rate is 3%.
For official U.S. year-over-year comparisons, the BLS generally reports changes using non-seasonally adjusted CPI data.
These measurements answer different questions:
| Measurement | CPI Comparison | What It Shows |
|---|---|---|
| Monthly | April vs. March | Price changes over one month |
| Year-over-year | April 2026 vs. April 2025 | Price changes over 12 months |
| Cumulative | 2026 vs. 2021 | Total price changes over five years |
One distinction matters: a December-to-December inflation rate is not necessarily the same as the percentage change between two calendar years' average CPI values.
Cumulative inflation measures the total percentage increase in consumer prices between two dates, even if they are several years apart.
Cumulative Inflation = [(Ending CPI ÷ Starting CPI) − 1] × 100
Suppose the CPI increases from 300 to 330 over three years:
[(330 ÷ 300) − 1] × 100 = 10%
Consumer prices increased by 10% across the entire three-year period.
Don't simply add the individual annual inflation rates. Inflation compounds because each year's percentage change is calculated from the previous year's price level.
Annualized inflation converts a multi-year price increase into an equivalent average yearly rate. It's useful for comparing inflation across periods of different lengths.
Annualized Inflation = [(Ending CPI ÷ Starting CPI)^(1 ÷ Number of Years) − 1] × 100
Using the previous example, where prices rose 10% over three years:
[(330 ÷ 300)^(1 ÷ 3) − 1] × 100 = 3.23% per year
The cumulative inflation rate is 10%, while the annualized rate is approximately 3.23%. The annualized figure represents a constant compounded rate that would produce the same total increase, not necessarily the inflation rate recorded in each individual year.
Once you know the inflation rate, you can estimate how much prices may rise and how much purchasing power money may lose.
If you know an item's current price and assume a constant annual inflation rate, you can estimate its future cost.
Future Price = Current Price × (1 + Inflation Rate)^Years
Remember to convert the inflation rate into decimal form. For example, 3% becomes 0.03.
Suppose an item costs $100 today and inflation averages 3% annually for five years:
$100 × (1.03)^5 = $115.93
Under that assumption, an item costing $100 today would cost approximately $115.93 in five years.
This is a projection, not a guarantee. Actual inflation changes over time, and individual product prices rarely move at exactly the same rate as the overall CPI.
Inflation reduces purchasing power because the same amount of money buys fewer goods and services as prices increase.
To calculate the value of money after adjusting for inflation:
Inflation-Adjusted Value = Money Amount ÷ (1 + Inflation Rate)^Years
For example, if you hold $100 in cash and prices rise by 3% over one year:
$100 ÷ 1.03 = $97.09
Your $100 would have the purchasing power of approximately $97.09 in today's dollars. That represents a purchasing-power loss of about 2.91%, rather than exactly 3%.
The same principle applies to income. If your salary rises by 2% while inflation reaches 3%, your purchasing power falls slightly despite earning more dollars.
You don't always need to calculate inflation by hand. Online calculators can quickly estimate how the purchasing power of money has changed between two historical periods.
The BLS CPI Inflation Calculator is a useful option for U.S. inflation calculations.
To use it:
The calculator uses the CPI-U U.S. city average for all items, without seasonal adjustment. It measures historical changes in the purchasing power of the dollar rather than predicting future inflation.
When should you calculate inflation manually? Manual calculations are more useful when you need a specific monthly inflation rate, want to compare different CPI categories, or need to calculate cumulative and annualized inflation.
Whichever method you use, remember that CPI measures average consumer price changes. Your personal inflation rate can differ because your spending patterns may not match the CPI basket. Someone spending more on rent, for example, may experience different cost increases from someone who owns a home outright.
Calculating inflation starts with comparing CPI values and converting the difference into a percentage. The same approach works across different periods, while compounding helps calculate cumulative and annualized inflation. For historical U.S. dollar comparisons, the BLS calculator provides a convenient alternative to manual calculations.

728 RM B 7/F GEE LOK IND BLDG NO 34 HUNG TO RD KWUN TONG KLN HONG KONG


The risk of loss in trading financial instruments such as stocks, FX, commodities, futures, bonds, ETFs and crypto can be substantial. You may sustain a total loss of the funds that you deposit with your broker. Therefore, you should carefully consider whether such trading is suitable for you in light of your circumstances and financial resources.
No decision to invest should be made without thoroughly conducting due diligence by yourself or consulting with your financial advisors. Our web content might not suit you since we don't know your financial conditions and investment needs. Our financial information might have latency or contain inaccuracy, so you should be fully responsible for any of your trading and investment decisions. The company will not be responsible for your capital loss.
Without getting permission from the website, you are not allowed to copy the website's graphics, texts, or trademarks. Intellectual property rights in the content or data incorporated into this website belong to its providers and exchange merchants.
Not Logged In
Log in to access more features


Log In
Sign Up