- EURUSD
- XAUUSD
- XAGUSD
- WTI
- USDX
Markets
Analysis
User
24/7
Economic Calendar
Education
Data
- Names
- Latest
- Prev


Signal Accounts for Members
All Signal Accounts
All Contests


Fitch Ratings: Upgrades To Emerging Market Sovereign Ratings Will Outnumber Downgrades In 2026
The National Oilseed Processors Association (NOPA) Reported That U.S. Soybean Oil Stocks In June Were 1.501 Billion Pounds, Compared To Market Expectations Of 1.653 Billion Pounds And 1.735 Billion Pounds In May; U.S. Soybean Crush In June Was 214.34 Million Bushels, Compared To Market Expectations Of 203.989 Million Bushels And 208.785 Million Bushels In May
According To Axios: A Senior White House Official Said That There Are Currently No Plans For Trump To Meet With Netanyahu Next Week
Federal Reserve Chairman Warsh: We Need To Continue To Push For Improvements In The Efficiency Of The Federal Reserve System
Federal Reserve Chair Waller: I Greatly Appreciate The Structure Of The Federal Reserve Board And The Regional Federal Reserve Banks
Federal Reserve Chairman Warsh: I Really Like The Structure Of The Federal Reserve Board And The Regional Federal Reserve Banks
Federal Reserve Chairman Warsh: We Can See The Impact Of Data Centers On The Demand Side Of The Economy
Federal Reserve Chairman Warsh: If The Results Of AI Are Disappointing, Most Of The Capital Expenditures Related To AI Will Still Have Other Uses
Market News: EU Diplomats Say EU Envoys Failed To Reach An Agreement On The 21st Round Of Sanctions Against Russia
Central Bank Of Russia: The Risk Balance Is Tilting Further Toward Inflation, Taking Into Account Fiscal Stimulus And The Fuel Crisis
The Central Bank Of Russia Stated That While Price Growth Has Accelerated Significantly Due To Rising Fuel Prices, Persistent Inflationary Pressures Remain Below 2025 Levels
The Central Bank Of Russia: Economic Activity In The Second Quarter Was Higher Than In The First Quarter, Indicating That GDP Is Likely To Achieve Year-on-Year Growth

Euro Zone Industrial Output MoM (May)A:--
F: --
Euro Zone Total Reserve Assets (Jun)A:--
F: --
P: --
U.S. MBA Mortgage Application Activity Index WoWA:--
F: --
P: --
Brazil Services Growth YoY (May)A:--
F: --
P: --
Canada Manufacturing Unfilled Orders MoM (May)A:--
F: --
P: --
Canada Manufacturing New Orders MoM (May)A:--
F: --
P: --
Canada Wholesale Sales YoY (May)A:--
F: --
P: --
Canada Wholesale Inventory MoM (May)A:--
F: --
P: --
Canada Wholesale Inventory YoY (May)A:--
F: --
P: --
Canada Manufacturing Inventory MoM (May)A:--
F: --
P: --
U.S. Core PPI MoM (SA) (Jun)A:--
F: --
U.S. PPI YoY (Jun)A:--
F: --
U.S. PPI MoM (SA) (Jun)A:--
F: --
U.S. NY Fed Manufacturing Index (Jul)A:--
F: --
P: --
U.S. Core PPI YoY (Jun)A:--
F: --
Canada Wholesale Sales MoM (SA) (May)A:--
F: --
U.S. NY Fed Manufacturing Prices Received Index (Jul)A:--
F: --
P: --
U.S. NY Fed Manufacturing New Orders Index (Jul)A:--
F: --
P: --
U.S. NY Fed Manufacturing Employment Index (Jul)A:--
F: --
P: --
New York Federal Reserve President Williams delivered a speech.
Canada Overnight Target RateA:--
F: --
P: --
BOC Monetary Policy Report
Fed Chairman Powell delivers monetary policy testimony
U.S. EIA Weekly Crude Stocks ChangeA:--
F: --
P: --
U.S. EIA Weekly Cushing, Oklahoma Crude Oil Stocks ChangeA:--
F: --
P: --
U.S. EIA Weekly Crude Demand Projected by ProductionA:--
F: --
P: --
U.S. EIA Weekly Crude Oil Imports ChangesA:--
F: --
P: --
U.S. EIA Weekly Gasoline Stocks ChangeA:--
F: --
P: --
U.S. EIA Weekly Heating Oil Stock ChangesA:--
F: --
P: --
BOC Press Conference
South Korea Benchmark Interest Rate--
F: --
P: --
U.K. Monthly GDP 3M/3M Change (May)--
F: --
P: --
U.K. Manufacturing Output MoM (May)--
F: --
P: --
U.K. Industrial Output MoM (May)--
F: --
P: --
U.K. GDP MoM (May)--
F: --
P: --
U.K. GDP YoY (SA) (May)--
F: --
P: --
U.K. Trade Balance EU (SA) (May)--
F: --
P: --
U.K. Trade Balance Non-EU (SA) (May)--
F: --
P: --
U.K. Manufacturing Output YoY (May)--
F: --
P: --
U.K. Trade Balance (May)--
F: --
P: --
U.K. Construction Output MoM (SA) (May)--
F: --
P: --
U.K. Construction Output YoY (May)--
F: --
P: --
U.K. Trade Balance (SA) (May)--
F: --
P: --
U.K. Industrial Output YoY (May)--
F: --
P: --
Euro Zone Trade Balance (SA) (May)--
F: --
P: --
Euro Zone Trade Balance (Not SA) (May)--
F: --
P: --
Brazil Retail Sales MoM (May)--
F: --
P: --
Canada New Housing Starts (Jun)--
F: --
P: --
U.S. Philadelphia Fed Business Activity Index (SA) (Jul)--
F: --
P: --
U.S. Initial Jobless Claims 4-Week Avg. (SA)--
F: --
P: --
U.S. Weekly Initial Jobless Claims (SA)--
F: --
P: --
U.S. Retail Sales MoM (Jun)--
F: --
P: --
U.S. Weekly Continued Jobless Claims (SA)--
F: --
P: --
U.S. Core Retail Sales MoM (Jun)--
F: --
P: --
U.S. Retail Sales YoY (Jun)--
F: --
P: --
U.S. Retail Sales (Jun)--
F: --
P: --
U.S. Philadelphia Fed Manufacturing Employment Index (Jul)--
F: --
P: --
U.S. Core Retail Sales (Jun)--
F: --
P: --
U.S. Commercial Inventory MoM (May)--
F: --
P: --
U.S. Pending Home Sales Index MoM (SA) (Jun)--
F: --
P: --
U.S. NAHB Housing Market Index (Jul)--
F: --
P: --


No matching data
Over the past week, the Ethereum (ETH) market recorded a solid positive price performance, reaching as high as $3,600. Notably, the second-largest cryptocurrency, among many altcoins, is experiencing a strong bullish momentum as evidenced by price gains of 45.48% over the last month. Amid the present market euphoria, Dutch market analyst Gert Van Lagen has backed Ethereum’s chances for sustained price gain based on an Elliott wave analysis.
Ethereum To Complete Bull Market Cycle On High Note – Analyst
The Elliot wave theory is a technical framework used to predict price targets by identifying repetitive patterns in price movements driven by investor psychology. In an X post on July 18, Van Lagen explains that this price forecast framework indicates that Ethereum may be entering the final phase of its bull market cycle, with a potential price target of $10,000.
According to the analyst, the ETH bi-weekly trading chart suggests the cryptocurrency is completing a textbook five-wave cycle that began in 2022, with the fifth and final wave now unfolding in the form of an expanding diagonal.
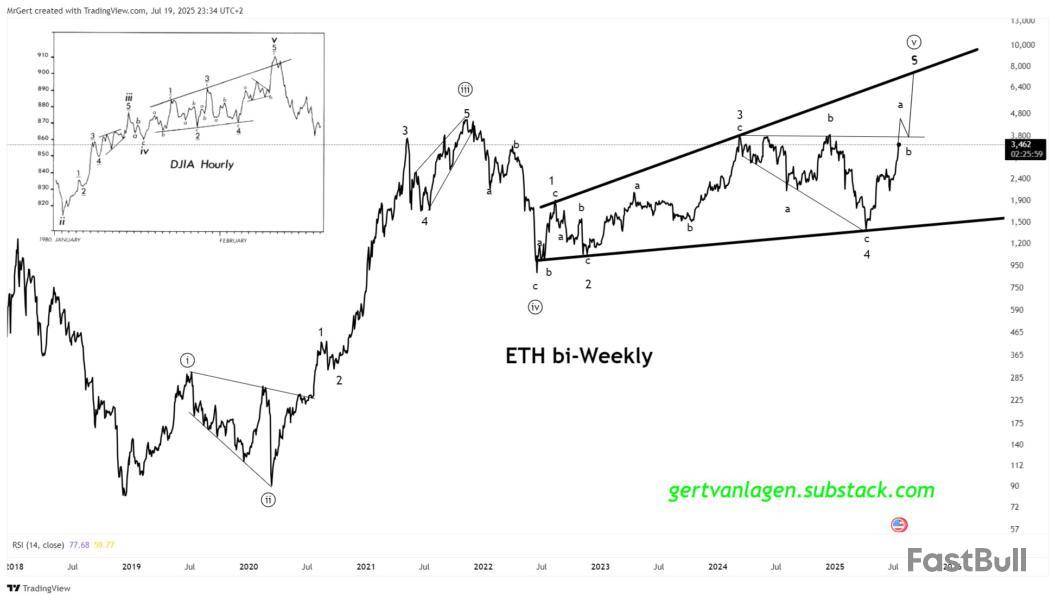
For context, the Elliot wave theory identifies a single price cycle in five waves, each composed of subwaves abc. As seen in the chart above, this includes the wave I marked by an initial impulse rally, followed by a sharp corrective Wave II as seen between 2022 and 2023. Wave III is defined by explosive momentum, pushing Ethereum to new highs, before entering a lengthy Wave IV consolidation characterized by a flat correction.
Finally, there is wave V, i.e., the current status of the market, which is usually a final price surge. After breaking out of the upper boundary of the Wave 3–4, Gert Lagen explains that Ethereum is about completing subwave a of wave V following its most recent price gains.
Therefore, investors should expect a brief pullback to retest the breakout zone, which would complete subwave ‘b’. After that, a blow-off rally forming subwave ‘c’ is on the cards, i.e., a price move that could push Ethereum to the $10,000 mark based on a broader Elliott wave analysis on the Ethereum bull market stretching from 2019 to date.
Ethereum Price Overview
At press time, Ethereum is trading at $3,657, posting gains of 1.79% over the past 24 hours and 21.8% over the last seven days. However, daily trading volume has dropped by 46.03%, signaling a potential weakening in the bullish momentum behind the current price surge. Following its most recent gain, the altcoin continues to retain its position as the second-largest cryptocurrency with a market cap of $441.14 billion and 11.1% market share.
The risk of loss in trading financial instruments such as stocks, FX, commodities, futures, bonds, ETFs and crypto can be substantial. You may sustain a total loss of the funds that you deposit with your broker. Therefore, you should carefully consider whether such trading is suitable for you in light of your circumstances and financial resources.
No decision to invest should be made without thoroughly conducting due diligence by yourself or consulting with your financial advisors. Our web content might not suit you since we don't know your financial conditions and investment needs. Our financial information might have latency or contain inaccuracy, so you should be fully responsible for any of your trading and investment decisions. The company will not be responsible for your capital loss.
Without getting permission from the website, you are not allowed to copy the website's graphics, texts, or trademarks. Intellectual property rights in the content or data incorporated into this website belong to its providers and exchange merchants.
Not Logged In
Log in to access more features
Log In
Sign Up