• Trade
  • Markets
  • Copy
  • Contests
  • News
  • 24/7
  • Calendar
  • Q&A
  • Chats
Trending
Screeners
SYMBOL
LAST
BID
ASK
HIGH
LOW
NET CHG.
%CHG.
SPREAD
SPX
S&P 500 Index
6870.39
6870.39
6870.39
6895.79
6858.28
+13.27
+ 0.19%
--
DJI
Dow Jones Industrial Average
47954.98
47954.98
47954.98
48133.54
47871.51
+104.05
+ 0.22%
--
IXIC
NASDAQ Composite Index
23578.12
23578.12
23578.12
23680.03
23506.00
+72.99
+ 0.31%
--
USDX
US Dollar Index
98.950
99.030
98.950
99.060
98.740
-0.030
-0.03%
--
EURUSD
Euro / US Dollar
1.16426
1.16443
1.16426
1.16715
1.16277
-0.00019
-0.02%
--
GBPUSD
Pound Sterling / US Dollar
1.33312
1.33342
1.33312
1.33622
1.33159
+0.00041
+ 0.03%
--
XAUUSD
Gold / US Dollar
4197.91
4197.91
4197.91
4259.16
4191.87
-9.26
-0.22%
--
WTI
Light Sweet Crude Oil
59.809
60.061
59.809
60.236
59.187
+0.426
+ 0.72%
--

Community Accounts

Signal Accounts
--
Profit Accounts
--
Loss Accounts
--
View More

Become a signal provider

Sell trading signals to earn additional income

View More

Guide to Copy Trading

Get started with ease and confidence

View More

Signal Accounts for Members

All Signal Accounts

Best Return
  • Best Return
  • Best P/L
  • Best MDD
Past 1W
  • Past 1W
  • Past 1M
  • Past 1Y

All Contests

  • All
  • Trump Updates
  • Recommend
  • Stocks
  • Cryptocurrencies
  • Central Banks
  • Featured News
Top News Only
Share

Israel Foreign Currency Reserves $231.425 Billion In November Versus$231.954 Billion In October -Bank Of Israel

Share

[Moodeng Surges Over 43% In The Last 24 Hours, With A Current Market Cap Of $104 Million.] December 7Th, According To Gmgn Market Data, The Solana-Based Meme Coin Moodeng Surged Over 43% In The Past 24 Hours, With A Market Capitalization Currently Standing At 104 Million USD

Share

Jerusalem-German Chancellor Merz: We Have Not Discussed A Visit To Germany By Israeli Prime Minister Benjamin Netanyahu, Not An Issue At The Moment

Share

Israeli Prime Minister Netanyahu: We're Close To The Second Phase Of Trump's Gaza Plan

Share

West Africa's ECOWAS Bloc: 'Strongly Condemns' Attempted Military Coup In Benin

Share

Israeli Prime Minister Netanyahu: Political Annexation Of The West Bank Remains A Subject Of Discussion

Share

Israeli Prime Minister Netanyahu: Sovereign Power Of Security From The Jordan River To The Mediterranean Will Always Remain In Israel's Hands

Share

Israeli Prime Minister Netanyahu: We Believe There Is A Path To A Workable Peace With Our Palestinian Neighbors

Share

Israeli Prime Minister Netanyahu: I Will Meet Trump This Month

Share

Egypt's Net Foreign Reserves Rise To $50.216 Billion In November From $50.071 Billion In October

Share

Uganda Opposition Candidate Says He Was Beaten By Security Forces

Share

Benin's Foreign Minister Bakari:Large Part Of The Army And National Guard Still Loyalist And Are Controlling The Situation

Share

Russian Defence Ministry: Russian Troops Complete Capture Of Rivne In Ukraine's Donetsk Region

Share

Russian Defence Ministry: Russian Troops Carried Out Group Strike Overnight On Ukraine's Transport Infrastructure Facilities, Fuel And Energy Complexes, And Long-Range Drone Complexes

Share

Russian Defence Ministry: Russian Forces Capture Kucherivka In Ukraine's Kharkiv Region

Share

US Envoy Kellogg Says Ukraine Peace Deal Is Really Close

Share

US Embassy In India- US Under Secretary Of State For Political Affairs Allison Hooker Will Visit New Delhi And Bengaluru, India, From December 7 To 11

Share

Japan Prime Minister Takaichi: To Respond Calmly And Resolutely To The Development

Share

UBS Plans To Cut Further 10000 Jobs By 2027, Swiss Newspaper Sonntagsblick Reports

Share

India Clean Energy Ministry: No Advisory Issued To Pause Or Halt New Clean Enegry Financing

TIME
ACT
FCST
PREV
Euro Zone Employment YoY (SA) (Q3)

A:--

F: --

P: --

Euro Zone GDP Final YoY (Q3)

A:--

F: --

P: --

Euro Zone GDP Final QoQ (Q3)

A:--

F: --

P: --

Euro Zone Employment Final QoQ (SA) (Q3)

A:--

F: --

P: --

Euro Zone Employment Final (SA) (Q3)

A:--

F: --

P: --
Brazil PPI MoM (Oct)

A:--

F: --

P: --

Mexico Consumer Confidence Index (Nov)

A:--

F: --

P: --

Canada Unemployment Rate (SA) (Nov)

A:--

F: --

P: --

Canada Labor Force Participation Rate (SA) (Nov)

A:--

F: --

P: --

Canada Employment (SA) (Nov)

A:--

F: --

P: --

Canada Part-Time Employment (SA) (Nov)

A:--

F: --

P: --

Canada Full-time Employment (SA) (Nov)

A:--

F: --

P: --

U.S. Personal Income MoM (Sept)

A:--

F: --

P: --

U.S. PCE Price Index YoY (SA) (Sept)

A:--

F: --

P: --

U.S. PCE Price Index MoM (Sept)

A:--

F: --

P: --

U.S. Personal Outlays MoM (SA) (Sept)

A:--

F: --

P: --

U.S. Core PCE Price Index MoM (Sept)

A:--

F: --

P: --

U.S. Core PCE Price Index YoY (Sept)

A:--

F: --

P: --

U.S. UMich 5-Year-Ahead Inflation Expectations Prelim YoY (Dec)

A:--

F: --

P: --

U.S. Real Personal Consumption Expenditures MoM (Sept)

A:--

F: --

P: --

U.S. 5-10 Year-Ahead Inflation Expectations (Dec)

A:--

F: --

P: --

U.S. UMich Current Economic Conditions Index Prelim (Dec)

A:--

F: --

P: --

U.S. UMich Consumer Sentiment Index Prelim (Dec)

A:--

F: --

P: --

U.S. UMich 1-Year-Ahead Inflation Expectations Prelim (Dec)

A:--

F: --

P: --

U.S. UMich Consumer Expectations Index Prelim (Dec)

A:--

F: --

P: --

U.S. Weekly Total Rig Count

A:--

F: --

P: --

U.S. Weekly Total Oil Rig Count

A:--

F: --

P: --

U.S. Unit Labor Cost Prelim (SA) (Q3)

--

F: --

P: --

U.S. Consumer Credit (SA) (Oct)

A:--

F: --

P: --

China, Mainland Foreign Exchange Reserves (Nov)

A:--

F: --

P: --

China, Mainland Exports YoY (USD) (Nov)

--

F: --

P: --

China, Mainland Imports YoY (CNH) (Nov)

--

F: --

P: --

China, Mainland Imports YoY (USD) (Nov)

--

F: --

P: --

China, Mainland Imports (CNH) (Nov)

--

F: --

P: --

China, Mainland Trade Balance (CNH) (Nov)

--

F: --

P: --

China, Mainland Exports (Nov)

--

F: --

P: --

Japan Wages MoM (Oct)

--

F: --

P: --

Japan Trade Balance (Oct)

--

F: --

P: --

Japan Nominal GDP Revised QoQ (Q3)

--

F: --

P: --

Japan Trade Balance (Customs Data) (SA) (Oct)

--

F: --

P: --

Japan GDP Annualized QoQ Revised (Q3)

--

F: --

P: --
China, Mainland Exports YoY (CNH) (Nov)

--

F: --

P: --

China, Mainland Trade Balance (USD) (Nov)

--

F: --

P: --

Germany Industrial Output MoM (SA) (Oct)

--

F: --

P: --

Euro Zone Sentix Investor Confidence Index (Dec)

--

F: --

P: --

Canada Leading Index MoM (Nov)

--

F: --

P: --

Canada National Economic Confidence Index

--

F: --

P: --

U.S. Dallas Fed PCE Price Index YoY (Sept)

--

F: --

P: --

U.S. 3-Year Note Auction Yield

--

F: --

P: --

U.K. BRC Overall Retail Sales YoY (Nov)

--

F: --

P: --

U.K. BRC Like-For-Like Retail Sales YoY (Nov)

--

F: --

P: --

Australia Overnight (Borrowing) Key Rate

--

F: --

P: --

RBA Rate Statement
RBA Press Conference
Germany Exports MoM (SA) (Oct)

--

F: --

P: --

U.S. NFIB Small Business Optimism Index (SA) (Nov)

--

F: --

P: --

Mexico Core CPI YoY (Nov)

--

F: --

P: --

Mexico 12-Month Inflation (CPI) (Nov)

--

F: --

P: --

Mexico PPI YoY (Nov)

--

F: --

P: --

Mexico CPI YoY (Nov)

--

F: --

P: --

U.S. Weekly Redbook Index YoY

--

F: --

P: --

Q&A with Experts
    • All
    • Chatrooms
    • Groups
    • Friends
    Connecting
    .
    .
    .
    Type here...
    Add Symbol or Code

      No matching data

      All
      Trump Updates
      Recommend
      Stocks
      Cryptocurrencies
      Central Banks
      Featured News
      • All
      • Russia-Ukraine Conflict
      • Middle East Flashpoint
      • All
      • Russia-Ukraine Conflict
      • Middle East Flashpoint
      Search
      Products

      Charts Free Forever

      Chats Q&A with Experts
      Screeners Economic Calendar Data Tools
      Membership Features
      Data Warehouse Market Trends Institutional Data Policy Rates Macro

      Market Trends

      Market Sentiment Order Book Forex Correlations

      Top Indicators

      Charts Free Forever
      Markets

      News

      News Analysis 24/7 Columns Education
      From Institutions From Analysts
      Topics Columnists

      Latest Views

      Latest Views

      Trending Topics

      Top Columnists

      Latest Update

      Signals

      Copy Rankings Latest Signals Become a signal provider AI Rating
      Contests
      Brokers

      Overview Brokers Assessment Rankings Regulators News Claims
      Broker listing Forex Brokers Comparison Tool Live Spread Comparison Scam
      Q&A Complaint Scam Alert Videos Tips to Detect Scam
      More

      Business
      Events
      Careers About Us Advertising Help Center

      White Label

      Data API

      Web Plug-ins

      Affiliate Program

      Awards Institution Evaluation IB Seminar Salon Event Exhibition
      Vietnam Thailand Singapore Dubai
      Fans Party Investment Sharing Session
      FastBull Summit BrokersView Expo
      Recent Searches
        Top Searches
          Markets
          News
          Analysis
          User
          24/7
          Economic Calendar
          Education
          Data
          • Names
          • Latest
          • Prev

          View All

          No data

          Scan to Download

          Faster Charts, Chat Faster!

          Download App
          English
          • English
          • Español
          • العربية
          • Bahasa Indonesia
          • Bahasa Melayu
          • Tiếng Việt
          • ภาษาไทย
          • Français
          • Italiano
          • Türkçe
          • Русский язык
          • 简中
          • 繁中
          Open Account
          Search
          Products
          Charts Free Forever
          Markets
          News
          Signals

          Copy Rankings Latest Signals Become a signal provider AI Rating
          Contests
          Brokers

          Overview Brokers Assessment Rankings Regulators News Claims
          Broker listing Forex Brokers Comparison Tool Live Spread Comparison Scam
          Q&A Complaint Scam Alert Videos Tips to Detect Scam
          More

          Business
          Events
          Careers About Us Advertising Help Center

          White Label

          Data API

          Web Plug-ins

          Affiliate Program

          Awards Institution Evaluation IB Seminar Salon Event Exhibition
          Vietnam Thailand Singapore Dubai
          Fans Party Investment Sharing Session
          FastBull Summit BrokersView Expo

          “Easiest Bear Market Ever” Says Crypto Expert as Bitcoin Falls to Six-Month Low

          Coinpedia
          Momentum / Tether
          -0.94%
          Sei / USD Coin
          +1.33%
          DoubleZero / Tether
          +0.56%
          Sei / Tether
          +0.78%
          Allora / USD Coin
          +6.35%

          Crypto markets are going through a rough patch in recent weeks. Bitcoin has dropped below the crucial $100,000 level, touching its lowest point in six months and altcoins have also recorded heavy losses. 

          Sentiment is tense and volatility is rising, but not everyone agrees that the industry is in a true bear market. 

          Some point to the massive October 10 liquidation event, shrinking spot demand, and slowing stablecoin liquidity as signs of an extremely bearish phase. Others believe that this is still “the easiest bear market” they have ever seen. Here’s why. 

          Analysts Say This Is Not a Real Bear Market

          Dragonfly Capital’s Managing Partner Haseeb Kerem says that the current market downturn is far from a true bear market. He notes that the industry has already endured far more severe stress, most notably in 2022, when major collapses hit one after another like Luna, 3AC, FTX, Genesis, BlockFi, Axie, and NFTs. 

          Several banks collapsed, stablecoins lost their pegs, and regulators increased their oversight of the sector. He notes how the previous administration took an aggressive stance toward almost every major crypto company. 

          Haseeb >|<
          @hosseeb

          TBH this is the easiest bear market I've ever seen.

          Seems like most of you have forgotten what 2022 was like. Luna collapsing, then 3AC, then FTX, then Genesis, BlockFi, Axie, NFTs–pretty much everything felt like a house of cards.

          And then after all that stuff collapsed, the… https://t.co/DUwOZCBG3K

          Nov 14, 2025

          Fundamentals Remain Strong

          However, today’s scenario looks very different. “Compared to that? This is breezy,” he says. Although prices have pulled back, he notes that the underlying fundamentals remain strong and the crypto ecosystem is “working”. 

          Some users argue that the recent market events like the “largest liquidation event in crypto history,” revealed weaknesses in the market’s infrastructure and exposed how much liquidity is tied up in loops. 

          Kerem disagrees, explaining that the event appeared large because crypto prices are much higher today and because reporting is more complete than in past years. 

          Another user questioned why anyone would join a market where prices can crash 99% in a minute. Kerem notes that the crypto industry has already survived far more extreme situations than a few altcoins getting wiped out.

          The End of Bear Phase?

          Adding to this perspective, Bitwise CEO Hunter Horsley says that the familiar “four-year cycle” no longer reflects how the crypto market actually works.

          With the launch of Bitcoin ETFs and the arrival of the new Trump administration, the entire market structure has shifted, with new market players, new dynamics and reasons behind why people buy or sell crypto.

          According to Horsley, crypto may have already been in a quiet bear phase for nearly six months now and almost through it. “The setup for crypto right now has never been stronger,” he says. 

          He has also said that the current developments in crypto may be the most bullish the industry has seen in a decade.

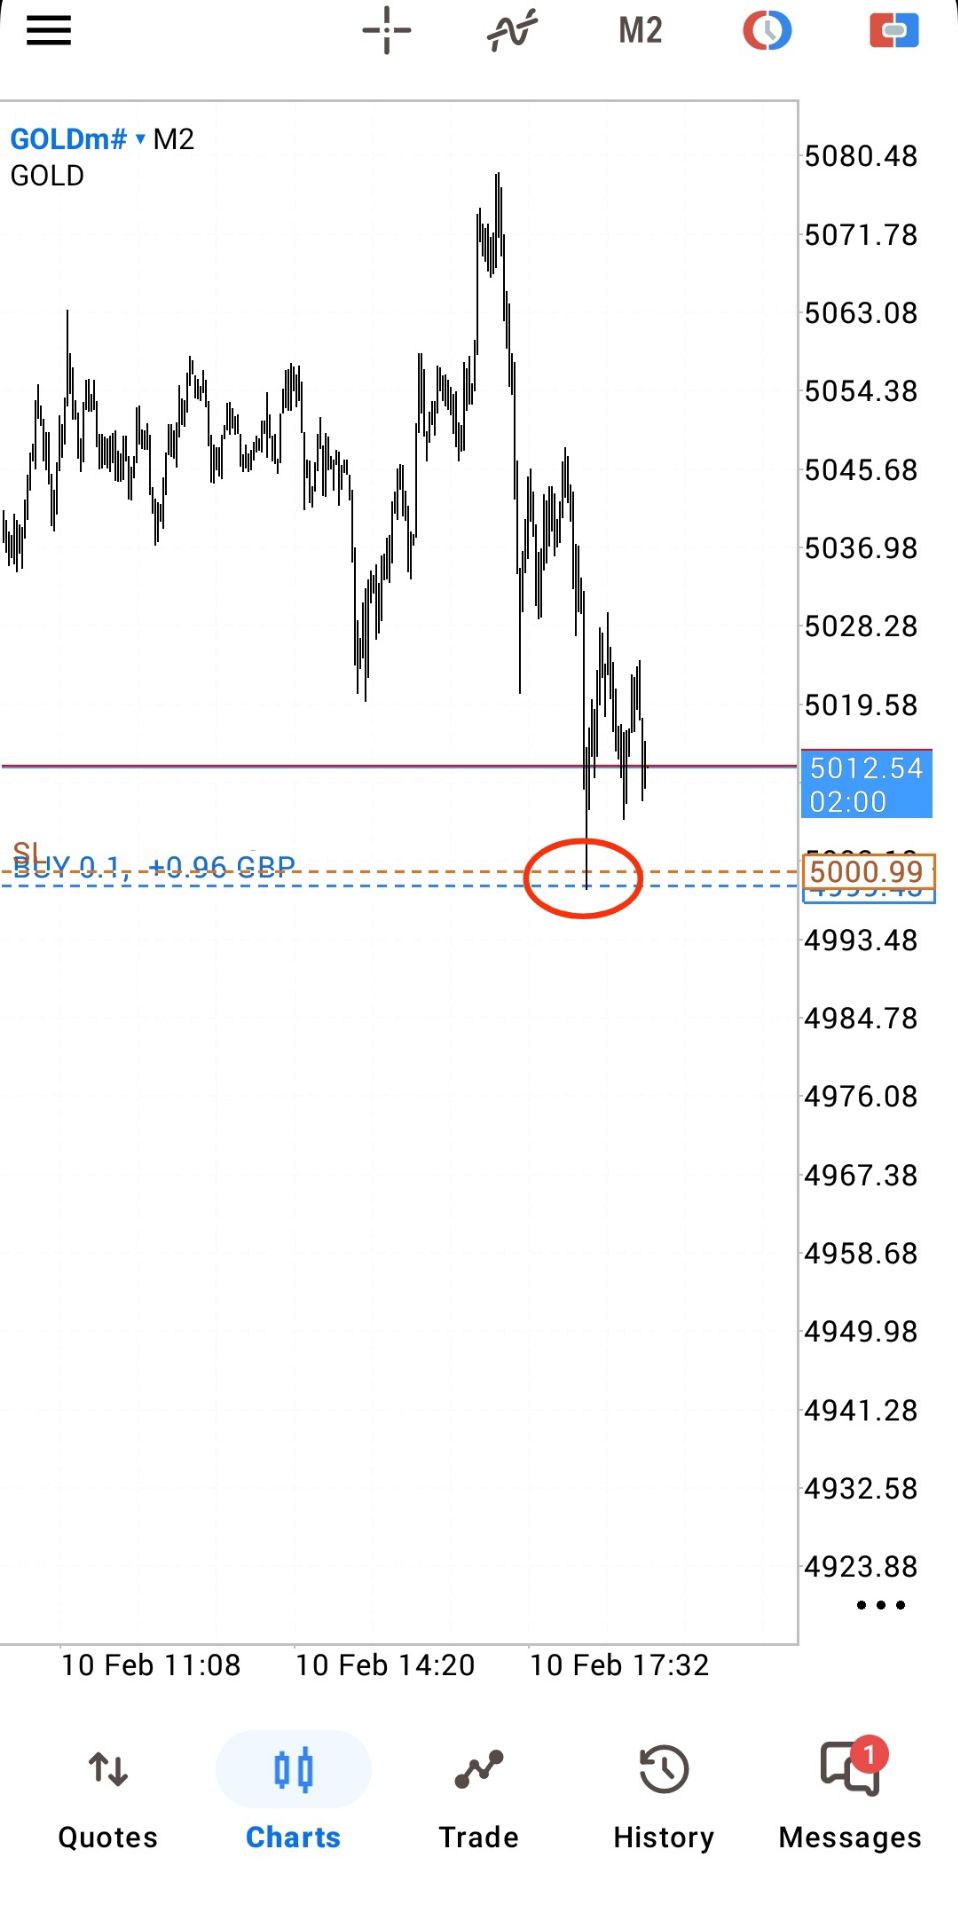
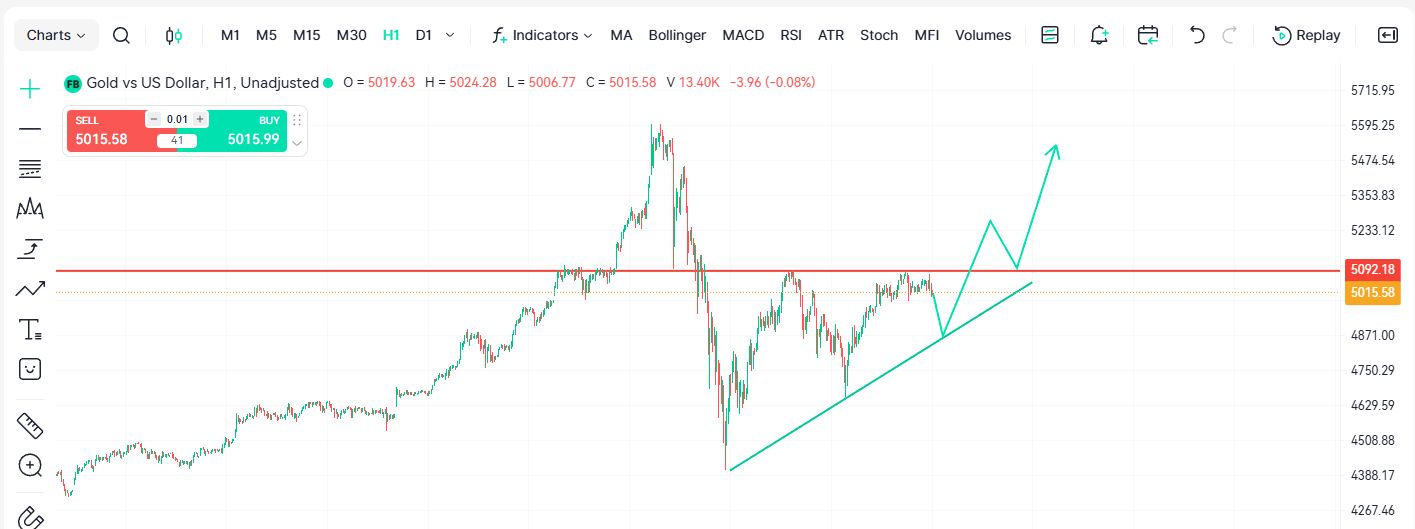
          Bitcoin is currently trading at $96,902, down over 6% in the past 24 hours. While the volatility remains high, the broader crypto market appears far more resilient than in past downturns.

          FAQs

          Is the current crypto downturn a real bear market?

          Many analysts say no. They view this pullback as a mild correction compared to past crises, with the industry’s core systems still functioning well.

          What caused the recent spike in crypto volatility?

          A massive liquidation event and lower spot demand sparked sharp swings, but these shocks are seen as normal in a maturing market.

          How long could this crypto bear phase last?

          Some analysts believe we’re already near the end of a quiet six-month bear phase, with conditions setting up for a stronger recovery ahead.

          Risk Warnings and Disclaimers
          You understand and acknowledge that there is a high degree of risk involved in trading. Following any strategies or investment methods may lead to potential losses. The content on the site is provided by our contributors and analysts for information purposes only. You are solely responsible for determining whether any trading assets, securities, strategy, or any other product is suitable for investing based on your own investment objectives and financial situation.
          Add to Favorites
          Share

          '$1 Million BTC' Advocate Mow Points to Bear Trap Setup as Bitcoin Loses $100,000

          U.Today
          Momentum / Tether
          -0.94%
          Sei / USD Coin
          +1.33%
          DoubleZero / Tether
          +0.56%
          Sei / Tether
          +0.78%
          Allora / USD Coin
          +6.35%

          Bitcoin has been in a slump over the last three days, losing about 10% of its market value as the main cryptocurrency fell from around $108,000 to about $97,000. The market went down fast, hitting key short-term levels and pushing out positions that had been untouched since October.

          Samson Mow, the face of the ongoing $1 million Bitcoin debate, dismissed the whole decline with one comment, calling it an "obvious bear trap."

          Glassnode recorded the largest realized-loss print of the quarter during the drop, when coins in the 3-6 month age band moved and roughly $600 million were lost within one hour. This cohort usually reflects holders who are not highly reactive, so seeing them exit in size signals that frayed nerves finally broke. 

          Samson Mow
          @Excellion

          What an obvious bear trap.

          Nov 13, 2025

          The Bitcoin price is behaving in a similar way. When it fell to $97,000, it was snapped up straight away by the spot markets once the forced liquidation waves had passed. Most of the pressure came from overextended positions rather than widespread distribution. 

          Cleanup

          Derivatives desks pointed to three concentration zones — around $101,000, $99,500 and $97,800 — where old longs were wiped out. Once those pockets were cleared, the tape no longer showed the aggressive follow-through that you would normally see with a deeper unwinding.

          When you put it all together, the mix of local capitulation, liquidation-driven flow and fast spot response makes it look like the move was more of a cleanup than a structural break.

          That is the background behind Mow's comment, and it keeps the focus on how Bitcoin is doing around the $97,000 mark now that forced selling has passed.

          Risk Warnings and Disclaimers
          You understand and acknowledge that there is a high degree of risk involved in trading. Following any strategies or investment methods may lead to potential losses. The content on the site is provided by our contributors and analysts for information purposes only. You are solely responsible for determining whether any trading assets, securities, strategy, or any other product is suitable for investing based on your own investment objectives and financial situation.
          Add to Favorites
          Share

          Analysts Liken Stress Levels to FTX Era as Crypto Liquidations Exceed $1.1 Billion

          Beincrypto
          Momentum / Tether
          -0.94%
          Sei / USD Coin
          +1.33%
          DoubleZero / Tether
          +0.56%
          Sei / Tether
          +0.78%
          Allora / USD Coin
          +6.35%

          The cryptocurrency market faced $1.1 billion in liquidations over 24 hours on November 14, 2025, with $968 million from long positions.

          More than 246,000 traders were forced out, triggering fresh comparisons with the darkest period of the 2022 FTX collapse.

          Liquidation Wave Hits Major Crypto Exchanges

          During the recent 24-hour period, $1.1 billion in positions were liquidated, with long positions suffering $973 million in losses compared to $131.37 million for shorts.

          The largest single liquidation was a $44.29 million BTC-USDT position on HTX. In the four-hour window, Hyperliquid saw $134.16 million in long liquidations, with Bybit close behind at $122.57 million.

          Liquidations occur when exchanges close leveraged trades due to insufficient margin. High leverage leads to automatic closures when markets turn sharply, especially during periods of volatility.

          A heavy tilt toward long liquidations suggests many traders were optimistic about the price direction when the market reversed.

          Against this backdrop, sentiment has dipped to lows reminiscent of the immediate aftermath following FTX’s November 2022 collapse.

          Despite its impact, this incident does not rank among the ten largest recorded. The record stood at $19.16 billion in October 2025, following the announcement of a US-China tariff.

          Meanwhile, Bitcoin technical indicators highlight warning signs, prompting debate about whether this signals the start of a new bear market or represents a sharp correction.

          Sentiment Plummets to FTX-Era Lows

          Market analyst Negentropic drew sharp comparisons to the 2022 FTX crisis when evaluating the current outlook. Bitcoin’s Relative Strength Index (RSI) now sits in massively oversold territory, a condition not seen since 2022.

          For the first time in three years, the pioneer crypto has also dropped below its lower volatility band, signaling severe market stress.

          The FTX collapse in November 2022 marked a watershed moment for the crypto industry, erasing billions in market value. News about Alameda Research’s finances and Binance CEO Changpeng Zhao’s move to liquidate FTT holdings sparked a bank run and ultimately led to FTX’s bankruptcy, resulting in a drastic drop in Bitcoin’s price as confidence vanished.

          This comparison highlights not just price drops, but also deep uncertainty among market participants. Lower liquidity across exchanges, waning engagement from experienced builders, and fast changing narratives mirror the turmoil after the 2022 failures of Luna, Three Arrows Capital, FTX, Genesis, and BlockFi.

          Experts Offer Diverging Market Outlooks

          Despite negative sentiment, not every analyst sees the situation as catastrophic. CryptoQuant CEO Ki Young Ju outlined a key threshold for confirming a bear market.

          In his view, Bitcoin holders from the past 6 to 12 months have a cost basis near $94,000. Unless pricing falls below this level, the bear cycle is not confirmed.

          This view adds nuance to the bear market debate. The $94,000 support is both a psychological and technical floor for many holders. Unless that breaks, analysts say the current weakness might simply be a correction within a broader bullish period.

          Meanwhile, Haseeb Qureshi of DragonFly Capital offered a contrasting perspective, arguing the market is not facing 2022-level systemic failures.

          Unlike that period of cascading exchange collapses, bank failures, and stablecoin depeggings, Qureshi points out that now, losses are coming mainly from falling prices.

          Divergent expert opinions reflect the market’s uncertainty. While indicators and sentiment show distress, the industry’s core infrastructure is holding stronger than during previous crises.

          Risk Warnings and Disclaimers
          You understand and acknowledge that there is a high degree of risk involved in trading. Following any strategies or investment methods may lead to potential losses. The content on the site is provided by our contributors and analysts for information purposes only. You are solely responsible for determining whether any trading assets, securities, strategy, or any other product is suitable for investing based on your own investment objectives and financial situation.
          Add to Favorites
          Share

          Bitcoin Maximalism Is Fading As Top Altcoins Like PEPENODE Rise

          NewsBTC
          Momentum / Tether
          -0.94%
          Sei / USD Coin
          +1.33%
          DoubleZero / Tether
          +0.56%
          Sei / Tether
          +0.78%
          Allora / USD Coin
          +6.35%

          What to Know:

          • Bitcoin’s ETF-driven evolution into digital gold is softening strict maximalism and encouraging more diversified crypto portfolios.
          • Capital is rotating into top altcoins with real narratives, especially in infrastructure, AI and DePIN rather than pure speculation.
          • PEPENODE mixes meme culture with gamified virtual mining and multi token rewards to keep holders engaged.

          For most of crypto’s history the script was simple: own Bitcoin, ignore everything else. That mindset is fading. Bitcoin now behaves more like digital gold, while the real experimentation (and much of the upside) is shifting to newer chains and app layers.

          Spot Bitcoin ETFs accelerated that shift. Many veteran holders in the US are moving coins from self custody into ETF wrappers to gain tax advantages and easier reporting without giving up long term $BTC exposure.

          Yes, OG whales definitely aren’t selling their Bitcoin for nothing – they’re going the ETF way.

          On chain, that unlocks fresh capital that no longer needs to sit idle. Instead of chasing random memes, that capital is rotating into infrastructure and narrative rich plays.

          High throughput networks like Avalanche, DePIN platforms such as Peaq and experimental designs like Kaspa’s blockDAG are drawing serious research time from investors who once swore they would never touch an altcoin. In this more mature market, Bitcoin can remain the macro anchor, while the upside shifts toward the top altcoins that pair clear stories with working products and lean tokenomics. Meme coins still matter, but they now need actual hooks.

          PEPENODE ($PEPENODE) tries to be one of those hooks. It blends Pepe style culture with a mine to earn model that turns virtual mining into a browser based strategy game.

          With more than $2.1M already raised at a presale price of $0.0011454 and 605% staking rewards, it gives rotated Bitcoin profits a defined, higher risk lane.

          PEPENODE’s Mine-To-Earn Model And Presale In One Snapshot

          PEPENODE ($PEPENODE) starts from a basic problem – most crypto presales and staking pools are passive: you buy, you lock, you wait, and attention fades long before launch.

          The project’s whitepaper instead describes a virtual mining simulator. After TGE, holders will build a server room inside a web app by buying Miner Nodes and upgrading Facilities with $PEPENODE.

          A dashboard tracks simulated hashrate, energy use and rewards so it feels like running a mining farm without hardware, noise or power bills.

          PEPENODE also plugs into existing meme liquidity instead of ignoring it. Leaderboards and bonus pools aim to pay rewards not only in $PEPENODE but also in some of the best meme coins such as $PEPE and $FARTCOIN.

          One active position can become exposure to several assets, which appeals to traders who prefer to keep their stack working instead of parked in a single token.

          On the funding side, the presale runs as a community first public sale with no private rounds or insider allocations. Pricing began around $0.001 and sits at $0.0011454 in the current stage, with $ETH, $BNB, $USDT and card payments accepted.Here’s how to buy PEPENODE now.

          Early staking yields at 605% are live alongside the raise and are designed to step down as more tokens are locked, encouraging commitment rather than quick flips.

          Our $PEPENODE price prediction sees a potential high near $0.0031 in 2025, with a 2026 range between roughly $0.0022 and $0.0077 if the game ships on time and user numbers grow.

          From a presale level around $0.0011454, that translates into indicative moves of about 2.7x at the first target and up to roughly 6.7x at the top of the 2026 band.

          For investors who now hold Bitcoin exposure through ETFs and want a defined risk sleeve for growth, PEPENODE offers a narrative that lines up with the wider rotation into utility driven altcoins and interactive on chain products.

          Consider PepeNode when shaping your next altcoin sleeve.

          This article is informational only, not financial advice; cryptocurrencies are highly volatile and can lead to full loss of invested capital.

          Authored by Elena Bistreanu, NewsBTC – https://www.newsbtc.com/news/bitcoin-maximalism-fading-top-altcoins-pepenode-rise

          Risk Warnings and Disclaimers
          You understand and acknowledge that there is a high degree of risk involved in trading. Following any strategies or investment methods may lead to potential losses. The content on the site is provided by our contributors and analysts for information purposes only. You are solely responsible for determining whether any trading assets, securities, strategy, or any other product is suitable for investing based on your own investment objectives and financial situation.
          Add to Favorites
          Share

          The Descending Channel That Can Trigger A Bitcoin Price Crash To $88,000

          NewsBTC
          Momentum / Tether
          -0.94%
          Allora / USD Coin
          +6.35%
          Allora / Tether
          +6.43%
          Hyperliquid / USD Coin
          -2.57%
          Momentum / USD Coin
          -0.22%

          Over the last few weeks, analysts have been predicting that the Bitcoin price could crash again after the initial October 10 crash. This is because of the weakening market trends that have shown that Bitcoin is still favoring a downtrend at this point. Crypto analyst Lixing_Gan on the TradingView website also shares this view, with the appearance of a descending trend pattern that suggests that the Bitcoin price is more likely to fall than rise.

          Bitcoin Price At Risk Of Major Crash Below $90,000

          So far, the Bitcoin price has been able to maintain its hold above the psychological level of $100,000, despite bears briefly pushing the price below this level. It has been trading in a tight range of $101,000 to $105,000 during this time, but with no notable momentum that could push its price higher. This tight range, unfortunately, plays into the descending pattern that maps a path downward.

          According to the crypto analyst’s chart, the descending pattern was formed at the start of October, well before the historic 10/10 crash. This means that the bearish trend had begun much earlier, and the resultant crash was only in response to bullish positions weakening across the board.

          This was triggered by massive sell-offs, mainly among whales and holders that have held onto their BTC for a notable amount of time. Over the last few months, these long-term holders have sold off more than 390,000 BTC, triggering billions of dollars in selling pressure. Given this, it is no surprise that the Bitcoin price broke down the way it did at the start of October.

          These sell-offs from the long-term holders, though, the crypto analyst believes, are a distribution phase. As they sell off their holdings to newer investors, the cost basis for each Bitcoin begins to rise, increasing the likelihood that buyers will hold for longer.

          Looking at the descending trendline from here, technical analysis suggests that the Bitcoin price is still testing the upper bound of the trendline. As the analyst explains, this upper bound happens to coincide with $106,500, which has been a major resistance for the cryptocurrency.

          In addition to the resistance above $106,000, the Bitcoin Ichimoku cloud also shows a rise in bearish pressure. This means that the $100,000 psychological level is still at risk, and if it breaks, then the current decline could deepen.

          The targets for this Bitcoin price crash lie well below the $90,000 level. The first major support is at $93,000, but a break below here could extend the decline to as low as $88,000 before the bulls find their footing again.

          Risk Warnings and Disclaimers
          You understand and acknowledge that there is a high degree of risk involved in trading. Following any strategies or investment methods may lead to potential losses. The content on the site is provided by our contributors and analysts for information purposes only. You are solely responsible for determining whether any trading assets, securities, strategy, or any other product is suitable for investing based on your own investment objectives and financial situation.
          Add to Favorites
          Share

          Crypto Market Crash: Why Bitcoin and Altcoins are Dropping Today?

          Coinpedia
          Momentum / Tether
          -0.94%
          Sei / USD Coin
          +1.33%
          DoubleZero / Tether
          +0.56%
          Sei / Tether
          +0.78%
          Allora / USD Coin
          +6.35%

          The crypto market is deep in correction mode, with the global market cap falling to a six-month low near $3.27 trillion. Both Bitcoin and Ethereum have retreated sharply, dropping 23% and 36% from their all-time highs. Sentiment has turned fearful across the market, with the Crypto Fear & Greed Index plunging to 15, reflecting rising anxiety among traders.

          Bitcoin has now fallen back to levels last seen in June 2025, marking one of its toughest Novembers in recent years as the price slid from its October peak to the mid-$90,000 range.

          Why Bitcoin Is Falling

          Popular online theories about whales moving coins, governments dumping Bitcoin, or critics like Paul Krugman sparking panic don’t match the on-chain or market data. Even slowing ETF inflows fail to explain the severity of the crash.

          Instead, the primary pressure comes from a sudden macroeconomic shift. The latest U.S. inflation report came in hotter than expected, sharply reducing the chances of a December Federal Reserve rate cut. With financial conditions tightening, risk assets, including tech stocks and crypto, began to unwind. Weakness in the AI sector added to the stress, turning a gradual decline into a broad market pullback.

          Leverage Wipeouts and Traditional Market Stress

          The downturn intensified as over-leveraged positions in the crypto market were rapidly liquidated. This cascade of forced liquidations pushed Bitcoin lower at high speed, adding fuel to an already tense environment.

          Traditional markets also showed signs of strain. SoftBank’s unexpected sale of its entire Nvidia stake shocked tech investors, while the collapse of two subprime hedge funds drew comparisons to early 2007. Altcoin Daily analyst highlighted how these cross-market fears spilled into crypto, deepening the decline.

          Options Expiry Adds More Pressure

          Today’s expiration of .7 billion in Bitcoin and Ethereum options has injected even more volatility. Put volume has surged, signaling that traders are positioning for further downside. With Bitcoin’s max pain level much higher than current prices, many traders are betting on a drop below $95,000.

          Ethereum is witnessing similar bearish positioning, with expectations building for a move under $3,000.

          Despite the turmoil, analysts emphasize that Bitcoin historically moves in sharp cycles. Michael Saylor reinforced this view, noting that Bitcoin often reaches new highs, corrects heavily, and then rebounds stronger. Volatility isn’t a flaw, it’s part of Bitcoin’s long-term growth pattern.

          Altcoins Deep in Red

          As Bitcoin leads the decline, major altcoins such as XRP, BNB, SOL, ADA, and ZEC have fallen 5–12% in the past 24 hours. Meme coins like DOGE, SHIB, and PEPE have also erased earlier gains, with PEPE down 80% this year.

          With analysts eyeing potential Bitcoin support near $94,000, many traders expect more downside in the broader altcoin market as well.

          Risk Warnings and Disclaimers
          You understand and acknowledge that there is a high degree of risk involved in trading. Following any strategies or investment methods may lead to potential losses. The content on the site is provided by our contributors and analysts for information purposes only. You are solely responsible for determining whether any trading assets, securities, strategy, or any other product is suitable for investing based on your own investment objectives and financial situation.
          Add to Favorites
          Share

          Why is XRP Price Down? The Real Reason Behind the Drop Despite the XRP ETF Launch

          Coinpedia
          Momentum / Tether
          -0.94%
          Allora / USD Coin
          +6.35%
          Allora / Tether
          +6.43%
          Hyperliquid / USD Coin
          -2.57%
          Momentum / USD Coin
          -0.22%

          The launch of the first spot XRP ETF was expected to bring a strong boost to the market, but instead, XRP has slipped into another round of losses. The token fell more than 7% in a single day, dropping from the $2.50 zone and sliding toward $2.20 as broader market pressure continues to weigh down sentiment. 

          For many holders, the big question is simple, why is XRP falling even after such a historic launch?

          Unexpected XRP ETF Debut

          Crypto analyst Nick Crypto Crusader explained that the price drop has less to do with XRP and more to do with the overall market. Bitcoin is still selling off sharply, pulling down most altcoins with it. During such periods, even positive news struggles to lift prices.

          Still, the debut of Canary Capital’s spot XRP ETF (XRPC) shocked many analysts. The fund opened with over $58 million in first-day trading volume, the strongest ETF launch of the year. 

          Senior ETF analysts had expected around $17 million, yet that estimate was crushed within the first 30 minutes of trading.

          Crusader noted that while the inflows were impressive, they remain small compared to XRP’s massive market cap. It will take far larger inflows to influence spot prices meaningfully.

          Real ETF Buying Hasn’t Started Yet

          Another key point he highlighted is that ETF launches rarely show instant price reactions. Even Bitcoin dipped in January 2024 when its spot ETFs went live. The bigger moves came later, once institutional buying settled in.

          Crusader also added that Canary Capital still needs a few days to purchase the XRP required to back the ETF. 

          This means the real buying pressure from the fund hasn’t even started yet, something that could reduce supply once inflows scale up.

          XRP Faces Major Breakdown Warning

          XRP tried to push higher above $2.50, but, much like Bitcoin and Ethereum, it couldn’t maintain the momentum. The price quickly reversed and fell below $2.30, dropping nearly 9% as the entire market turned red.

          Meanwhile, trader ChartNerd noted that XRP recently broke down from a descending triangle, losing the $2.70 support in late October. This move pushed the token into the $2.00–$2.20 support zone.

          For XRP to recover, it must break above $2.40. If it fails, the price could slide again, with key support levels at $1.80 and $1.50.

          Risk Warnings and Disclaimers
          You understand and acknowledge that there is a high degree of risk involved in trading. Following any strategies or investment methods may lead to potential losses. The content on the site is provided by our contributors and analysts for information purposes only. You are solely responsible for determining whether any trading assets, securities, strategy, or any other product is suitable for investing based on your own investment objectives and financial situation.
          Add to Favorites
          Share
          FastBull
          Copyright © 2025 FastBull Ltd

          728 RM B 7/F GEE LOK IND BLDG NO 34 HUNG TO RD KWUN TONG KLN HONG KONG

          TelegramInstagramTwitterfacebooklinkedin
          App Store Google Play Google Play
          Products
          Charts

          Chats

          Q&A with Experts
          Screeners
          Economic Calendar
          Data
          Tools
          Membership
          Features
          Function
          Markets
          Copy Trading
          Latest Signals
          Contests
          News
          Analysis
          24/7
          Columns
          Education
          Company
          Careers
          About Us
          Contact Us
          Advertising
          Help Center
          Feedback
          User Agreement
          Privacy Policy
          Business

          White Label

          Data API

          Web Plug-ins

          Poster Maker

          Affiliate Program

          Risk Disclosure

          The risk of loss in trading financial instruments such as stocks, FX, commodities, futures, bonds, ETFs and crypto can be substantial. You may sustain a total loss of the funds that you deposit with your broker. Therefore, you should carefully consider whether such trading is suitable for you in light of your circumstances and financial resources.

          No decision to invest should be made without thoroughly conducting due diligence by yourself or consulting with your financial advisors. Our web content might not suit you since we don't know your financial conditions and investment needs. Our financial information might have latency or contain inaccuracy, so you should be fully responsible for any of your trading and investment decisions. The company will not be responsible for your capital loss.

          Without getting permission from the website, you are not allowed to copy the website's graphics, texts, or trademarks. Intellectual property rights in the content or data incorporated into this website belong to its providers and exchange merchants.

          Not Logged In

          Log in to access more features

          FastBull Membership

          Not yet

          Purchase

          Become a signal provider
          Help Center
          Customer Service
          Dark Mode
          Price Up/Down Colors

          Log In

          Sign Up

          Position
          Layout
          Fullscreen
          Default to Chart
          The chart page opens by default when you visit fastbull.com