• Trade
  • Markets
  • Copy
  • Contests
  • 24/7
  • Calendar
  • Q&A
  • Chats
Screeners
SYMBOL
LAST
BID
ASK
HIGH
LOW
NET CHG.
%CHG.
SPREAD
SOURCE
SPX
S&P 500 Index
7580.07
7580.07
7580.07
7637.48
7527.56
-140.32
-1.82%
--
--
DJI
Dow Jones Industrial Average
51770.31
51770.31
51770.31
52383.90
51563.76
-572.25
-1.09%
--
--
IXIC
NASDAQ Composite Index
25436.99
25436.99
25436.99
25673.00
25177.33
-747.73
-2.86%
--
--
USDX
US Dollar Index
101.807
101.807
101.887
101.913
101.400
+0.104
+ 0.10%
--
--
EURUSD
Euro / US Dollar
1.11561
1.11561
1.11616
1.12144
1.11353
-0.00230
-0.21%
--
--
GBPUSD
Pound Sterling / US Dollar
1.33860
1.33860
1.33926
1.34334
1.33702
+0.00095
+ 0.07%
--
--
XAUUSD
Gold / US Dollar
3875.25
3875.25
3875.25
4026.26
3869.98
-145.70
-3.62%
--
--
WTI
Light Sweet Crude Oil
102.072
102.072
102.102
104.014
101.471
+0.099
+ 0.10%
--
--

Community Accounts

Signal Accounts
--
Profit Accounts
--
Loss Accounts
--
View More

Become a signal provider

Sell trading signals to earn additional income

View More

Guide to Copy Trading

Get started with ease and confidence

View More

Signal Accounts for Members

All Signal Accounts

Best Return
  • Best Return
  • Best P/L
  • Best MDD
Past 1W
  • Past 1W
  • Past 1M
  • Past 1Y

All Contests

  • All
  • Recommend
  • Stocks
  • Cryptocurrencies
  • Central Banks
  • Trump Updates
  • Featured News
Top News Only
Share

Trump's Proposed Asylum For Bolsonaro Has Escalated Tensions Between The US And Brazil, Prompting Rubio And The Brazilian Foreign Minister To Agree To Meet Again

Share

Lavrov: Putin Is Willing To Meet With Zelensky, Provided That The Latter Travels To Moscow

Share

Japan, The United States, And South Korea Signed A Memorandum Of Understanding On Arctic And Pacific Cooperation, And Will Establish A Working Group To Promote Maritime And Economic Cooperation

Share

The Mayor Of Kyiv: The City's Water Supply Has Been Disrupted Following The Russian Airstrikes

Share

China's National Bureau Of Statistics: The PMI For High-tech Manufacturing And Equipment Manufacturing In October Were 51.3% And 50.6%, Respectively

Share

Brent Crude Oil Fell Below $113 In Grey Market Trading, Down More Than 0.7% On The Day

Share

China's National Bureau Of Statistics: The Non-manufacturing Business Activity Index Was 49.7% In October

Share

US Natural Gas Futures Fell Below $2.90 In The Grey Market, Down 0.7% On The Day

Share

China's National Bureau Of Statistics Reported That The Manufacturing Purchasing Managers' Index (PMI) Was 49.3% In October, Down 0.8 Percentage Points From The Previous Month, Indicating A Slight Decline In Manufacturing Activity. By Enterprise Size, The PMI For Large Enterprises Was 50.2%, Down 0.4 Percentage Points From The Previous Month, But Still Above The Critical Point; The PMIs For Medium-sized And Small Enterprises Were 48.4% And 47.5% Respectively, Down 1.3 And 1.4 Percentage Points From The Previous Month, And Below The Critical Point

Share

China's National Bureau Of Statistics: The Manufacturing Purchasing Managers' Index (PMI) Was 49.3% In October

Share

The Polish Prime Minister Is Accused Of Staging A Coup Against The Constitutional Court

Share

Russian Foreign Minister Sergey Lavrov Stated That Poland's Accession To The G20 Would Not Benefit The Group, And Moscow Believes There Is No Need For The Group To Add Another European Voice

Share

A U.S. Judge Ruled That The Justice Department Is Prohibited From Threatening Election Workers

Share

The Trump Administration Plans To Repatriate Some Afghan Migrants To Afghanistan

Share

Trump: Fannie Mae And Freddie Mac Will Invest $40 Billion In Florida Mortgage Lending

Share

Trump: We Have Built The Most Secure Border In American History. In The Past 17 Months, Not A Single Illegal Immigrant Has Been Allowed To Enter The United States. We Have Achieved The Largest Decline In Violent Crime On Record, And The Murder Rate Has Fallen To Its Lowest Level Since 1900, Or In 125 Years

Share

Trump: Provide $40 Million In Federal Funding For The Apprenticeship Program

Share

In Florida, Trump Announced That Johnson & Johnson Will Invest $1 Billion To Build A Large Distribution Center In Jacksonville. Blue Origin Will Invest $600 Million To Expand Its Rocket Campus At Cape Canaveral Space Port. Williams International Will Invest Another $1 Billion To Produce Aircraft Engines In Ocala County, Florida

Share

The CEO Of Alaska Airlines Group Stated That Fuel Prices And Geopolitical Challenges Have Placed Significant Financial Pressure On The Business

Share

Alaska Airlines Will Lay Off Approximately 200 Non-contract Workers; The Layoffs Will Not Affect Frontline Non-management Positions

TIME
ACT
FCST
PREV
IMPACT
Turkey Economic Sentiment Indicator (Oct)

A:--

F: --

P: --

XAUUSD
  • XAUUSD
  • XAGUSD
  • WTI
  • USDX
U.K. Nationwide House Price Index MoM (Oct)

A:--

F: --

P: --
GBPUSD
  • GBPUSD
  • XAUUSD
  • XAGUSD
  • WTI
  • USDX
U.K. Nationwide House Price Index YoY (Oct)

A:--

F: --

P: --

GBPUSD
  • GBPUSD
  • XAUUSD
  • XAGUSD
  • WTI
  • USDX
France PPI MoM (Sept)

A:--

F: --

P: --

EURUSD
  • EURUSD
  • XAUUSD
  • XAGUSD
  • WTI
  • USDX
Germany Unemployment Rate (SA) (Oct)

A:--

F: --

P: --

EURUSD
  • EURUSD
  • XAUUSD
  • XAGUSD
  • WTI
  • USDX
Germany GDP Prelim YoY (Working-day Adjusted) (Q3)

A:--

F: --

P: --

EURUSD
  • EURUSD
  • XAUUSD
  • XAGUSD
  • WTI
  • USDX
Germany GDP Prelim YoY (Not SA) (Q3)

A:--

F: --

P: --

EURUSD
  • EURUSD
  • XAUUSD
  • XAGUSD
  • WTI
  • USDX
Germany GDP Prelim QoQ (SA) (Q3)

A:--

F: --

P: --

EURUSD
  • EURUSD
  • XAUUSD
  • XAGUSD
  • WTI
  • USDX
Italy GDP Prelim YoY (SA) (Q3)

A:--

F: --

P: --

EURUSD
  • EURUSD
  • XAUUSD
  • XAGUSD
  • WTI
  • USDX
Euro Zone GDP Prelim QoQ (SA) (Q3)

A:--

F: --

P: --

EURUSD
  • EURUSD
  • XAUUSD
  • XAGUSD
  • WTI
  • USDX
Italy HICP Prelim YoY (Oct)

A:--

F: --

P: --

EURUSD
  • EURUSD
  • XAUUSD
  • XAGUSD
  • WTI
  • USDX
Euro Zone Unemployment Rate (Sept)

A:--

F: --

P: --
EURUSD
  • EURUSD
  • XAUUSD
  • XAGUSD
  • WTI
  • USDX
Euro Zone GDP Prelim YoY (SA) (Q3)

A:--

F: --

P: --

EURUSD
  • EURUSD
  • XAUUSD
  • XAGUSD
  • WTI
  • USDX
Italy Average Hourly Wage MoM (Sept)

A:--

F: --

P: --

EURUSD
  • EURUSD
  • XAUUSD
  • XAGUSD
  • WTI
  • USDX
Brazil Unemployment Rate (Sept)

A:--

F: --

P: --

XAUUSD
  • XAUUSD
  • XAGUSD
  • WTI
  • USDX
South Africa Trade Balance (Sept)

A:--

F: --

P: --

XAUUSD
  • XAUUSD
  • XAGUSD
  • WTI
  • USDX
U.S. Labor Cost Index QoQ (Q3)

A:--

F: --

P: --

XAUUSD
  • XAUUSD
  • XAGUSD
  • WTI
  • USDX
Canada GDP YoY (Aug)

A:--

F: --

P: --

WTI
  • WTI
  • XAUUSD
  • XAGUSD
  • USDX
Canada GDP MoM (SA) (Aug)

A:--

F: --

P: --

WTI
  • WTI
  • XAUUSD
  • XAGUSD
  • USDX
Germany HICP Prelim MoM (Oct)

A:--

F: --

P: --

EURUSD
  • EURUSD
  • XAUUSD
  • XAGUSD
  • WTI
  • USDX
Germany HICP Prelim YoY (Oct)

A:--

F: --

P: --

EURUSD
  • EURUSD
  • XAUUSD
  • XAGUSD
  • WTI
  • USDX
Germany CPI Final MoM (Oct)

A:--

F: --

P: --

EURUSD
  • EURUSD
  • XAUUSD
  • XAGUSD
  • WTI
  • USDX
Germany GDP Final QoQ (SA) (Oct)

A:--

F: --

P: --

U.S. Chicago PMI (Oct)

A:--

F: --

P: --

USDX
  • USDX
  • XAUUSD
  • XAGUSD
  • WTI
Canada Federal Government Budget Balance (Aug)

A:--

F: --

P: --

USDCAD
  • USDCAD
  • XAUUSD
  • XAGUSD
  • WTI
  • USDX
U.S. Weekly Total Rig Count

A:--

F: --

P: --

WTI
  • WTI
  • XAUUSD
  • XAGUSD
  • USDX
U.S. Weekly Total Oil Rig Count

A:--

F: --

P: --

WTI
  • WTI
  • XAUUSD
  • XAGUSD
  • USDX
China, Mainland NBS Non-manufacturing PMI (Oct)

A:--

F: --

P: --

XAUUSD
  • XAUUSD
  • XAGUSD
  • WTI
  • USDX
China, Mainland NBS Manufacturing PMI (Oct)

A:--

F: --

P: --

XAUUSD
  • XAUUSD
  • XAGUSD
  • WTI
  • USDX
China, Mainland Composite PMI (Oct)

A:--

F: --

P: --

XAUUSD
  • XAUUSD
  • XAGUSD
  • WTI
  • USDX
South Korea Trade Balance Prelim (Oct)

--

F: --

P: --
Indonesia IHS Markit Manufacturing PMI (Oct)

--

F: --

P: --

Australia Building Permits YoY (SA) (Sept)

--

F: --

P: --

Australia Building Permits MoM (SA) (Sept)

--

F: --

P: --

Australia Private Building Permits MoM (SA) (Sept)

--

F: --

P: --

Japan Manufacturing PMI Final (Oct)

--

F: --

P: --

South Korea IHS Markit Manufacturing PMI (SA) (Oct)

--

F: --

P: --

China, Mainland Caixin Manufacturing PMI (SA) (Oct)

--

F: --

P: --

Indonesia Inflation Rate YoY (Oct)

--

F: --

P: --

Indonesia Trade Balance (Sept)

--

F: --

P: --

Indonesia Core Inflation YoY (Oct)

--

F: --

P: --

India HSBC Manufacturing PMI Final (Oct)

--

F: --

P: --

Australia Commodity Price YoY (Oct)

--

F: --

P: --

Russia IHS Markit Manufacturing PMI (Oct)

--

F: --

P: --

Germany Actual Retail Sales MoM (Sept)

--

F: --

P: --

Turkey Manufacturing PMI (Oct)

--

F: --

P: --

Italy Manufacturing PMI (SA) (Oct)

--

F: --

P: --

South Africa Manufacturing PMI (Oct)

--

F: --

P: --

Euro Zone Manufacturing PMI Final (Oct)

--

F: --

P: --

U.K. Manufacturing PMI Prelim (Oct)

--

F: --

P: --

Canada National Economic Confidence Index

--

F: --

P: --

Canada Manufacturing PMI (SA) (Oct)

--

F: --

P: --

U.S. IHS Markit Manufacturing PMI Final (Oct)

--

F: --

P: --

U.S. ISM Inventories Index (Oct)

--

F: --

P: --

U.S. Construction Spending MoM (Sept)

--

F: --

P: --

U.S. ISM Output Index (Oct)

--

F: --

P: --

U.S. ISM Manufacturing Employment Index (Oct)

--

F: --

P: --

U.S. ISM Manufacturing PMI (Oct)

--

F: --

P: --

Q&A with Experts
    • All
    • Chatrooms
    • Groups
    • Friends
    Skylark flag
    5948210
    adolesencia
    @Visitor5948210hello visitor 👋 how are you doing today hope you are good welcome
    2460732 flag
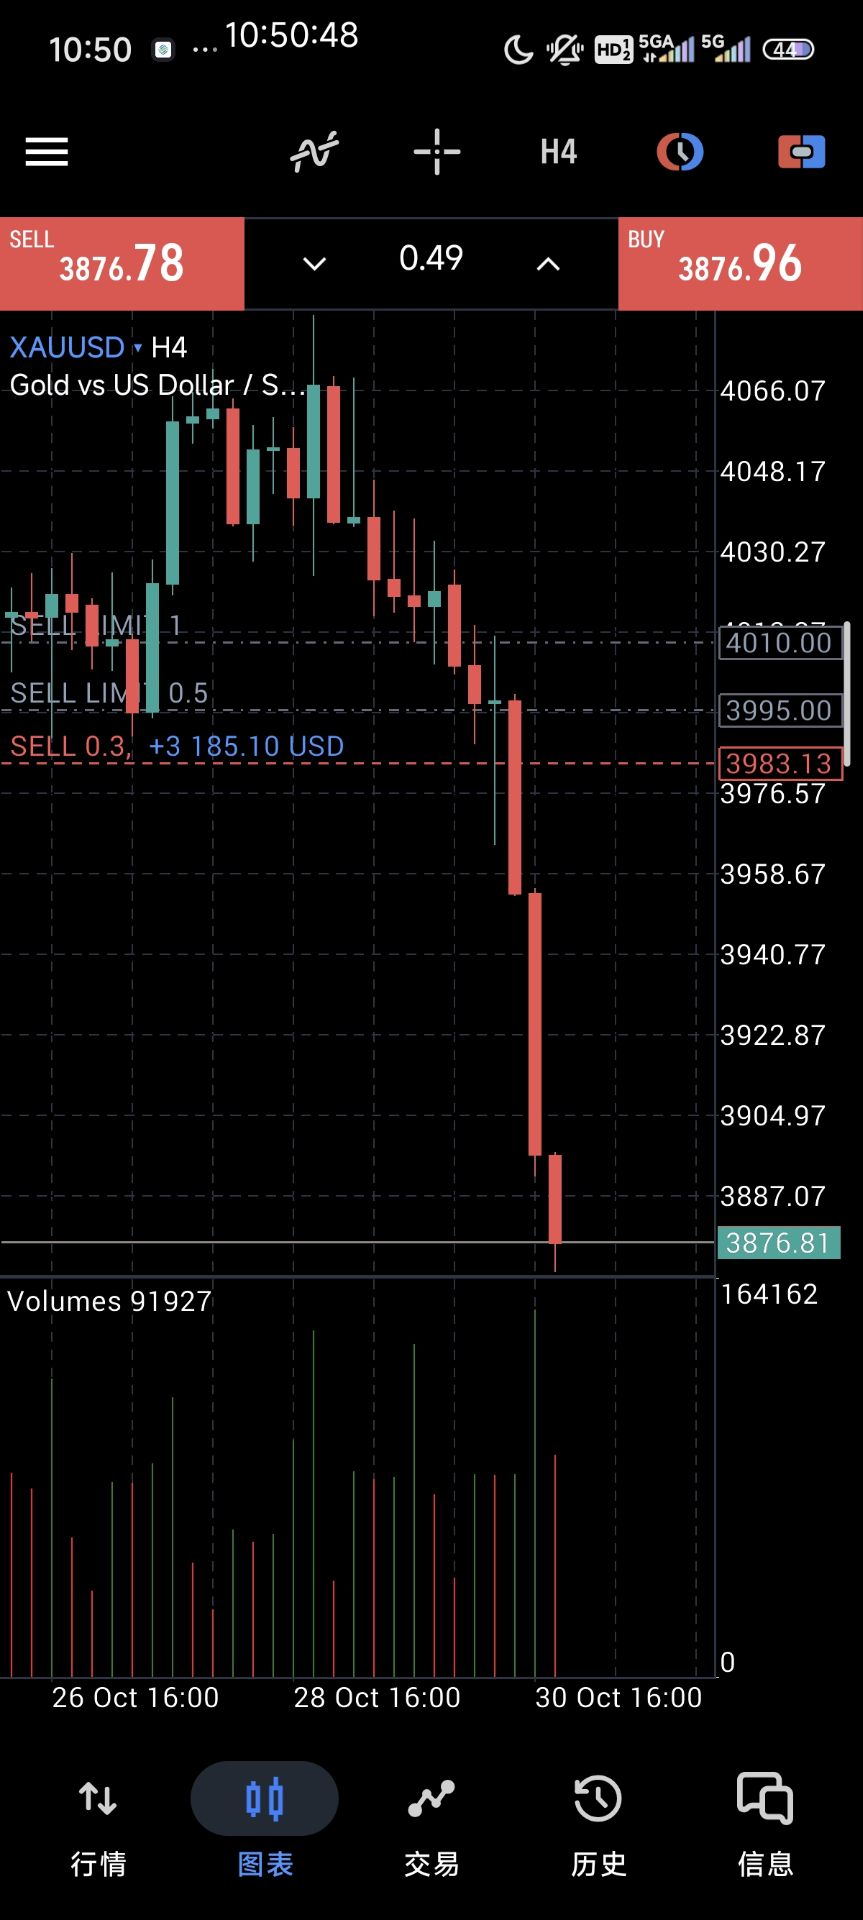
    If any positive news about war comes before Monday market open is there a chance this can go back to 4000 levels, i am on long from 4000 levels and now. My account is 53% one more drop and my account is wiped. I can put some money if any chance of recovery.Any valuable suggestions.?
    Skylark flag
    suvam giri
    @EuroTraderits going to rain here
    @suvam girihello mate how are you doing today hope you are good welcome
    Trade With Jabo flag
    2460732
    If any positive news about war comes before Monday market open is there a chance this can go back to 4000 levels, i am on long from 4000 levels and now. My account is 53% one more drop and my account is wiped. I can put some money if any chance of recovery.Any valuable suggestions.?
    @Visitor2460732yes i shall help u sir
    Trade With Jabo flag
    IF Anyone need any help in trading send me friend reguest i shall help you
    Đinh Kiên flag
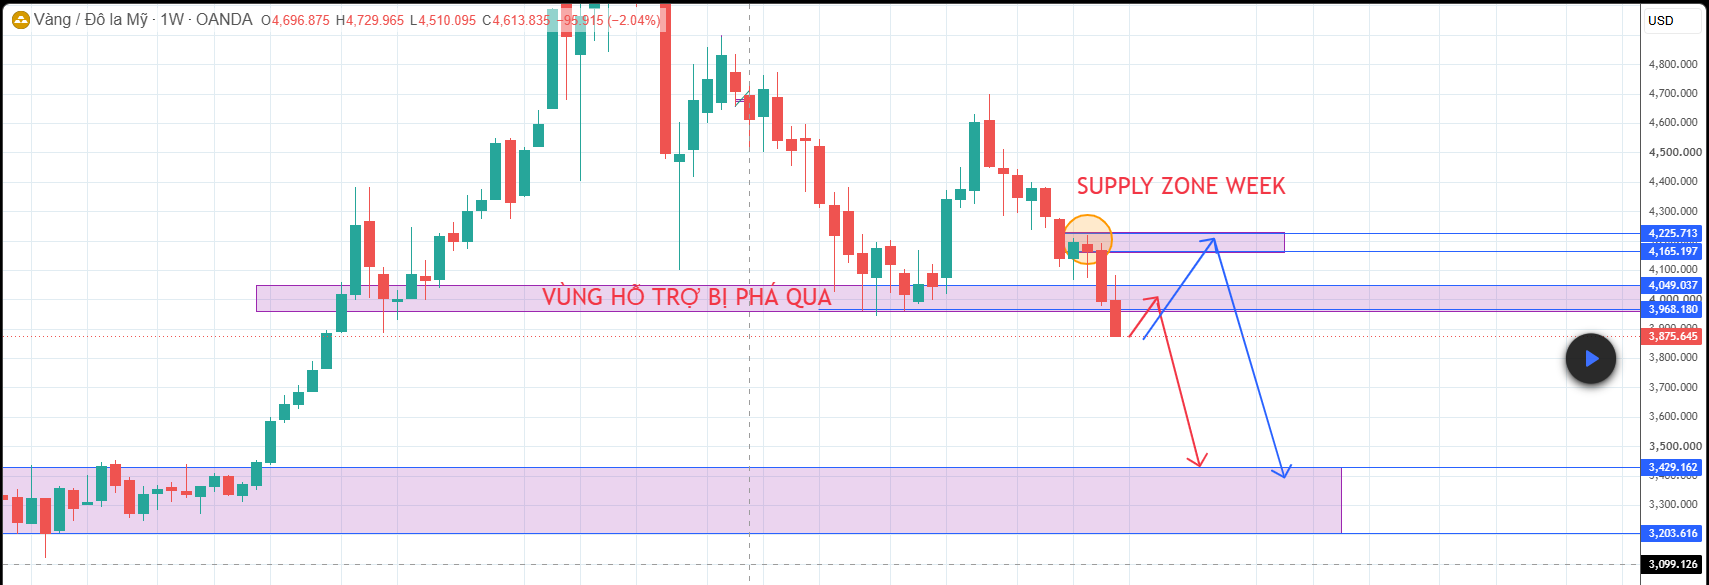
    2. Kịch bản VÀNG trong những tuần tiếp theo - Kịch bản 1 – Tiếp tục giảm trực tiếp: Ngay trong tuần tới, VÀNG có thể tiếp tục chịu áp lực bán và giảm thẳng về các vùng giá thấp hơn, mà không xuất hiện nhịp hồi đáng kể. - Kịch bản 2 – Hồi về vùng kháng cự gần: VÀNG có thể xuất hiện một nhịp hồi lên vùng 3.968 – 4.050. Đây là vùng hỗ trợ cũ đã bị phá vỡ và có khả năng chuyển thành kháng cự. Nếu giá phản ứng tại vùng này, VÀNG có thể tiếp tục quay đầu giảm. - Kịch bản 3 – Hồi sâu về Supply Zone: Trong trường hợp lực hồi mạnh hơn, VÀNG có thể tiếp tục tăng lên SUPPLY ZONE trên khung WEEK, vùng 4.165 – 4.225. Đây là vùng có thể xuất hiện lực bán trở lại. Nếu giá phản ứng và hình thành tín hiệu đảo chiều, xu hướng chính vẫn có thể tiếp tục là giảm. 3. Kết luận - Hiện tại, xu hướng trên khung WEEK vẫn đang nghiêng về phía giảm. Vì vậy, ưu tiên trong vài tuần tới là theo dõi các nhịp hồi lên vùng kháng cự/Supply Zone để tìm tín hiệu tiếp diễn xu hướng giảm, thay vì kỳ vọng VÀNG đảo chiều tăng ngay. - Vùng 3.968 – 4.050 là vùng cần theo dõi trước; nếu giá hồi sâu hơn, chú ý tiếp 4.165 – 4.225. Mục tiêu giảm phía dưới có thể hướng tới 3.200 – 3.400.
    Đinh Kiên flag
    Trade With Jabo flag
    IF Anyone need any help in trading send me friend reguest i shall help you
    Skylark flag
    2460732
    If any positive news about war comes before Monday market open is there a chance this can go back to 4000 levels, i am on long from 4000 levels and now. My account is 53% one more drop and my account is wiped. I can put some money if any chance of recovery.Any valuable suggestions.?
    Bro, I understand the pressure 53% that's heavy. About 4000 again — *nobody can guarantee it before Monday.* Yes, gold is very sensitive to war news. If there's a de-escalation / ceasefire headline over the weekend, we can see a sharp gap DOWN, not up. Gold pumps on fear. Positive war news (peace) usually dumps Gold. So if you're long from 4000, positive news is actually AGAINST your long. Negative war news / escalation would be what pushes Gold back up towards 4000. @Visitor2460732
    Skylark flag
    2460732
    If any positive news about war comes before Monday market open is there a chance this can go back to 4000 levels, i am on long from 4000 levels and now. My account is 53% one more drop and my account is wiped. I can put some money if any chance of recovery.Any valuable suggestions.?
    @Visitor2460732Don't add money to a losing trade just to avoid a margin call.* That's how accounts get fully wiped. Adding money doesn't change the chart, it just makes the loss bigger if it goes lower. Pros call it throwing good money after bad.
    Skylark flag
    2460732
    If any positive news about war comes before Monday market open is there a chance this can go back to 4000 levels, i am on long from 4000 levels and now. My account is 53% one more drop and my account is wiped. I can put some money if any chance of recovery.Any valuable suggestions.?
    @Visitor2460732What is your plan?* If it opens and drops another 1-2%, you said you're wiped. Is it worth risking more capital you can't afford to lose on hope? What most would do in your spot: - Cut the lot size / close half to save the account from liquidation and live to trade another day - Set a hard stop loss where you accept the loss, don't let broker liquidate you - Don't trade the weekend gap — Monday open can be wild with slippage
    Skylark flag
    2460732
    If any positive news about war comes before Monday market open is there a chance this can go back to 4000 levels, i am on long from 4000 levels and now. My account is 53% one more drop and my account is wiped. I can put some money if any chance of recovery.Any valuable suggestions.?
    Not financial advice — just risk management. If you're stressed, step away from the chart for a bit and talk to someone you trust. What was your original stop loss for this trade? @Visitor2460732
    "Trade With Jabo" recalled a message
    Trade With Jabo flag
    2460732
    If any positive news about war comes before Monday market open is there a chance this can go back to 4000 levels, i am on long from 4000 levels and now. My account is 53% one more drop and my account is wiped. I can put some money if any chance of recovery.Any valuable suggestions.?
    @Visitor2460732@Visitor2460732if u want i will help you sir i shall handle your account i shall change your loss into huge profit only i need your trust big loss recovery soon
    "Trade With Jabo" recalled a message
    5920320 flag
    Skylark
    Not financial advice — just risk management. If you're stressed, step away from the chart for a bit and talk to someone you trust. What was your original stop loss for this trade? @Visitor2460732
    @Skylark I did not have a stop loss for this trade, could not cut my fingers on time now I guess its time when the throat gets cut due to bad risk management. I get always caught in these big swings down, Down 9850.00 in this trade.
    fulltimetrader flag
    fulltimetrader flag
    5920320
    @Skylark I did not have a stop loss for this trade, could not cut my fingers on time now I guess its time when the throat gets cut due to bad risk management. I get always caught in these big swings down, Down 9850.00 in this trade.
    @游客5920320中国资管
    fulltimetrader flag
    fulltimetrader flag
    5920320
    @Skylark I did not have a stop loss for this trade, could not cut my fingers on time now I guess its time when the throat gets cut due to bad risk management. I get always caught in these big swings down, Down 9850.00 in this trade.
    @游客5920320翻译聊天记录,你就知道了
    Type here...
    Add Symbol or Code

      No matching data

      All
      Recommend
      Stocks
      Cryptocurrencies
      Central Banks
      Trump Updates
      Featured News
      • All
      • Russia-Ukraine Conflict
      • Middle East Flashpoint
      • All
      • Russia-Ukraine Conflict
      • Middle East Flashpoint
      Search
      Products

      Charts Free Forever

      Chats Q&A with Experts
      Screeners Economic Calendar Data Tools
      Membership Features
      Data Warehouse Market Trends Institutional Data Policy Rates Macro

      Market Trends

      Market Sentiment Order Book Forex Correlations

      Top Indicators

      Charts Free Forever
      Markets

      News

      24/7 Analysis Education

      Latest Views

      Latest Update

      Signals

      Copy Rankings Latest Signals Become a signal provider AI Rating
      Contests
      Brokers

      Overview Brokers Assessment Rankings Regulators News Claims
      Broker listing Forex Brokers Comparison Tool Live Spread Comparison Scam
      Q&A Complaint Scam Alert Videos Tips to Detect Scam
      More

      Business
      Events
      Careers About Us Advertising Help Center

      White Label

      Broker API

      Data API

      Web Plug-ins

      Affiliate Program

      Awards Institution Evaluation IB Seminar Salon Event Exhibition
      Vietnam Thailand Singapore Dubai
      Fans Party Investment Sharing Session
      FastBull Summit BrokersView Expo
      Recent Searches
        Top Searches
          Markets
          Analysis
          User
          24/7
          Economic Calendar
          Education
          Data
          • Names
          • Latest
          • Prev

          View All

          No data

          Scan to Download

          Faster Charts, Chat Faster!

          Download
          English
          • English
          • Español
          • العربية
          • Bahasa Indonesia
          • Bahasa Melayu
          • Tiếng Việt
          • ภาษาไทย
          • Français
          • Italiano
          • Türkçe
          • Русский язык
          • 简中
          • 繁中
          Open Account
          Search
          Products
          Charts Free Forever
          Markets
          News
          Signals

          Copy Rankings Latest Signals Become a signal provider AI Rating
          Contests
          Brokers

          Overview Brokers Assessment Rankings Regulators News Claims
          Broker listing Forex Brokers Comparison Tool Live Spread Comparison Scam
          Q&A Complaint Scam Alert Videos Tips to Detect Scam
          More

          Business
          Events
          Careers About Us Advertising Help Center

          White Label

          Broker API

          Data API

          Web Plug-ins

          Affiliate Program

          Awards Institution Evaluation IB Seminar Salon Event Exhibition
          Vietnam Thailand Singapore Dubai
          Fans Party Investment Sharing Session
          FastBull Summit BrokersView Expo

          Crypto Fear and Greed Index: How to Read Market Sentiment

          zhan chen
          Summary:

          Learn how the Crypto Fear and Greed Index works, what its 0–100 score means, and how to use fear and greed signals when analyzing Bitcoin and crypto markets.

          The Crypto Fear and Greed Index shows whether cryptocurrency investors are fearful, confident, or somewhere in between. When Bitcoin prices move sharply, the index helps explain market sentiment. But does extreme fear signal a buying opportunity, or can prices fall further?
          Crypto Fear and Greed Index: How to Read Market Sentiment_1

          Table of Contents

          • 1. What Is the Crypto Fear and Greed Index?
          • 2. Crypto Fear and Greed Index Today: How to Read the Current Score
          • 3. How Is the Crypto Fear and Greed Index Calculated?
          • 4. How to Use the Crypto Fear and Greed Index in Trading
          • 5. Crypto Fear and Greed Index vs. Other Market Indicators
          • 6. Does the Crypto Fear and Greed Index Predict Bitcoin Prices?
          • 7. What Are the Limitations of the Crypto Fear and Greed Index?
          • 8. Is the Crypto Fear and Greed Index Worth Following?
          • 9. FAQs About the Crypto Fear and Greed Index

          What Is the Crypto Fear and Greed Index?

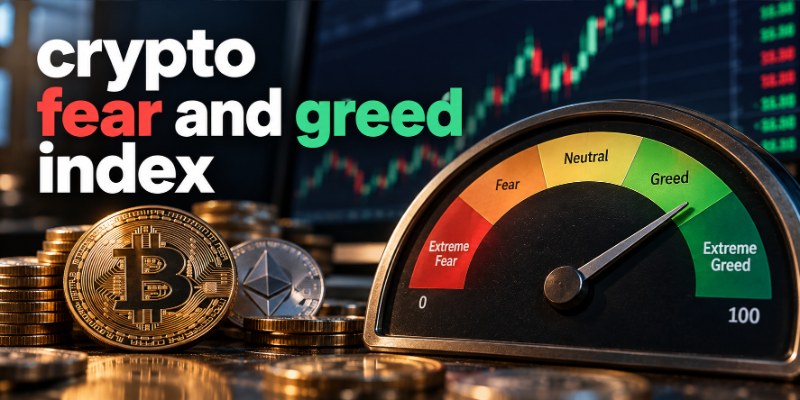
          The Crypto Fear and Greed Index measures cryptocurrency market sentiment on a scale from 0 to 100. Lower scores indicate fear, while higher scores indicate greed.

          The best-known version comes from Alternative.me and primarily tracks Bitcoin sentiment rather than every cryptocurrency equally.

          Sharp price declines can trigger pessimism, while rapid rallies often fuel excitement and fear of missing out (FOMO). Neither guarantees the next price movement, but both reveal how investors are reacting.

          Crypto Fear and Greed Index Scale Explained

          The index divides sentiment into five categories.

          Index ScoreSentimentWhat It Suggests
          0–24Extreme FearStrong pessimism and risk aversion
          25–49FearInvestors remain cautious
          50NeutralNeither fear nor greed dominates
          51–74GreedGrowing optimism and risk appetite
          75–100Extreme GreedStrong enthusiasm and possible overheating

          These scores describe sentiment, not valuation. A reading of 15 does not prove Bitcoin is cheap, just as 85 does not guarantee a correction.

          Crypto Fear and Greed Index Today: How to Read the Current Score

          The index changes daily, making live readings more useful than outdated figures. Check the latest score, historical values, and chart on the official Crypto Fear and Greed Index page.

          What Does a Low Fear and Greed Index Mean?

          A low score indicates concern about falling prices, economic uncertainty, or unfavorable developments. Extreme fear commonly accompanies sell-offs, liquidations, and reduced risk appetite.

          If Bitcoin falls while the index drops from 45 to 18, sentiment has deteriorated significantly. That may interest patient investors, but fear can persist throughout a bear market. A low score cannot identify the bottom.

          What Does a High Fear and Greed Index Mean?

          High readings reflect optimism, often driven by rising prices and stronger trading activity.

          Extreme greed can increase vulnerability to profit-taking or corrections. However, bullish markets may remain in greed territory for weeks. Selling solely because the index reaches 80 could mean exiting too early.

          Why the Trend Matters More Than One Reading

          Changes over several days or weeks provide more context than one score.

          • Fear rises from 15 to 35: Sentiment improves, although caution remains.
          • Greed falls from 85 to 60: Optimism cools but remains positive.
          • Fear stays below 25 for weeks: Uncertainty may be prolonged rather than temporary.

          Compare these changes with Bitcoin prices, trading volume, and broader conditions.

          How Is the Crypto Fear and Greed Index Calculated?

          Alternative.me combines market behavior and sentiment indicators using published factor weights. It does not simply count bullish and bearish opinions.

          Main Factors Behind the Index

          FactorPublished WeightWhat It Measures
          Volatility25%Current Bitcoin volatility and drawdowns relative to historical averages
          Market Momentum and Volume25%Trading activity and market momentum compared with historical levels
          Social Media15%Engagement and sentiment-related activity on social platforms
          Surveys15%Investor sentiment surveys; currently paused
          Bitcoin Dominance10%Changes in Bitcoin's share of the cryptocurrency market
          Trends10%Search interest in Bitcoin-related topics

          Source: Alternative.me's published methodology. Surveys are currently paused, so the listed weights do not necessarily represent every active daily calculation.

          Volatility and Market Momentum

          Sharp declines and unusually high volatility often reflect fear. Strong buying activity and momentum can indicate growing risk appetite, while weakening momentum suggests fading confidence.

          Together, these factors help distinguish ordinary price fluctuations from emotionally driven trading.

          Social Media, Search Trends, and Bitcoin Dominance

          Social engagement and Google search trends can reveal growing excitement or concern around Bitcoin.

          Bitcoin dominance measures its share of the overall crypto market. Investors sometimes favor Bitcoin over smaller tokens during uncertainty, although rising dominance can also reflect Bitcoin outperforming rather than widespread fear.

          How to Use the Crypto Fear and Greed Index in Trading

          The index works best alongside price analysis and risk management, not as a standalone trading signal.

          1. Look for Extreme Sentiment

          Extreme readings can indicate one-sided expectations. Fear may drive aggressive selling, while greed can encourage buyers to chase rallies without considering downside risk.

          When most investors expect the same outcome, markets can become vulnerable to reversals. Still, extreme sentiment is a reason to investigate, not an automatic trade signal.

          2. Compare Sentiment With Bitcoin Price Action

          If Bitcoin keeps making lower lows while the index stays near 20, weakness remains evident.

          If Bitcoin begins holding support, selling volume declines, and sentiment improves toward neutral, stabilization becomes more plausible.

          Traders can also examine the Relative Strength Index (RSI), moving averages, and support or resistance levels to see whether indicators agree.

          3. Use Sentiment to Manage Risk

          During extreme greed, investors with substantial unrealized gains might review concentration or rebalance. During extreme fear, long-term investors could consider gradual purchases rather than attempting to time the bottom.

          Neither approach requires an all-or-nothing decision.

          4. Avoid Treating Extreme Fear as an Automatic Buy Signal

          Fear can remain elevated while prices continue falling. Similarly, extreme greed can persist throughout strong rallies.

          Combine sentiment with price trends, liquidity, macroeconomic developments, and a defined risk-management plan.

          Crypto Fear and Greed Index vs. Other Market Indicators

          The Fear and Greed Index measures market psychology, while other indicators examine momentum, trends, or trading activity.

          IndicatorMain PurposeKey Limitation
          Crypto Fear and Greed IndexMeasures overall Bitcoin-focused sentimentDoes not predict price direction
          Relative Strength Index (RSI)Measures price momentumCan remain overbought or oversold
          Moving AveragesIdentify trend directionReact after price movements
          Trading VolumeMeasures market participationHigh volume can accompany buying or selling
          Funding RatesShow positioning pressure in perpetual futuresVary across exchanges and contracts

          For example, extreme greed alongside strong RSI momentum and increasing volume suggests enthusiasm, but not necessarily an imminent reversal.

          Likewise, extreme fear with declining selling pressure may warrant attention, although confirmation remains important.

          Does the Crypto Fear and Greed Index Predict Bitcoin Prices?

          No—not reliably on its own. The index partly reacts to price movements that have already happened. It describes current sentiment more effectively than it forecasts Bitcoin's next move.

          Can Extreme Fear Signal a Market Bottom?

          Extreme fear has appeared near important market lows. During the 2022 crypto downturn, sentiment remained deeply negative amid Bitcoin losses and major industry failures.

          However, prices did not recover immediately. Extreme pessimism can accompany attractive long-term opportunities or appear well before a lasting bottom.

          Can Extreme Greed Signal a Market Top?

          Extreme greed often accompanies speculative rallies, but elevated optimism can last for months.

          A high reading suggests possible correction risk without providing reliable timing. Weakening momentum or broken support may offer more actionable evidence.

          What Are the Limitations of the Crypto Fear and Greed Index?

          The index has several important limitations.

          First, it is Bitcoin-focused. Ethereum, smaller altcoins, and individual sectors may experience different sentiment.

          Second, it is partly reactive. Price declines can trigger fear readings after substantial losses have already occurred.

          Third, it cannot capture every market force. Regulation, institutional flows, exchange failures, and economic surprises can overwhelm sentiment signals.

          Fourth, it does not directly measure every investor's positioning. Its selected inputs provide an estimate rather than a complete real-time picture.

          For broader context, investors can review market capitalization, trading activity, and Bitcoin dominance on CoinGecko.

          Is the Crypto Fear and Greed Index Worth Following?

          Yes. The index offers a straightforward way to monitor changes in cryptocurrency sentiment and recognize periods of unusual anxiety or optimism.

          However, sentiment does not determine valuation or future returns. Its greatest value comes from tracking changes over time alongside price action, liquidity, and economic conditions.

          Extreme fear is a reason to investigate opportunities, while extreme greed is a reason to reassess risk—not a guarantee of reversal.

          FAQs About the Crypto Fear and Greed Index

          What is a good Crypto Fear and Greed Index score?

          There is no universally good score. Low readings indicate pessimism and potential opportunities, while high readings suggest optimism and possibly elevated risk.

          How often is the Crypto Fear and Greed Index updated?

          The Alternative.me index updates daily, with current and historical readings available on its official website.

          Is the Crypto Fear and Greed Index only for Bitcoin?

          Alternative.me's index primarily tracks Bitcoin sentiment, although investors often use it as a broader cryptocurrency market reference.

          Should I buy crypto when the Fear and Greed Index is low?

          Not based on sentiment alone. Consider market trends, fundamentals, liquidity, and your investment horizon.

          Is extreme greed a sell signal?

          Not necessarily. Extreme greed may precede corrections but can also persist during strong bull markets.

          Risk Warnings and Disclaimers
          You understand and acknowledge that there is a high degree of risk involved in trading. Following any strategies or investment methods may lead to potential losses. The content on the site is provided by our contributors and analysts for information purposes only. You are solely responsible for determining whether any trading assets, securities, strategy, or any other product is suitable for investing based on your own investment objectives and financial situation.
          Add to Favorites
          Share
          FastBull
          Copyright © 2026 FastBull Ltd

          728 RM B 7/F GEE LOK IND BLDG NO 34 HUNG TO RD KWUN TONG KLN HONG KONG

          TelegramInstagramTwitterfacebooklinkedin
          App Store Google Play Android Windows
          Products
          Charts

          Chats

          Q&A with Experts
          Screeners
          Economic Calendar
          Data
          Tools
          Membership
          Features
          Function
          Markets
          Copy Trading
          Latest Signals
          Contests
          24/7
          Analysis
          Education
          Company
          Careers
          About Us
          Contact Us
          Advertising
          Download FastBull
          Help Center
          Feedback
          User Agreement
          Privacy Policy
          Personal Information Protection Statement
          Business

          White Label

          Broker API

          Data API

          Web Plug-ins

          Poster Maker

          Affiliate Program

          Risk Disclosure

          The risk of loss in trading financial instruments such as stocks, FX, commodities, futures, bonds, ETFs and crypto can be substantial. You may sustain a total loss of the funds that you deposit with your broker. Therefore, you should carefully consider whether such trading is suitable for you in light of your circumstances and financial resources.

          No decision to invest should be made without thoroughly conducting due diligence by yourself or consulting with your financial advisors. Our web content might not suit you since we don't know your financial conditions and investment needs. Our financial information might have latency or contain inaccuracy, so you should be fully responsible for any of your trading and investment decisions. The company will not be responsible for your capital loss.

          Without getting permission from the website, you are not allowed to copy the website's graphics, texts, or trademarks. Intellectual property rights in the content or data incorporated into this website belong to its providers and exchange merchants.

          Not Logged In

          Log in to access more features

          Connect Broker
          Become a signal provider
          Help Center
          Customer Service
          Dark Mode
          Price Up/Down Colors

          Log In

          Sign Up

          Position
          Layout
          Fullscreen
          Default to Chart
          The chart page opens by default when you visit fastbull.com