Markets
News
Analysis
User
24/7
Economic Calendar
Education
Data
- Names
- Latest
- Prev


Signal Accounts for Members
All Signal Accounts
All Contests


Turkey Trade BalanceA:--
F: --
P: --
Germany Construction PMI (SA) (Nov)A:--
F: --
P: --
Euro Zone IHS Markit Construction PMI (Nov)A:--
F: --
P: --
Italy IHS Markit Construction PMI (Nov)A:--
F: --
P: --
U.K. Markit/CIPS Construction PMI (Nov)A:--
F: --
P: --
France 10-Year OAT Auction Avg. YieldA:--
F: --
P: --
Euro Zone Retail Sales MoM (Oct)A:--
F: --
P: --
Euro Zone Retail Sales YoY (Oct)A:--
F: --
P: --
Brazil GDP YoY (Q3)A:--
F: --
P: --
U.S. Challenger Job Cuts (Nov)A:--
F: --
P: --
U.S. Challenger Job Cuts MoM (Nov)A:--
F: --
P: --
U.S. Challenger Job Cuts YoY (Nov)A:--
F: --
P: --
U.S. Initial Jobless Claims 4-Week Avg. (SA)A:--
F: --
P: --
U.S. Weekly Initial Jobless Claims (SA)A:--
F: --
P: --
U.S. Weekly Continued Jobless Claims (SA)A:--
F: --
P: --
Canada Ivey PMI (SA) (Nov)A:--
F: --
P: --
Canada Ivey PMI (Not SA) (Nov)A:--
F: --
P: --
U.S. Non-Defense Capital Durable Goods Orders Revised MoM (Excl. Aircraft) (SA) (Sept)A:--
F: --
U.S. Factory Orders MoM (Excl. Transport) (Sept)A:--
F: --
P: --
U.S. Factory Orders MoM (Sept)A:--
F: --
P: --
U.S. Factory Orders MoM (Excl. Defense) (Sept)A:--
F: --
P: --
U.S. EIA Weekly Natural Gas Stocks ChangeA:--
F: --
P: --
Saudi Arabia Crude Oil ProductionA:--
F: --
P: --
U.S. Weekly Treasuries Held by Foreign Central BanksA:--
F: --
P: --
Japan Foreign Exchange Reserves (Nov)A:--
F: --
P: --
India Repo RateA:--
F: --
P: --
India Benchmark Interest RateA:--
F: --
P: --
India Reverse Repo RateA:--
F: --
P: --
India Cash Reserve Ratio--
F: --
P: --
Japan Leading Indicators Prelim (Oct)A:--
F: --
P: --
U.K. Halifax House Price Index YoY (SA) (Nov)--
F: --
P: --
U.K. Halifax House Price Index MoM (SA) (Nov)--
F: --
P: --
France Current Account (Not SA) (Oct)--
F: --
P: --
France Trade Balance (SA) (Oct)--
F: --
P: --
France Industrial Output MoM (SA) (Oct)--
F: --
P: --
Italy Retail Sales MoM (SA) (Oct)--
F: --
P: --
Euro Zone Employment YoY (SA) (Q3)--
F: --
P: --
Euro Zone GDP Final YoY (Q3)--
F: --
P: --
Euro Zone GDP Final QoQ (Q3)--
F: --
P: --
Euro Zone Employment Final QoQ (SA) (Q3)--
F: --
P: --
Euro Zone Employment Final (SA) (Q3)--
F: --
Brazil PPI MoM (Oct)--
F: --
P: --
Mexico Consumer Confidence Index (Nov)--
F: --
P: --
Canada Unemployment Rate (SA) (Nov)--
F: --
P: --
Canada Labor Force Participation Rate (SA) (Nov)--
F: --
P: --
Canada Employment (SA) (Nov)--
F: --
P: --
Canada Part-Time Employment (SA) (Nov)--
F: --
P: --
Canada Full-time Employment (SA) (Nov)--
F: --
P: --
U.S. Dallas Fed PCE Price Index YoY (Sept)--
F: --
P: --
U.S. PCE Price Index YoY (SA) (Sept)--
F: --
P: --
U.S. PCE Price Index MoM (Sept)--
F: --
P: --
U.S. Personal Outlays MoM (SA) (Sept)--
F: --
P: --
U.S. Core PCE Price Index MoM (Sept)--
F: --
P: --
U.S. UMich 5-Year-Ahead Inflation Expectations Prelim YoY (Dec)--
F: --
P: --
U.S. Core PCE Price Index YoY (Sept)--
F: --
P: --
U.S. 5-10 Year-Ahead Inflation Expectations (Dec)--
F: --
P: --
U.S. UMich Current Economic Conditions Index Prelim (Dec)--
F: --
P: --
U.S. UMich Consumer Sentiment Index Prelim (Dec)--
F: --
P: --
U.S. UMich 1-Year-Ahead Inflation Expectations Prelim (Dec)--
F: --
P: --
U.S. UMich Consumer Expectations Index Prelim (Dec)--
F: --
P: --


No matching data
Latest Views
Latest Views
Trending Topics
Top Columnists
Latest Update
White Label
Data API
Web Plug-ins
Affiliate Program
View All

No data
Chainlink news has been everywhere lately, reflecting a wild week for LINK traders. “Why did Chainlink price dip so hard?” is now trending, as the token broke down from crucial levels. Major headlines like the official rollout of Chainlink’s Cross-Chain Interoperability Protocol (CCIP) and the launch of the Chainlink Runtime Environment flashed on everyone’s feed.
These releases should have fueled excitement, but oddly, LINK’s price action did not follow the narrative. Instead, as Bitcoin’s dominance surged above 60%, investors rotated cash out of altcoins. The market’s Fear & Greed Index now sits at a chilling 20, making “Chainlink Crypto” breakout queries more popular as traders search for next moves.
Chainlink Price Analysis
The LINK crypto price staged a sharp move as it crumbled below the key support at $15.26 on November 4. This confirmed a technical breakdown, with the price now locked in a well-defined descending channel. The fall instantly invalidated short-term bullish structures and activated a wave of stop-loss triggers. 
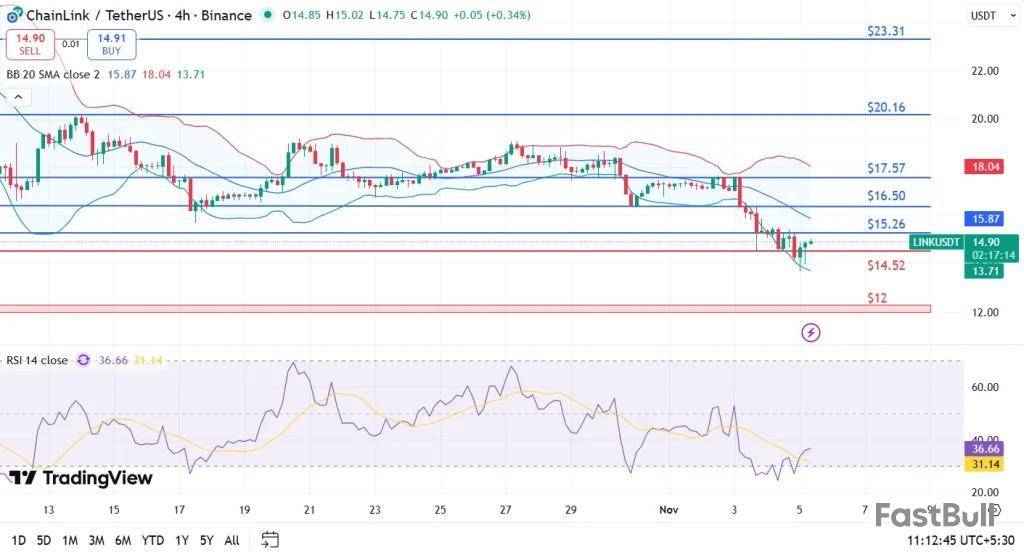
Successively, indicators echo the weakness, the MACD prints below zero and its signal line at -1.03 vs. -0.90, highlighting the persistent bearish stance. Likewise, the 4-hour RSI hovers at 32.68, reflecting clearly oversold conditions but not yet signaling a reversal.
LINK token price is now trading around $14.90, marking a firm -1.45% drop in the last 24 hours and a steeper -16.53% weekly decline. Trading activity exploded, with the daily volume up 36.31% to $1.75 billion. The day’s price range stretched between $13.87 and $15.37. Immediate resistance sits at $15.26, followed by stiff resistance near $16.61.
Contrarily, failure to hold $14.52 could call for a fresh selloff down to the $12–$13 zone, matching 2025’s lowest price levels. Right now, stabilization will require daily closes above $15.00 to hint at a technical base forming in this region.
FAQs
Why is Chainlink price down today?Chainlink price fell, as it broke below $15.26, activating stop-loss selling. The move was compounded by capital rotation into Bitcoin and a general wave of risk-off sentiment.
Where does Chainlink price find support now?Currently, $14.52 is the first demand area. A failure to hold there could send LINK price down to its yearly lows between $12 and $13.
Has the technical trend changed for Chainlink Crypto?Technically, bears control the trend. Indicators like the MACD and RSI remain bearish, so stronger signs of stabilization will only appear with daily closes above $15.00.
Conversations about Bitcoin’s price drop should include the impact of crypto treasury companies, which have contributed to the decline, argues Omid Malekan, a blockchain author and adjunct professor at Columbia Business School.
“Any analysis of why crypto prices continue to fall needs to include DATs [digital asset treasuries],” Malekan said in an X post on Tuesday. “In aggregate they turned out to be a mass extraction and exit event — a reason for prices to go down.”
He added that there are a few companies that have tried to “create sustainable value. But I can count them on one hand.”
Analysts have blamed trade tensions between the US and China, along with other macroeconomic factors for the crypto market’s decline, which has seen Bitcoin (BTC) fluctuate between $99,607.01 and $113,560 over the last seven days, trading down from its Oct. 6 all-time high of over $126,000, according to CoinGecko
Companies in it for wrong reasons causing problem
Many crypto buying companies were able to raise millions from investors looking for exposure to crypto, and Malekan claimed that some of the people launching crypto treasury companies saw the model “as a get rich quick scheme.”
“Launching any kind of public entity is expensive,” he added. “The money required for the shell/PIPE/SPAC runs into the millions. As do the fees paid to all the bankers and lawyers involved.”
“The money spent on those fees had to come from somewhere,” he said.
Crypto treasury companies have been acquiring a substantial supply of tokens across the top cryptocurrencies, utilizing leverage through share sales, convertible notes, and debt offerings to do so, which has sparked concerns that leveraged firms could exacerbate a market downturn by forced selling of assets.
Others have looked to entice investors by generating yield on their holdings through measures such as staking, while some have flagged plans to deploy part of their holdings into crypto protocols for lending and liquidity provision purposes.
“The biggest damage DATs did to aggregate crypto market cap was by providing a mass exit event for supposedly locked tokens,” Malekan claimed. “I’m still amazed so many other investors didn’t cry foul over this.”
He added that “raising too much money and minting too many tokens even if they are locked or for ecosystem growth is the gangrene of crypto.”
Crypto treasury trend explodes in 2025
The number of crypto treasuries has exploded this year, with an October report from asset manager Bitwise tracking 48 new instances of companies adding Bitcoin to their balance sheets, totaling 207 overall, and collectively holding over one million tokens, worth over $101 billion.
At the same time, Ether (ETH), the second most adopted cryptocurrency for treasuries, has been added to 71 companies’ balance sheets, according to Strategic ETH Reserve data.
Analysts told Cointelegraph that DATs will likely start consolidating under a few larger players as the cycle matures and companies try to attract investors, while others speculate the trend will see companies expand to other areas of Web3.
US financial giant Franklin Templeton, which boasts $1.5 trillion in assets under management, has updated the S-1 filing for its XRP exchange-traded fund (ETF) filing.
The S-1 filing is a registration document that an issuer files with the SEC in order to launch a publicly traded product, which is an XRP ETF in this particular case.
The updated filing comes with shortened Section 8 (a) language, which is a clause in the Securities Act that makes it possible for the regulator to delay a registration's effectiveness.
The latest move means that the SEC is now preparing for the imminent approval of the registration.
This comes after Bitwise and Canary Fund also updated their filing.
XRP is still in the read
Despite the growing ETF momentum, the price of the ETF token remains in the red. The cryptocurrency has lost more than 14% over the past week amid a broader cryptocurrency market correction.
XRP's future price action will likely depend on the level of demand that spot-based ETFs will experience.
Bitcoin and Ethereum spot exchange-traded funds in the U.S. saw a combined net outflow of $797 million on Tuesday as institutional investors repositioned holdings during a market meltdown.
According to data from SoSoValue, spot bitcoin ETFs recorded a net outflow of $577.74 million, which is the largest single-day outflow since Aug. 1. Fidelity's FBTC saw $356.6 million exit the fund, Ark & 21Shares' ARKB saw $128 million in outflows, and Grayscale's GBTC saw $48.9 million worth of outflows.
A total of seven BTC funds reported negative flows on Tuesday. This extends the funds' outflow streak to five days, during which the ETFs saw $1.9 billion in outflows.
Spot Ethereum ETFs posted net outflows of $219.37 million yesterday, led by $111 million in net outflows from BlackRock's ETHA. Funds from Grayscale and Fidelity also reported outflows. Spot Solana ETFs reported net inflows of $14.83 million, posting the smallest amount of daily net inflows since their debut last week.
Institutional recalibration
"The fifth straight day of outflows marks a decisive shift in institutional positioning," said Rachael Lucas, crypto analyst at BTC Markets. "This isn't just a pause; it's a recalibration."
Lucas explained that institutional selling is a tactical move driven by risk management after assessing the macroeconomic environment.
Last month's hawkish message from U.S. Federal Reserve Chair Jerome Powell crushed hopes for a guaranteed December interest rate cut, which pushed up the U.S. dollar index (DXY) above 100 to a relatively strong dollar.
"Risk assets are repricing, and crypto, still tightly correlated to tech, is feeling the heat," said Lucas. "The AI trade looks overextended, and if valuations in that sector unwind, it could spill into crypto via the Nasdaq correlation."
This put the crypto fear and greed index fell to 21 on Tuesday, down from 42 the previous day, placing it in the "extreme fear" territory. This fear in the market is being amplified by ETF flows, Derek Lim, research lead at Caladan, told The Block.
Lim shared the view that Powell's comment strengthened the dollar and triggered a risk-off sentiment, adding that the U.S. government shutdown is further contributing to macroeconomic uncertainty.
Still bullish
However, Lim of Caladan maintained that the bullish structure for the crypto market remains intact.
"A delayed rate cut would be short term negative for risk assets, but the overall macro conditions have not changed significantly — we're still moving towards the end of QT and rate cuts are coming sooner or later," said Lim. "At current levels, the bullish structure still holds, even as sentiment seems to be at rock bottom. Of course, once again, there is going to be a lot of volatility."
Lim added that the 21.5% drop in bitcion's price from $125,000 to $99,000 is relatively mild compared to the 31% drop in the first quarter of the year amid concerns surrounding the "Liberation Day" tariffs.
"If outflows persist, expect further price pressure — liquidity thins, volatility spikes, and technical levels come into play," Lucas told The Block. "Re-accumulation will require a shift in macro tone or a new narrative. Rate cuts, a weaker USD, or a resurgence in real-world asset tokenization could reignite interest."
According to The Block's crypto price page, bitcoin is down 2.7% in the past 24 hours to trade at $101,731, while ether dropped 4.7% to change hands at $3,326.
Disclaimer: The Block is an independent media outlet that delivers news, research, and data. As of November 2023, Foresight Ventures is a majority investor of The Block. Foresight Ventures invests in other companies in the crypto space. Crypto exchange Bitget is an anchor LP for Foresight Ventures. The Block continues to operate independently to deliver objective, impactful, and timely information about the crypto industry. Here are our current financial disclosures.
© 2025 The Block. All Rights Reserved. This article is provided for informational purposes only. It is not offered or intended to be used as legal, tax, investment, financial, or other advice.
Solana started a fresh decline below the $165 zone. SOL price is now consolidating losses below $165 and might decline further below $150.
Solana Price Dips Heavily
Solana price failed to remain stable above $180 and started a fresh decline, like Bitcoin and Ethereum. SOL declined below the $175 and $165 support levels.
The price gained bearish momentum below $160. A low was formed at $145, and the price is now consolidating losses. The price recovered a few points above the 23.6% Fib retracement level of the downward move from the $188 swing high to the $145 low.
Solana is now trading below $160 and the 100-hourly simple moving average. On the upside, immediate resistance is near the $158 level. There is also a key bearish trend line forming with resistance at $158 on the hourly chart of the SOL/USD pair.

The next major resistance is near the $162 level. The main resistance could be $166 and the 50% Fib retracement level of the downward move from the $188 swing high to the $145 low. A successful close above the $166 resistance zone could set the pace for another steady increase. The next key resistance is $175. Any more gains might send the price toward the $180 level.
Another Decline In SOL?
If SOL fails to rise above the $166 resistance, it could continue to move down. Initial support on the downside is near the $155 zone. The first major support is near the $150 level.
A break below the $150 level might send the price toward the $145 support zone. If there is a close below the $145 support, the price could decline toward the $132 support in the near term.
Technical Indicators
Hourly MACD – The MACD for SOL/USD is gaining pace in the bearish zone.
Hourly Hours RSI (Relative Strength Index) – The RSI for SOL/USD is below the 50 level.
Major Support Levels – $155 and $150.
Major Resistance Levels – $162 and $166.
In the last few weeks, the Ethereum price has performed poorly, thanks to the bearish pressure triggered by the Bitcoin price decline. After losing support above $4,000, the second-largest cryptocurrency by market cap is now showing more signs of a breakdown that could trigger a spiral. Multiple analysts have already shared where they see the Ethereum price going, and we take a look at two that look at both ends of the spectrum.
A Recovery And Then A Crash
Crypto analyst Melikatrader highlighted an important structure that the Ethereum price has formed recently, and that is a clear structure of recovery. This comes after the cryptocurrency completed a liquidity sweep around $3,700, which is referred to as a “Hunting.”
Now, with the liquidity sweep completed at this level, the analyst believes that this creates a potential base that could see the Ethereum price correct upwards. Amid this, the altcoin has also seen some consolidation between $3,700 and $3,800, making this range an important area of interest.
If bulls are able to claim and hold this level, then it could put Ethereum on the path of another uptrend. It would put an end to the accumulation trend and kickstart another bullish run. Such a run would send the Ethereum price into the next supply zone, which lies at $4,080-$4,180, before seeing any major downward correction.
Despite expecting the price to climb, the crypto analyst also highlights the fact that Ethereum is still flashing a bearish market structure. With the ascending trendline on the move, the price is expected to hit resistance around $4,100. If bears are able to successfully reject the price from this level, then the Ethereum price is expected to crash back below $4,000.

Analyst Calls The Top For Ethereum Price
While many in the space believe the current downtrend is only temporary, crypto analyst CRYPTO Damus believes that this could actually be the cycle top. In the post on X, he compares the current trend to that of the 2018 and 2021 cycle tops using the weekly chart.
Damus points out that there are similarities between the previous cycle tops and that the Ethereum price is currently following a similar playbook. This comes after consistent green candles, followed by red candles on the weekly chart, ending in a bear market.
The analyst explains that it is possible that this time could be different, given the deviations in the market cycles so far. However, if it is the same trend from the last two bull cycles, that would mean that the bull run is over for Ethereum, and investors should brace for a crash.
In a truly shocking twist, Bitcoin has now performed worse than the U.S. Treasuries in 2025. BTC is now up by a mere 8% this year.
Joe Weisenthal@TheStalwartNov 05, 2025Huge. Bitcoin has now performed worse than US Treasuries in 2025 pic.twitter.com/c2Mo8lFPSM
Why it's a big deal
US Treasuries are typically known for being the ultimate risk-free benchmark for investors.
Hence, the fact that the highly speculative asset performs worse than US Treasuries during what was supposed to be a banner year for crypto shows just how weak the cryptocurrency is.
It is worth noting that Bitcoin (the yellow line) did spend most of the year well above Treasuries. However, it dropped below them on Tuesday following the latest price crash that erased a significant portion of its 2025 gains.
As reported by U.Today, the flagship coin recently briefly dropped below the $100,000 level.
"Max desperation"
According to Matt Hougan, Bitwise's chief investment officer, has noted that retail investors are at the point of "max desperation."
However, Hougan is convinced that another cryptocurrency winter is not coming.
Key level to watch
On Tuesday, Bitcoin exchange-traded funds (ETFs) logged a whopping $578 worth of outflows.
Notably, the average cost basis of all Bitcoins ever bought through spot ETFS currently stands $89,600.
White Label
Data API
Web Plug-ins
Poster Maker
Affiliate Program
The risk of loss in trading financial instruments such as stocks, FX, commodities, futures, bonds, ETFs and crypto can be substantial. You may sustain a total loss of the funds that you deposit with your broker. Therefore, you should carefully consider whether such trading is suitable for you in light of your circumstances and financial resources.
No decision to invest should be made without thoroughly conducting due diligence by yourself or consulting with your financial advisors. Our web content might not suit you since we don't know your financial conditions and investment needs. Our financial information might have latency or contain inaccuracy, so you should be fully responsible for any of your trading and investment decisions. The company will not be responsible for your capital loss.
Without getting permission from the website, you are not allowed to copy the website's graphics, texts, or trademarks. Intellectual property rights in the content or data incorporated into this website belong to its providers and exchange merchants.
Not Logged In
Log in to access more features

FastBull Membership
Not yet
Purchase
Log In
Sign Up