


Markets
Analysis
User
24/7
Economic Calendar
Education
Data
- Names
- Latest
- Prev


(Bloomberg) — China’s economy is buckling under the weight of tariffs and a deep-rooted property crisis, yet stocks are extending their bull run — a disconnect that’s stirring doubts on the rally’s staying power.
In just the past month, onshore stocks have added almost a trillion dollars to their market value, the Shanghai Composite Index has hit a decade-high and the CSI 300 Index has taken its advance from this year’s low to more than 20%. That’s when nearly every recent economic indicator — from consumption trends, home prices to inflation — has brought red flags for investors.
The rally has been driven by cash-rich investors shifting into stocks amid a lack of alternatives. While the market’s steady advance may suggest less risk of a sudden correction, some analysts are warning that a bubble is in the making. Nomura Holdings Inc. is cautioning against “irrational exuberance,” while TS Lombard is calling the mismatch a stand-off between “market bulls and macro bears.”
“Markets might be expecting, either correctly or incorrectly, that macroeconomic fundamentals will improve,” said Homin Lee, senior macro strategist at Lombard Odier Ltd. in Singapore. “But a bull market will not be sustainable if inflation remains close to 0% and corporate pricing power faces severe headwinds from weak domestic demand.”
A deflationary spiral that’s eroded corporate pricing power in the world’s second-largest economy is one of the biggest reasons to doubt the sustainability of the current rally.
Consumer prices were flat in July, producer prices fell for a 34th month, and the GDP deflator extended its negative streak. While Beijing has embarked on a campaign to curb overcapacity and rein in price wars, it has had limited impact so far.
The 12-month forward earnings estimate for CSI 300 members has slipped 2.5% from this year’s high. Intense price competition has hit profits for the likes of JD.com Inc. and Geely Automobile Holdings Ltd.
The troubling picture has fueled expectations that Beijing will step up support. But the policy rollout so far suggests officials are steering away from the large-scale stimulus playbook, instead preferring a measured approach.
Read: China Struggles to End Deflation With 2015 Playbook Out of Reach
Equity gains are also complicating policy response to the economy’s slowdown, according to Nomura, as pro-growth measures risk inflating a stock-market bubble.
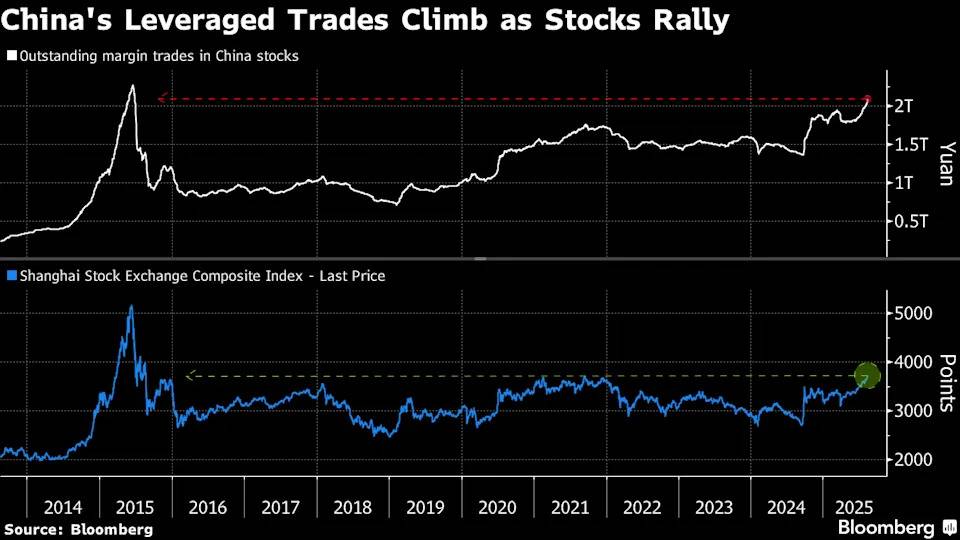
Market watchers are also drawing comparisons to the start of the 2015 boom-bust cycle. Back then, a surge in margin trading sent stocks soaring, before a clampdown on such leveraged activities triggered an epic crash.
While current gains are far more measured than the meteoric rise seen a decade ago, the lackluster economy and falling factory prices draw uncomfortable parallels. As with today’s AI boom, new technologies from the “Internet Plus” initiative to big data were fueling fervor back then.
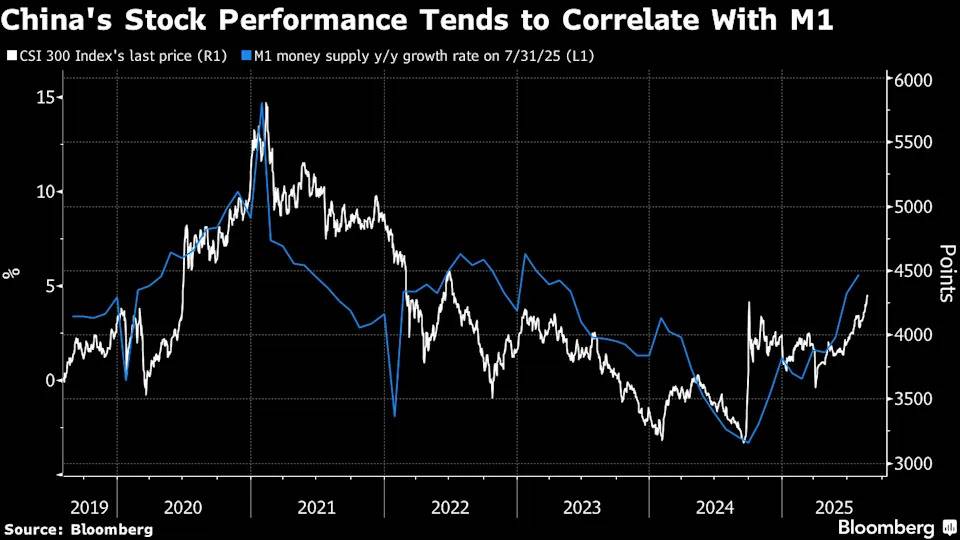
The amount of outstanding margin debt is at 2.1 trillion yuan ($292 billion), compared to 2.3 trillion yuan at the 2015 peak. China’s equity gains tend to have strong correlations with liquidity as well as margin balances.
“The abundant liquidity in the market and the gradual wake-up of animal spirits remind us of the crazy times a decade ago,” said Hao Hong, chief investment officer at Lotus Asset Management Ltd. “Of course, it is still early days.”
Slow Bull
There are, of course, reasons to believe the ongoing gains can be sustained. The pace of increase in equity positions has been more measured compared to some past cycles. And in recent days, the rally has broadened out to include a wider swathe of the market, indicating more durable momentum.
“There are larger deposit reservoirs, stronger technology companies, and more direct market rescue policies, all of which are far stronger than a decade ago,” said Zhu Zhenxin, head of Asymptote Investment Research in Beijing.
Despite those supportive factors, China’s uncertain macro backdrop is making some analysts more selective. Jasmine Duan, senior investment strategist at RBC Wealth Management Asia, said she’s avoiding sectors where profits are affected by a deflationary environment, or highly competitive sectors that are seeing margin pressures.
China’s bull market “is more of a mystery box than a conventional growth story,” said Hebe Chen, an analyst at Vantage Markets in Melbourne. “The risk is that once sentiment fades, investors would flee in no time.”
—With assistance from Yujing Liu.
©2025 Bloomberg L.P.
728 RM B 7/F GEE LOK IND BLDG NO 34 HUNG TO RD KWUN TONG KLN HONG KONG


The risk of loss in trading financial instruments such as stocks, FX, commodities, futures, bonds, ETFs and crypto can be substantial. You may sustain a total loss of the funds that you deposit with your broker. Therefore, you should carefully consider whether such trading is suitable for you in light of your circumstances and financial resources.
No decision to invest should be made without thoroughly conducting due diligence by yourself or consulting with your financial advisors. Our web content might not suit you since we don't know your financial conditions and investment needs. Our financial information might have latency or contain inaccuracy, so you should be fully responsible for any of your trading and investment decisions. The company will not be responsible for your capital loss.
Without getting permission from the website, you are not allowed to copy the website's graphics, texts, or trademarks. Intellectual property rights in the content or data incorporated into this website belong to its providers and exchange merchants.
Not Logged In
Log in to access more features


Log In
Sign Up


