- WTI
- XAUUSD
- XAGUSD
- USDX


Markets
Analysis
User
24/7
Economic Calendar
Education
Data
- Names
- Latest
- Prev












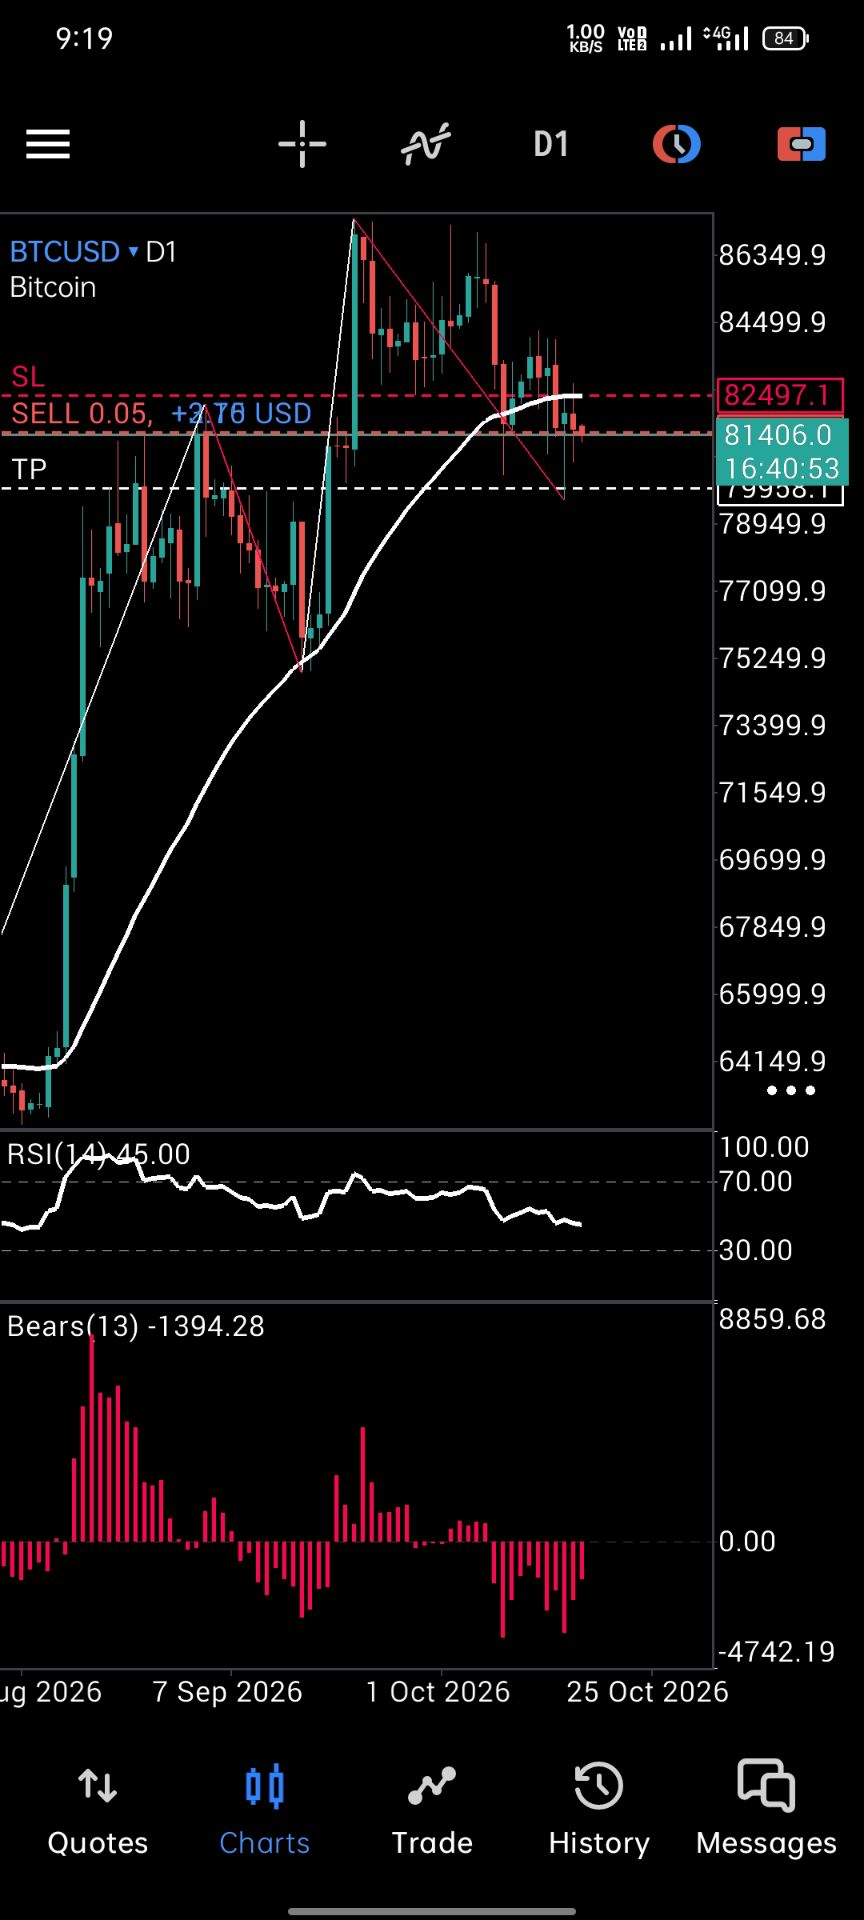
After bouncing 2.6% from recent lows, Bitcoin (BTC) has been attempting to turn the $82,000-$83,000 area into support. Some analysts have warned that the cryptocurrency must hold the crucial macro support levels or it will “confirm bearish acceleration.”
Bitcoin To Drop 76% From its Peak
On Thursday, Bitcoin crashed alongside the rest of the market, retracing nearly 9% in a day toward the $81,314 area. BTC had been trading between $86,000-$93,500 since early November, closing above the lower boundary of its two-month range in the weekly timeframe despite constant volatility.
At the moment, the flagship cryptocurrency has lost this key support in the daily timeframe and risks a deeper correction if the price doesn’t recover the $86,000 level before the end of the week.
As the price hovers between levels not seen since the late November correction, a market observer has warned that the leading cryptocurrency has lost its 100-week Exponential Moving Average (EMA) as support.
Ted Pillows asserted that the last two times Bitcoin had a weekly close below the 100-week EMA, back in 2018 and 2022, it dropped 50% in just 4-6 weeks. Moreover, he highlighted BTC’s historical pattern, noting that the cryptocurrency has repeated a similar performance between the 2017-2018 and 2021-2022 cycles.
The chart shows an eight-year ascending trendline that has marked the top of the previous cycles. The trendline began during the late 2017 peak and continued into the next bull market, marking the 2021 cycle top too.
Notably, the 2018 bear market correction saw Bitcoin retrace 83.11% from the ascending trendline, while the 2022 pullback had BTC dropping 77.57% from the cycle top. Per the chart, this has formed a rising support line that has marked where BTC’s price bottomed during previous bear markets.
Now, Bitcoin has seemingly topped around the trendline once again and could retrace up to 76.88% toward the $30,000 mark in 2026, if history repeats.
BTC Retests Macro Triangle Bottom
Analyst Rekt Capital also shared his perspective on BTC’s recent pullback now that it has broken down from its weekly price range and is revisiting the $82,500 bottom of its Macro Triangle formation.
The analyst explained that Bitcoin has been forming a triangle pattern in the monthly timeframe since mid-2024, similar to its 2021 triangle formation that preceded the previous bear market.
Per the analysis, the flagship crypto has shown a nearly identical price action to its 2021-2022 performance, with the price respecting the macro support and descending resistance.
A breakdown from the macro triangle bottom “would confirm Bearish Acceleration,” he noted, adding that for bull market continuation, the cryptocurrency would need to break and hold above the macro descending resistance on longer timeframes.
“Until then, we have more evidence that maybe we will be following 2021 [performance]. (…) It’s just a little bit more compressed.”
He also pointed out that BTC is displaying a similar Bull Market EMAs crossover that occurred during the early stages of the previous bear market.
Rekt Capital highlighted that the imminent crossover does not necessarily predict additional downside, but “is effectively confirming weakness, kind of responding to the weakness that we are already seeing and have seen for a while.”
“History is suggesting to us that if we continue to make these macro lower highs, which are a result of weakening demand at historical support regions, then there’s more reason to be bearish rather than bullish,” he concluded.

728 RM B 7/F GEE LOK IND BLDG NO 34 HUNG TO RD KWUN TONG KLN HONG KONG





The risk of loss in trading financial instruments such as stocks, FX, commodities, futures, bonds, ETFs and crypto can be substantial. You may sustain a total loss of the funds that you deposit with your broker. Therefore, you should carefully consider whether such trading is suitable for you in light of your circumstances and financial resources.
No decision to invest should be made without thoroughly conducting due diligence by yourself or consulting with your financial advisors. Our web content might not suit you since we don't know your financial conditions and investment needs. Our financial information might have latency or contain inaccuracy, so you should be fully responsible for any of your trading and investment decisions. The company will not be responsible for your capital loss.
Without getting permission from the website, you are not allowed to copy the website's graphics, texts, or trademarks. Intellectual property rights in the content or data incorporated into this website belong to its providers and exchange merchants.
Not Logged In
Log in to access more features


Log In
Sign Up