• Trade
  • Markets
  • Copy
  • Contests
  • 24/7
  • Calendar
  • Q&A
  • Chats
Screeners
SYMBOL
LAST
BID
ASK
HIGH
LOW
NET CHG.
%CHG.
SPREAD
SPX
S&P 500 Index
6795.98
6795.98
6795.98
6810.45
6636.05
+55.96
+ 0.83%
--
DJI
Dow Jones Industrial Average
47740.79
47740.79
47740.79
47876.06
46615.52
+239.25
+ 0.50%
--
IXIC
NASDAQ Composite Index
22695.94
22695.94
22695.94
22741.03
22061.97
+308.27
+ 1.38%
--
USDX
US Dollar Index
98.660
98.660
98.740
98.890
98.590
-0.050
-0.05%
--
EURUSD
Euro / US Dollar
1.16325
1.16325
1.16332
1.16454
1.16068
-0.00036
-0.03%
--
GBPUSD
Pound Sterling / US Dollar
1.34550
1.34550
1.34560
1.34648
1.34132
+0.00135
+ 0.10%
--
XAUUSD
Gold / US Dollar
5173.58
5173.58
5174.01
5187.00
5117.59
+35.06
+ 0.68%
--
WTI
Light Sweet Crude Oil
86.706
86.706
86.736
89.142
82.471
+3.566
+ 4.29%
--

Community Accounts

Signal Accounts
--
Profit Accounts
--
Loss Accounts
--
View More

Become a signal provider

Sell trading signals to earn additional income

View More

Guide to Copy Trading

Get started with ease and confidence

View More

Signal Accounts for Members

All Signal Accounts

Best Return
  • Best Return
  • Best P/L
  • Best MDD
Past 1W
  • Past 1W
  • Past 1M
  • Past 1Y

All Contests

  • All
  • Trump Updates
  • Recommend
  • Stocks
  • Cryptocurrencies
  • Central Banks
  • Featured News
Top News Only
Share

JERA President Okuda:There Will Be No Immediate Disruption To Our Fuel Procurement Or Electricity Supply Even Amid The Iran Crisis

Share

Malaysia Benchmark Crude Palm Oil Futures Fall 3.07% To 4427 Ringgit Per Metric Ton

Share

China Foreign Ministry, On Iran Conflict:Over 10000 Nationals Have Returned Safely From Gulf Countries

Share

Swedish GDP Shrinks 1.1% Month-On-Month In January

Share

Turkish Defence Ministry: One USA Patriot Air Defence System Deployed To Central Malatya Province As Part Of NATO Defences

Share

Turkish January Seasonal And Calendar-Adjusted Industrial Output -2.8% Month-On-Month

Share

Stats Office - Swedish Household Consumption +0.7% Month-On-Month In January

Share

Front-Month Dutch Wholesale Gas Price Down 11.4% At 50.0 Euros/Mwh, ICE Data Shows

Share

Stats Office - Swedish Private Sector Production -1.0 Percent Month-On-Month In Jan

Share

Turkey's Main BIST-100 Index Up 1.96%, Turkey's Main Banking Index Up 4.5% At Early Trading

Share

Egypt February Urban Consumer Inflation Rate Rises To 13.4% Year-On-Year

Share

Saudi Aramco CEO: We Are Bringing East West Pipeline To Full Capacity In The Next Couple Of Days As Customers Arrive To Loading Terminals

Share

Saudi Aramco CEO: There Is 180 Million Barrels Of Disruption So Far

Share

Qatar's Share Index Up 1% In Early Trade - Lseg

Share

Saudi Aramco CEO: We Don't Disclose How Much Production We Do, We Are Meeting Internal Demands And Supplying 7 Million Barrels/Day Via The East-West Pipleine

Share

India Trade Minister: Government To Take Steps To Provide Insurance , Shipping Support To Affected Exporters Following Iran Crisis

Share

Saudi Aramco CEO: We Work On Various Scenarios To Make Sure System Has Ample Storage Flexbility, Internationally We Can Tap Our Global Storage Hubs

Share

Saudi Aramco CEO: The Disruption Has Caused Severe Chain Reaction In Not Only Shipping And Insurance But There's A Drastic Domino Effect On Aviation, Agriculture, Automotive And Other Industries

Share

Saudi Aramco CEO: There Would Be Catastrophic Consequences For The World's Oil Markets The Longer The Disruption Goes On, And The More Drastic The Consequences For The Global Economy

Share

Saudi Aramco CEO: With Current Geopolitical Crisis, Global Investories Already At A Five-Year Low, We Will See Faster Drawdowns

TIME
ACT
FCST
PREV
Japan Trade Balance (Customs Data) (SA) (Jan)

A:--

F: --

P: --

China, Mainland CPI MoM (Feb)

A:--

F: --

P: --

China, Mainland PPI YoY (Feb)

A:--

F: --

P: --

China, Mainland CPI YoY (Feb)

A:--

F: --

P: --

Japan Leading Indicators Prelim (Jan)

A:--

F: --

P: --

Germany Industrial Output MoM (SA) (Jan)

A:--

F: --

P: --
Euro Zone Sentix Investor Confidence Index (Mar)

A:--

F: --

P: --

Mexico Core CPI YoY (Feb)

A:--

F: --

P: --

Canada National Economic Confidence Index

A:--

F: --

P: --

Mexico 12-Month Inflation (CPI) (Feb)

A:--

F: --

P: --

Mexico PPI YoY (Feb)

A:--

F: --

P: --

Mexico CPI YoY (Feb)

A:--

F: --

P: --

U.S. Conference Board Employment Trends Index (SA) (Feb)

A:--

F: --

P: --
China, Mainland M2 Money Supply YoY (Feb)

--

F: --

P: --

China, Mainland M1 Money Supply YoY (Feb)

--

F: --

P: --

China, Mainland M0 Money Supply YoY (Feb)

--

F: --

P: --

Japan Nominal GDP Revised QoQ (Q4)

A:--

F: --

P: --

Japan GDP Annualized QoQ Revised (Q4)

A:--

F: --

P: --

U.K. BRC Overall Retail Sales YoY (Feb)

A:--

F: --

P: --

U.K. BRC Like-For-Like Retail Sales YoY (Feb)

A:--

F: --

P: --

China, Mainland Exports YoY (CNH) (Feb)

A:--

F: --

P: --

China, Mainland Imports (CNH) (Feb)

A:--

F: --

P: --

China, Mainland Exports (Feb)

A:--

F: --

P: --

China, Mainland Imports YoY (CNH) (Feb)

A:--

F: --

P: --

China, Mainland Imports YoY (USD) (Feb)

A:--

F: --

P: --

China, Mainland Exports YoY (USD) (Feb)

A:--

F: --

P: --

China, Mainland Trade Balance (CNH) (Feb)

A:--

F: --

P: --

China, Mainland Trade Balance (USD) (Feb)

A:--

F: --

P: --

Indonesia Retail Sales YoY (Jan)

A:--

F: --

P: --

Germany Exports MoM (SA) (Jan)

A:--

F: --

P: --

France Trade Balance (SA) (Jan)

--

F: --

P: --

France Current Account (Not SA) (Jan)

--

F: --

P: --

Italy PPI YoY (Jan)

--

F: --

P: --

South Africa GDP YoY (Q4)

--

F: --

P: --

U.S. NFIB Small Business Optimism Index (SA) (Feb)

--

F: --

P: --

Germany 2-Year Schatz Auction Avg. Yield

--

F: --

P: --

U.S. Weekly Redbook Index YoY

--

F: --

P: --

U.S. Existing Home Sales Annualized Total (Feb)

--

F: --

P: --

U.S. Existing Home Sales Annualized MoM (Feb)

--

F: --

P: --

U.S. EIA Natural Gas Production Forecast For The Next Year (Mar)

--

F: --

P: --

U.S. EIA Short-Term Crude Production Forecast For The Next Year (Mar)

--

F: --

P: --

U.S. EIA Short-Term Crude Production Forecast For The Year (Mar)

--

F: --

P: --

EIA Monthly Short-Term Energy Outlook
U.S. 3-Year Note Auction Yield

--

F: --

P: --

U.S. API Weekly Cushing Crude Oil Stocks

--

F: --

P: --

U.S. API Weekly Crude Oil Stocks

--

F: --

P: --

U.S. API Weekly Refined Oil Stocks

--

F: --

P: --

U.S. API Weekly Gasoline Stocks

--

F: --

P: --

Japan Domestic Enterprise Commodity Price Index YoY (Feb)

--

F: --

P: --

Japan Domestic Enterprise Commodity Price Index MoM (Feb)

--

F: --

P: --

Japan PPI MoM (Feb)

--

F: --

P: --

Germany CPI Final YoY (Feb)

--

F: --

P: --

Germany CPI Final MoM (Feb)

--

F: --

P: --

Germany HICP Final YoY (Feb)

--

F: --

P: --

Germany HICP Final MoM (Feb)

--

F: --

P: --

Turkey Retail Sales YoY (Jan)

--

F: --

P: --

Italy 12-Month BOT Auction Avg. Yield

--

F: --

P: --

Germany 10-Year Bund Auction Avg. Yield

--

F: --

P: --

U.S. MBA Mortgage Application Activity Index WoW

--

F: --

P: --

Brazil Retail Sales MoM (Jan)

--

F: --

P: --

Q&A with Experts
    • All
    • Chatrooms
    • Groups
    • Friends
    Connecting
    .
    .
    .
    Type here...
    Add Symbol or Code

      No matching data

      All
      Trump Updates
      Recommend
      Stocks
      Cryptocurrencies
      Central Banks
      Featured News
      • All
      • Russia-Ukraine Conflict
      • Middle East Flashpoint
      • All
      • Russia-Ukraine Conflict
      • Middle East Flashpoint
      Search
      Products

      Charts Free Forever

      Chats Q&A with Experts
      Screeners Economic Calendar Data Tools
      Membership Features
      Data Warehouse Market Trends Institutional Data Policy Rates Macro

      Market Trends

      Market Sentiment Order Book Forex Correlations

      Top Indicators

      Charts Free Forever
      Markets

      News

      24/7 Analysis Education

      Latest Views

      Latest Update

      Signals

      Copy Rankings Latest Signals Become a signal provider AI Rating
      Contests
      Brokers

      Overview Brokers Assessment Rankings Regulators News Claims
      Broker listing Forex Brokers Comparison Tool Live Spread Comparison Scam
      Q&A Complaint Scam Alert Videos Tips to Detect Scam
      More

      Business
      Events
      Careers About Us Advertising Help Center

      White Label

      Broker API

      Data API

      Web Plug-ins

      Affiliate Program

      Awards Institution Evaluation IB Seminar Salon Event Exhibition
      Vietnam Thailand Singapore Dubai
      Fans Party Investment Sharing Session
      FastBull Summit BrokersView Expo
      Recent Searches
        Top Searches
          Markets
          Analysis
          User
          24/7
          Economic Calendar
          Education
          Data
          • Names
          • Latest
          • Prev

          View All

          No data

          Scan to Download

          Faster Charts, Chat Faster!

          Download App
          English
          • English
          • Español
          • العربية
          • Bahasa Indonesia
          • Bahasa Melayu
          • Tiếng Việt
          • ภาษาไทย
          • Français
          • Italiano
          • Türkçe
          • Русский язык
          • 简中
          • 繁中
          Open Account
          Search
          Products
          Charts Free Forever
          Markets
          News
          Signals

          Copy Rankings Latest Signals Become a signal provider AI Rating
          Contests
          Brokers

          Overview Brokers Assessment Rankings Regulators News Claims
          Broker listing Forex Brokers Comparison Tool Live Spread Comparison Scam
          Q&A Complaint Scam Alert Videos Tips to Detect Scam
          More

          Business
          Events
          Careers About Us Advertising Help Center

          White Label

          Broker API

          Data API

          Web Plug-ins

          Affiliate Program

          Awards Institution Evaluation IB Seminar Salon Event Exhibition
          Vietnam Thailand Singapore Dubai
          Fans Party Investment Sharing Session
          FastBull Summit BrokersView Expo

          Bitcoin reclaims $115K: Watch these BTC price levels next

          Cointelegraph
          Cardano / Tether
          +1.88%
          1inch / Tether
          +2.15%
          Vaulta / Tether
          -0.26%
          AAVE / Tether
          +2.84%

          Key takeaways:

          • Bitcoin price rose 1.5% to over $115,000, with onchain indicators suggesting market momentum is picking up.

          • BTC must hold above $115,000 to secure the recovery, with resistance at $116,000-$121,000.

          Bitcoin price was up on Friday, rising 1.5% over the past 24 hours to trade above $115,000. Several technical and onchain indicators suggest the BTC market is “advancing on firmer footing” to higher levels, according to Glassnode.

          Bitcoin derivatives “set the tone” for BTC price

          Bitcoin’s ability to stage a sustained recovery has been curtailed by weak spot demand and softening ETF inflows.

          “Attention now shifts to derivatives markets, which often set the tone when spot flows weaken,” Glassnode wrote in its latest Week Onchain report.

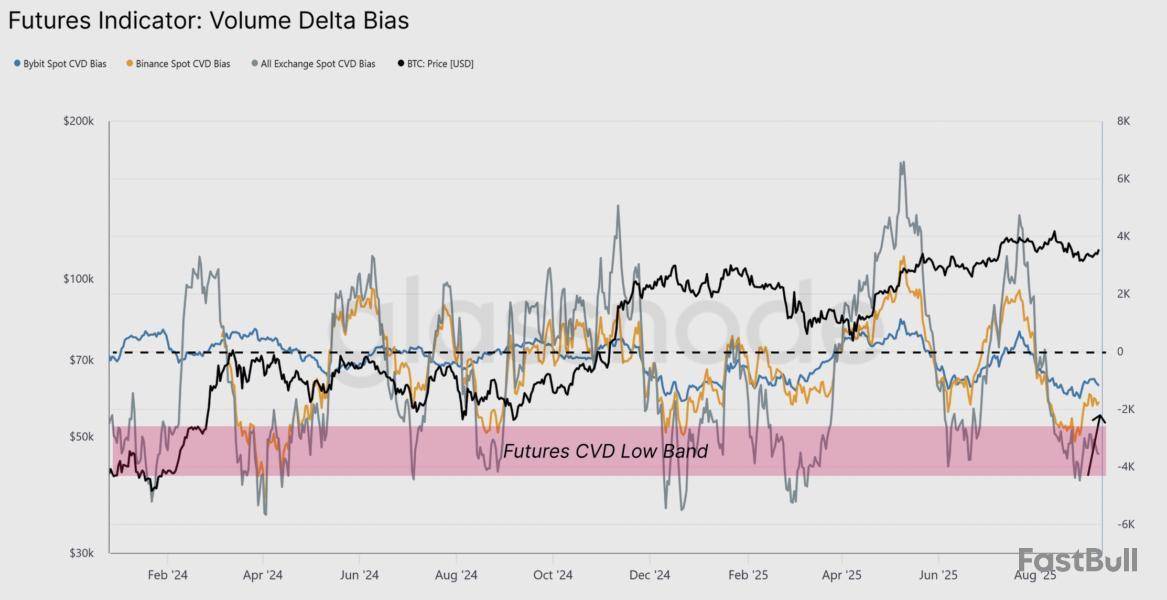
          The chart below shows that Bitcoin’s volume delta bias, measuring the imbalance between buying and selling pressure, recovered during the rebound from $108,000, signaling seller exhaustion across exchanges like Binance and Bybit.

          This suggests that futures traders “helped absorb recent sell pressure,” said the market intelligence firm, adding:

          “​​Going forward, the evolution of derivatives positioning will be critical to navigating the market in this low spot-liquidity environment.”

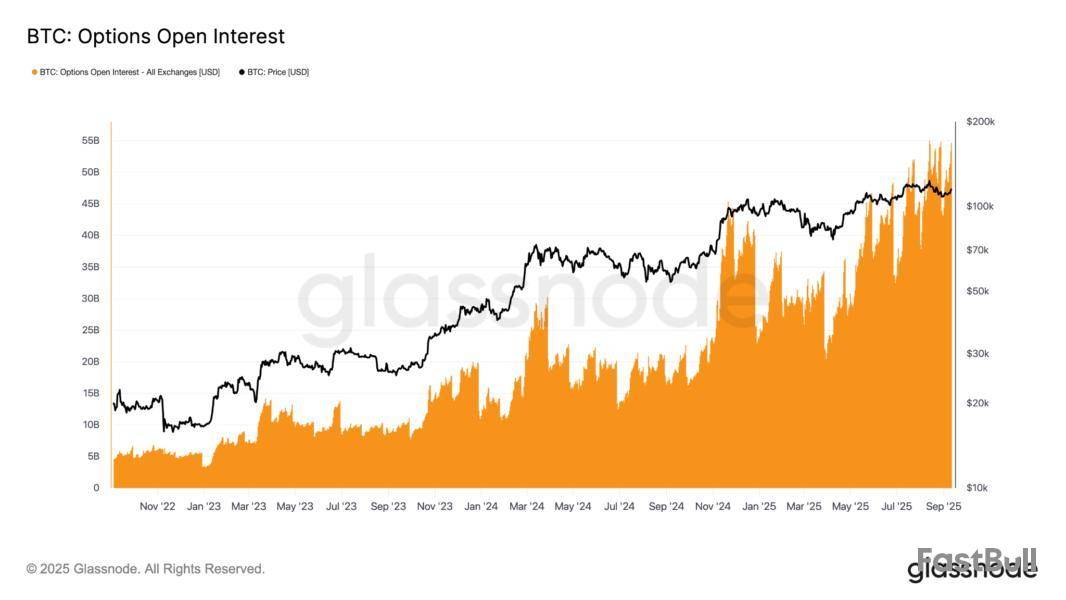
          Meanwhile, options open interest (OI) reached $54.6 billion, an all-time high, up 26% from $43 billion on Sept. 1. This reflects growing investor interest in the derivatives market, which can positively affect BTC price.

          Note that when options OI reached its previous record high in mid-August, it was accompanied by Bitcoin's rise to new all-time highs above $124,500.

          Additional options OI data shows a clear bias toward calls over puts, “highlighting a market that leans bullish while still managing downside risk,” Glassnode said, adding:

          “Both futures basis and options positioning reflect a more balanced structure than in past overheated phases, pointing to a market advancing on firmer footing.”

          As Cointelegraph reported, Bitcoin’s $4.3 billion options expiry on Friday favors bullish bets, and could open the door for BTC rally to $120,000 as long as the price stays above $113,000.

          Key Bitcoin price levels to watch next

          Data from Cointelegraph Markets Pro and TradingView shows Bitcoin price trading at $115,400 after running into resistance around $116,000. The pair must hold above $115,000 for a sustained recovery.

          There is a major supply zone stretching from $116,000 to $121,000, which Bitcoin will have to overcome to continue its uptrend toward all-time highs.

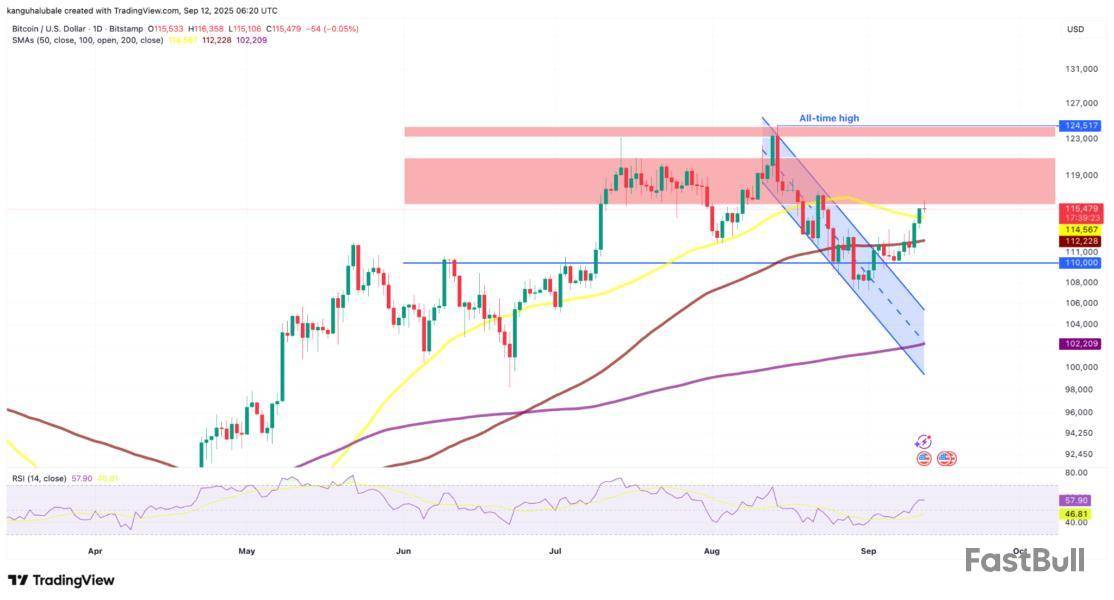
          Conversely, the bears will attempt to defend the $116,000 level and push the price back down. A key area of interest lies between $114,500, where the 50-day simple moving average (SMA) currently sits, and $112,200, embraced by the 100-day SMA.

          Another area of importance stretches from the local low at $107,200 (reached on Sept. 1) to the $110,000 psychological level.

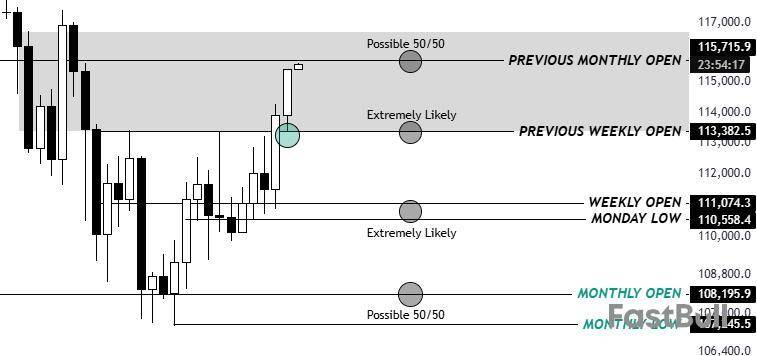
          Bitcoin is “now pushing to the previous monthly open,” said pseudonymous trader KillaXBT in an analysis on X, referring to the August open around $115,700.

          “This is a crucial pivot point in terms of trend direction. We could see some deviation above, as always.”

          The liquidation heatmap shows the liquidity clusters between $116,400 and $117,000, per data from CoinGlass.

          If broken, this level could spark a liquidation squeeze, forcing short sellers to close positions and driving prices toward $120,000.

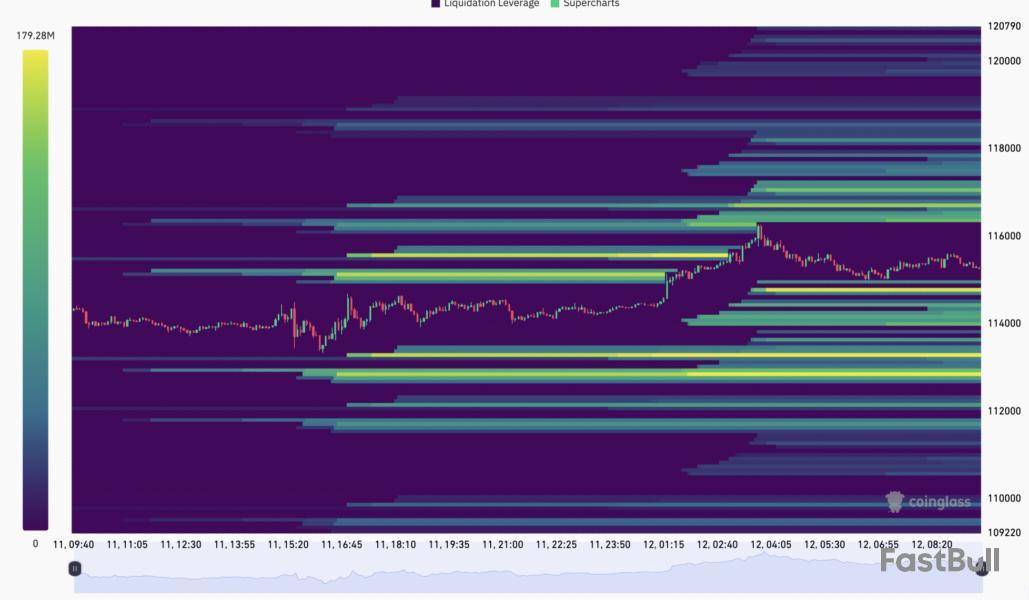
          On the downside, heavy bid orders are sitting around $114,700, with the next major cluster sitting between $113,500 down to $112,000.

          This article does not contain investment advice or recommendations. Every investment and trading move involves risk, and readers should conduct their own research when making a decision.

          Risk Warnings and Disclaimers
          You understand and acknowledge that there is a high degree of risk involved in trading. Following any strategies or investment methods may lead to potential losses. The content on the site is provided by our contributors and analysts for information purposes only. You are solely responsible for determining whether any trading assets, securities, strategy, or any other product is suitable for investing based on your own investment objectives and financial situation.
          Add to Favorites
          Share
          FastBull
          Copyright © 2026 FastBull Ltd

          728 RM B 7/F GEE LOK IND BLDG NO 34 HUNG TO RD KWUN TONG KLN HONG KONG

          TelegramInstagramTwitterfacebooklinkedin
          App Store Google Play Google Play
          Products
          Charts

          Chats

          Q&A with Experts
          Screeners
          Economic Calendar
          Data
          Tools
          Membership
          Features
          Function
          Markets
          Copy Trading
          Latest Signals
          Contests
          24/7
          Analysis
          Education
          Company
          Careers
          About Us
          Contact Us
          Advertising
          Help Center
          Feedback
          User Agreement
          Privacy Policy
          Personal Information Protection Statement
          Business

          White Label

          Broker API

          Data API

          Web Plug-ins

          Poster Maker

          Affiliate Program

          Risk Disclosure

          The risk of loss in trading financial instruments such as stocks, FX, commodities, futures, bonds, ETFs and crypto can be substantial. You may sustain a total loss of the funds that you deposit with your broker. Therefore, you should carefully consider whether such trading is suitable for you in light of your circumstances and financial resources.

          No decision to invest should be made without thoroughly conducting due diligence by yourself or consulting with your financial advisors. Our web content might not suit you since we don't know your financial conditions and investment needs. Our financial information might have latency or contain inaccuracy, so you should be fully responsible for any of your trading and investment decisions. The company will not be responsible for your capital loss.

          Without getting permission from the website, you are not allowed to copy the website's graphics, texts, or trademarks. Intellectual property rights in the content or data incorporated into this website belong to its providers and exchange merchants.

          Not Logged In

          Log in to access more features

          Connect Broker
          Become a signal provider
          Help Center
          Customer Service
          Dark Mode
          Price Up/Down Colors

          Log In

          Sign Up

          Position
          Layout
          Fullscreen
          Default to Chart
          The chart page opens by default when you visit fastbull.com