Markets
Analysis
User
24/7
Economic Calendar
Education
Data
- Names
- Latest
- Prev


Signal Accounts for Members
All Signal Accounts
All Contests


Citigroup: Federal Reserve Chairman Nominee Kevin Warsh May Gradually Shrink The Balance Sheet (quantitative Tightening) To Avoid Reigniting Tensions In The Money Markets
The Onshore Yuan (Cny) Closed At 6.9208 Against The US Dollar At 03:00 Beijing Time, Up 146 Points From Friday Night's Close. Trading Volume Was US$44.184 Billion
South Africa's Agricultural Exports Hit A Record High, Despite A Sharp Decline In Trade With The US. South Africa's Total Agricultural Exports Are Projected To Reach $15.1 Billion By 2025, A 10% Increase From The Previous Year. Affected By Tariffs Imposed By US President Trump, South African Exports To The US Plummeted By 39% In The Fourth Quarter, But Some Products (such As Oranges And Macadamia Nuts) Were Subsequently Exempted. Faced With Tariff Pressure, South Africa Is Actively Expanding Into Asian And African Domestic Markets, Having Signed Several Access And Tax Reduction Agreements With Multiple Countries
Federal Reserve Governor Waller: I Had Hoped That The Fed’s “streamlined Account” Could Preemptively Resolve Legal Disputes
Federal Reserve Governor Waller: Details Of The Cryptocurrency Bill Appear To Be Stuck On Capitol Hill
USA To Turn Over Senior NATO Command Posts In Naples, Italy And Norfolk, Virginia To European Allies - Military Source
Descartes: US Container Imports Fell 6.8% In January, But Result Points To More Normalized Trade

Canada Part-Time Employment (SA) (Jan)A:--
F: --
Canada Unemployment Rate (SA) (Jan)A:--
F: --
P: --
Canada Labor Force Participation Rate (SA) (Jan)A:--
F: --
P: --
Due to the previous government shutdown, the release date of the US January non-farm payroll report has been changed to February 11.
U.S. UMich Consumer Sentiment Index Prelim (Feb)A:--
F: --
P: --
U.S. UMich Consumer Expectations Index Prelim (Feb)A:--
F: --
P: --
Canada Ivey PMI (Not SA) (Jan)A:--
F: --
P: --
U.S. UMich Current Economic Conditions Index Prelim (Feb)A:--
F: --
P: --
Canada Ivey PMI (SA) (Jan)A:--
F: --
P: --
U.S. UMich 5-Year-Ahead Inflation Expectations Prelim YoY (Feb)A:--
F: --
P: --
U.S. UMich 1-Year-Ahead Inflation Expectations Prelim (Feb)A:--
F: --
P: --
U.S. 5-10 Year-Ahead Inflation Expectations (Feb)A:--
F: --
P: --
Russia Retail Sales YoY (Dec)A:--
F: --
P: --
Russia Unemployment Rate (Dec)A:--
F: --
P: --
Russia Quarterly GDP Prelim YoY (Q1)--
F: --
P: --
U.S. Weekly Total Oil Rig CountA:--
F: --
P: --
U.S. Weekly Total Rig CountA:--
F: --
P: --
U.S. Consumer Credit (SA) (Dec)A:--
F: --
China, Mainland Foreign Exchange Reserves (Jan)A:--
F: --
P: --
Japan Wages MoM (Dec)A:--
F: --
P: --
Japan Trade Balance (Customs Data) (SA) (Dec)A:--
F: --
P: --
Japan Trade Balance (Dec)A:--
F: --
P: --
Euro Zone Sentix Investor Confidence Index (Feb)A:--
F: --
P: --
Mexico CPI YoY (Jan)A:--
F: --
P: --
Mexico 12-Month Inflation (CPI) (Jan)A:--
F: --
P: --
Mexico PPI YoY (Jan)A:--
F: --
P: --
Mexico Core CPI YoY (Jan)A:--
F: --
P: --
ECB Chief Economist Lane Speaks
Canada National Economic Confidence IndexA:--
F: --
P: --
China, Mainland M0 Money Supply YoY (Jan)--
F: --
P: --
China, Mainland M2 Money Supply YoY (Jan)--
F: --
P: --
China, Mainland M1 Money Supply YoY (Jan)--
F: --
P: --
ECB President Lagarde Speaks
U.K. BRC Overall Retail Sales YoY (Jan)--
F: --
P: --
U.K. BRC Like-For-Like Retail Sales YoY (Jan)--
F: --
P: --
Indonesia Retail Sales YoY (Dec)--
F: --
P: --
France ILO Unemployment Rate (SA) (Q4)--
F: --
P: --
U.S. NFIB Small Business Optimism Index (SA) (Jan)--
F: --
P: --
Brazil IPCA Inflation Index YoY (Jan)--
F: --
P: --
Brazil CPI YoY (Jan)--
F: --
P: --
U.S. Retail Sales (Dec)--
F: --
P: --
U.S. Retail Sales YoY (Dec)--
F: --
P: --
U.S. Labor Cost Index QoQ (Q4)--
F: --
P: --
U.S. Import Price Index MoM (Dec)--
F: --
P: --
U.S. Export Price Index YoY (Dec)--
F: --
P: --
U.S. Export Price Index MoM (Dec)--
F: --
P: --
U.S. Import Price Index YoY (Dec)--
F: --
P: --
U.S. Retail Sales MoM (Dec)--
F: --
P: --
U.S. Core Retail Sales MoM (Dec)--
F: --
P: --
U.S. Core Retail Sales (Dec)--
F: --
P: --
U.S. Retail Sales MoM (Excl. Gas Stations & Vehicle Dealers) (SA) (Dec)--
F: --
P: --
U.S. Retail Sales MoM (Excl. Automobile) (SA) (Dec)--
F: --
P: --
U.S. Weekly Redbook Index YoY--
F: --
P: --
U.S. Commercial Inventory MoM (Nov)--
F: --
P: --
U.S. EIA Short-Term Crude Production Forecast For The Year (Feb)--
F: --
P: --
U.S. EIA Short-Term Crude Production Forecast For The Next Year (Feb)--
F: --
P: --
U.S. EIA Natural Gas Production Forecast For The Next Year (Feb)--
F: --
P: --
EIA Monthly Short-Term Energy Outlook
FOMC Member Hammack Speaks
U.S. 3-Year Note Auction Yield--
F: --
P: --


No matching data
Bitcoin’s price plunged nearly 5% on Tuesday. Consequently, this action triggered concerns among analysts that the cryptocurrency is approaching a technical breakdown akin to the start of previous bear cycles.
Experts warn that failure to reclaim the $102,000 level quickly would significantly heighten market risk.
The Bear Market Confirmation Line
Julio Moreno, Head of Research at the on-chain data platform CryptoQuant, stated on his X account Wednesday that Bitcoin’s price has now dropped below its 365-day Moving Average (MA).
The 365-day MA holds unique significance in the technical analysis of Bitcoin’s historical price action. Moreno emphasized its predictive power, noting, “It was the final confirmation of the start of the 2022 bear market.”

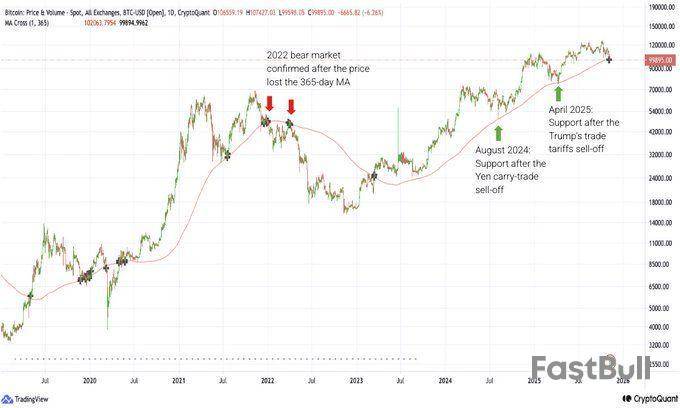
The chart analysis shows that the last price to sink below the 365-day MA was in December 2022. The price attempted to bounce back toward the line in March 2023 but failed to break above it. This failure led to a year-long downward trend that defined the “crypto winter.”
Bitcoin’s substantial breach of the 365-day MA in March 2023 marked the official end of that bear market. Following that breakout, the price consolidated sideways for about a year before initiating the strong uptrend toward the end of 2023.
MA Serves as Critical Support in Uptrends
During the bull run, the 365-day MA has consistently been a crucial support level.
The pattern confirms that a temporary price drop should bounce in a healthy uptrend and receive support near the 365-day MA.
According to Julio Moreno, the 365-day MA currently sits at $102,063. He delivered a clear warning regarding the immediate outlook: “The price needs to cross back above it quickly.”
This is consistent with the ‘Top Buyers Cost Basis Distribution‘ metric recently cited by Glassnode. This metric assesses the market situation using the average acquisition price of Bitcoin’s highest-price purchasers.
The average acquisition price for the top 25% of these high-cost buyers currently sits near $100,000. Notably, Bitcoin’s price has not dropped below this level in the last two years.
The risk of loss in trading financial instruments such as stocks, FX, commodities, futures, bonds, ETFs and crypto can be substantial. You may sustain a total loss of the funds that you deposit with your broker. Therefore, you should carefully consider whether such trading is suitable for you in light of your circumstances and financial resources.
No decision to invest should be made without thoroughly conducting due diligence by yourself or consulting with your financial advisors. Our web content might not suit you since we don't know your financial conditions and investment needs. Our financial information might have latency or contain inaccuracy, so you should be fully responsible for any of your trading and investment decisions. The company will not be responsible for your capital loss.
Without getting permission from the website, you are not allowed to copy the website's graphics, texts, or trademarks. Intellectual property rights in the content or data incorporated into this website belong to its providers and exchange merchants.
Not Logged In
Log in to access more features
Log In
Sign Up