Markets
News
Analysis
User
24/7
Economic Calendar
Education
Data
- Names
- Latest
- Prev


Signal Accounts for Members
All Signal Accounts
All Contests


Turkey Trade BalanceA:--
F: --
P: --
Germany Construction PMI (SA) (Nov)A:--
F: --
P: --
Euro Zone IHS Markit Construction PMI (Nov)A:--
F: --
P: --
Italy IHS Markit Construction PMI (Nov)A:--
F: --
P: --
U.K. Markit/CIPS Construction PMI (Nov)A:--
F: --
P: --
France 10-Year OAT Auction Avg. YieldA:--
F: --
P: --
Euro Zone Retail Sales MoM (Oct)A:--
F: --
P: --
Euro Zone Retail Sales YoY (Oct)A:--
F: --
P: --
Brazil GDP YoY (Q3)A:--
F: --
P: --
U.S. Challenger Job Cuts (Nov)A:--
F: --
P: --
U.S. Challenger Job Cuts MoM (Nov)A:--
F: --
P: --
U.S. Challenger Job Cuts YoY (Nov)A:--
F: --
P: --
U.S. Initial Jobless Claims 4-Week Avg. (SA)A:--
F: --
P: --
U.S. Weekly Initial Jobless Claims (SA)A:--
F: --
P: --
U.S. Weekly Continued Jobless Claims (SA)A:--
F: --
P: --
Canada Ivey PMI (SA) (Nov)A:--
F: --
P: --
Canada Ivey PMI (Not SA) (Nov)A:--
F: --
P: --
U.S. Non-Defense Capital Durable Goods Orders Revised MoM (Excl. Aircraft) (SA) (Sept)A:--
F: --
U.S. Factory Orders MoM (Excl. Transport) (Sept)A:--
F: --
P: --
U.S. Factory Orders MoM (Sept)A:--
F: --
P: --
U.S. Factory Orders MoM (Excl. Defense) (Sept)A:--
F: --
P: --
U.S. EIA Weekly Natural Gas Stocks ChangeA:--
F: --
P: --
Saudi Arabia Crude Oil ProductionA:--
F: --
P: --
U.S. Weekly Treasuries Held by Foreign Central BanksA:--
F: --
P: --
Japan Foreign Exchange Reserves (Nov)A:--
F: --
P: --
India Repo RateA:--
F: --
P: --
India Benchmark Interest RateA:--
F: --
P: --
India Reverse Repo RateA:--
F: --
P: --
India Cash Reserve RatioA:--
F: --
P: --
Japan Leading Indicators Prelim (Oct)A:--
F: --
P: --
U.K. Halifax House Price Index YoY (SA) (Nov)--
F: --
P: --
U.K. Halifax House Price Index MoM (SA) (Nov)--
F: --
P: --
France Current Account (Not SA) (Oct)--
F: --
P: --
France Trade Balance (SA) (Oct)--
F: --
P: --
France Industrial Output MoM (SA) (Oct)--
F: --
P: --
Italy Retail Sales MoM (SA) (Oct)--
F: --
P: --
Euro Zone Employment YoY (SA) (Q3)--
F: --
P: --
Euro Zone GDP Final YoY (Q3)--
F: --
P: --
Euro Zone GDP Final QoQ (Q3)--
F: --
P: --
Euro Zone Employment Final QoQ (SA) (Q3)--
F: --
P: --
Euro Zone Employment Final (SA) (Q3)--
F: --
Brazil PPI MoM (Oct)--
F: --
P: --
Mexico Consumer Confidence Index (Nov)--
F: --
P: --
Canada Unemployment Rate (SA) (Nov)--
F: --
P: --
Canada Labor Force Participation Rate (SA) (Nov)--
F: --
P: --
Canada Employment (SA) (Nov)--
F: --
P: --
Canada Part-Time Employment (SA) (Nov)--
F: --
P: --
Canada Full-time Employment (SA) (Nov)--
F: --
P: --
U.S. Dallas Fed PCE Price Index YoY (Sept)--
F: --
P: --
U.S. PCE Price Index YoY (SA) (Sept)--
F: --
P: --
U.S. PCE Price Index MoM (Sept)--
F: --
P: --
U.S. Personal Outlays MoM (SA) (Sept)--
F: --
P: --
U.S. Core PCE Price Index MoM (Sept)--
F: --
P: --
U.S. UMich 5-Year-Ahead Inflation Expectations Prelim YoY (Dec)--
F: --
P: --
U.S. Core PCE Price Index YoY (Sept)--
F: --
P: --
U.S. 5-10 Year-Ahead Inflation Expectations (Dec)--
F: --
P: --
U.S. UMich Current Economic Conditions Index Prelim (Dec)--
F: --
P: --
U.S. UMich Consumer Sentiment Index Prelim (Dec)--
F: --
P: --
U.S. UMich 1-Year-Ahead Inflation Expectations Prelim (Dec)--
F: --
P: --
U.S. UMich Consumer Expectations Index Prelim (Dec)--
F: --
P: --


No matching data
Latest Views
Latest Views
Trending Topics
Top Columnists
Latest Update
White Label
Data API
Web Plug-ins
Affiliate Program
View All

No data
Bitcoin rallied 13% from multimonth lows at $80,000, reclaiming the $90,000 mark on Wednesday. This move came as a surprise as BTC repeated its historical pre-holiday rally, increasing hopes of a continued upward move going into Thanksgiving weekend.
Key takeaways:
Bitcoin stages a pre-Thanksgiving rally and seeks to defy its historical average return of -0.8% during the holiday.
Bitcoin must reclaim $100,000-$105,000 to avoid a potential breakdown below $80,000.
A rare Thanksgiving BTC price rally?
Data from Cointelegraph Markets Pro and TradingView showed the pair trading at $91,400 on Thursday, after it had climbed more than 5% on Wednesday.
“Look, we just had a bullish Wednesday too,” said Capriole Investments founder Charles Edwards, referring to a previous analysis showing the Wednesday before Thanksgiving is always bullish, followed by a bearish Thursday.
Related: Bearish Bitcoin mining data may be counter signal that encourages spot-driven BTC rally.
Traders hoped Bitcoin would continue rising higher into the Holiday, bucking the trend of its previous performance on Thanksgiving Day.
Bitcoin experienced gains on this day only in two out of the last 10 years, with large-scale declines particularly notable in 2018 and 2020. The average return is -0.8%, according to analyst Crypto Daan Trades.
Other analysts were focused on how high Bitcoin’s price could go during this year’s Thanksgiving, as it traded 4% below its highest ever close above $95,000, reached on Nov. 28, 2024.
“We have never yet had a $100K Bitcoin Thanksgiving,” fellow analyst Terence Michael said on Wednesday, urging his followers to be “prepared regardless” of the current price action.
Bitcoin is testing the $91,000-93,000 resistance area after the “first meaningful bounce in a long time,” said Jelle, noting that markets will remain closed on Thursday, Thanksgiving Day.
As Cointelegraph reported, Bitcoin’s ability to push higher in the short term is restrained by uncertainty in interest rate policy, inflation expectations, and stress in BTC derivatives.
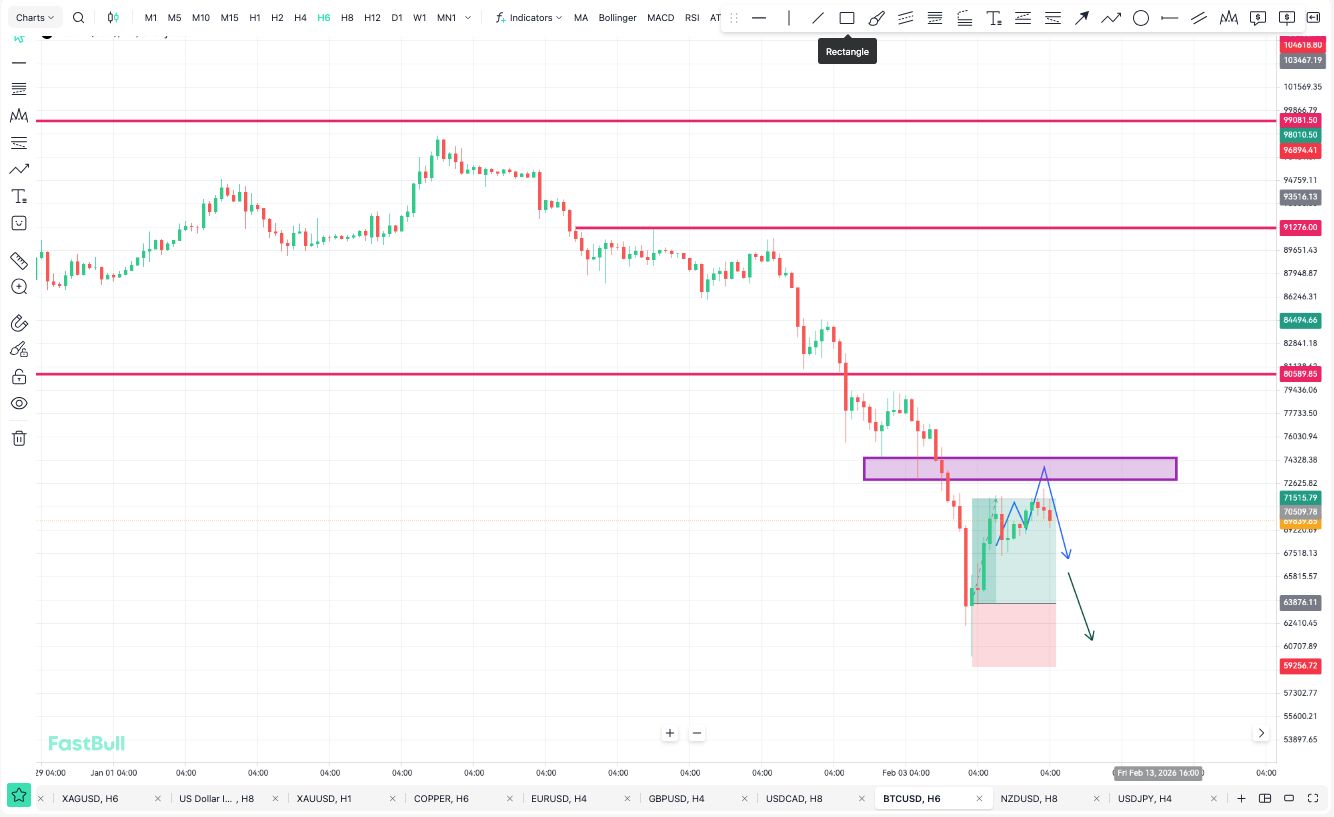
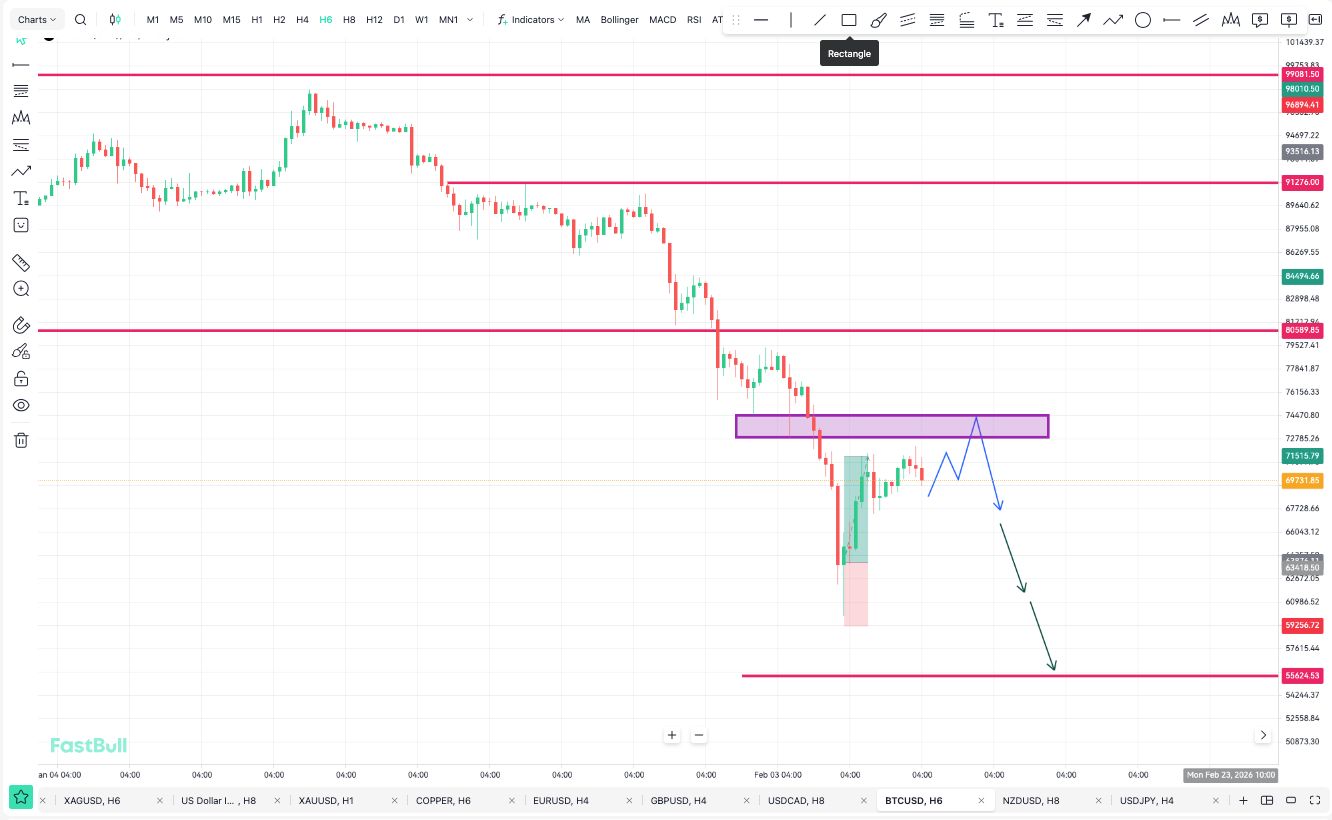
Key Bitcoin price levels to watch
Bitcoin remains structurally “fragile” after losing its 50-week moving average and key cost-basis support, according to onchain data provider Glassnode.
This structure mirrors the first quarter of 2022 post-previous all-time highs, when the “market weakened under fading demand,” Glassnode said in its latest Week Onchain report, adding:
Glassnode noted that realized losses are currently elevated, with “STH loss ratios collapsing to 0.07x, signaling fading liquidity and demand,” adding:
On the upside, the major area to be reclaimed sits between $100,000 and $105,000, Bitcoin’s STH realized price and the 50-week moving average.
These trend lines have historically served as vital support levels for the Bitcoin price and must be reclaimed to avoid further losses that could drive BTC below $80,000.
This article does not contain investment advice or recommendations. Every investment and trading move involves risk, and readers should conduct their own research when making a decision.
Ethereum (ETH) is attempting to bounce from the market’s Q4 correction, retesting the $3,000 barrier once again. As we approach the end of November, some market observers have suggested that the end-of-year rally may still be possible in the coming weeks.
Ethereum Eyes $3,000 Ahead Of Key Upgrade
On Wednesday, Ethereum experienced a 4.4% daily surge, retesting the $3,000 level for the first time in nearly a week. The cryptocurrency has been trading within the $2,680-$2,980 price range amid the latest market-wide correction, which also saw Bitcoin (BTC) lose some crucial support levels.
At the start of the week, the King of Altcoins broke above the $2,900 area, attempting to retest the next key resistance over the past two days but ultimately failing to reclaim it. Analyst Ted Pillows highlighted this performance, noting that ETH “tapped the $2,950-$3,000 zone again and got rejected.”
Per the post, until Ethereum successfully reclaims this level, “the chances of a new low are high.” On the contrary, if the cryptocurrency breaks above this zone with strong volume in the coming days, investors could “expect a rally towards the $3,400 level.”
The analyst also suggested that the altcoin could see a remarkable recovery rally next week, driven by the upcoming Fusaka upgrade. As he explained, ETH soared around 50% after the network’s Pectra upgrade in May.
As reported by NewsBTC, the upgrade introduced a series of improvements to increase transaction capacity, enhance efficiency, and reduce system stress. Following the implementation, the cryptocurrency rallied from the $1,800 level to the $2,700 area in a week, which was later followed by an 80% jump in Q3 to its latest all-time high (ATH) of $4,946.
Now, the Fusaka upgrade is the network’s biggest update since The Merge and is expected to come on December 3, “to relieve one of the network’s most pressing bottlenecks: data availability for rollups,” VanEck explained in October.
Based on this, Ted Pillows suggested that if ETH repeats its post-Pectra performance with the new upgrade, the altcoin’s price could soar above the $4,000 resistance in the next few weeks.
End-Of-Year Rally Underway?
Market watcher Merlijn The Trader also suggested that Ethereum could see another leg up soon, as it is “repeating a textbook wave structure” it has printed multiple times since hitting the bear market bottom in mid-2022.
“Wave 1: Kicked off the cycle. Wave 2: Is shaking weak hands. wave 3: Where parabolas form,” the trader explained on X, noting that ETH could be ending its corrective move and potentially see another rally in the coming weeks.
“This pattern printed 3 times before. Each time, ETH went vertical. Now it’s flashing again,” he stated. Similarly, Michaël van de Poppe highlighted Ethereum’s trading pair against Bitcoin, affirming that investors should keep an eye on the chart.
Notably, ETH is retesting a multi-month downtrend line resistance against BTC, and could “see a strong breakout upwards in the coming weeks.” “This cycle is far from over,” van de Poppe added.
Meanwhile, Rekt Capital noted that Ethereum Dominance continues to occupy an area that served as a consolidation zone before the 2021 rally. “As long as ETHDOM can maintain itself above 10.05% then it should be positioned for higher market dominance levels over time,” the analyst concluded.
As of this writing, ETH trades at $3,023, a 2% increase in the weekly timeframe.
The Bitcoin price appears to be entering a new recovery phase, as the leading cryptocurrency recaptured the $91,000 level after falling by more than 30% from all-time highs last Friday, tumbling to an 8-month low of $80,000.
Critical Bitcoin Price Range
Technical analyst Daan Crypto Trades highlighted on social media site X (formerly Twitter) on Wednesday that the critical region for investors to monitor right now is between the $89,000 and $91,000 range.
He observed that this price level acted as support in late 2024 and early 2025 before becoming a point of resistance during President Donald Trump’s recent tariff negotiations with the world’s top economies, including China.
After breaking out of this zone almost exactly one year ago, the Bitcoin price reached new highs of $109,000 in January, which held until a new uptrend in May of this year resulted in BTC reaching $112,000.
Daan emphasizes that a strong consolidation above these levels could pave the way for a rally toward the $106,000 to $108,000 range. Conversely, if Bitcoin falls back below these levels, it could revisit last week’s low of $80,000, which he identifies as the nearest support.
Bullish Sentiments Amid Caution
Another analyst, BitcoinVector, echoed Daan’s bullish sentiment but cautioned that the market remains in a high-risk environment and that the current momentum has yet to strengthen significantly.
According to BitcoinVector, steady momentum is required for Bitcoin to break out of the compression pattern that has formed since its all-time high.
He laid out the bullish path: first, the Bitcoin price must close within the $89,000 to $90,000 zone, followed by consolidation above this area, and finally, a breakout through the $93,500 to $95,000 compression band.
For this recovery to gain traction, BitcoinVector stressed the importance of a “Risk-Off Signal,” indicating that buyers must begin to overpower sellers while generating momentum. Without such momentum, each upward movement would merely be a tactical reaction rather than indicative of a structural recovery. Prolonged Bear Market Ahead?
Market analyst Skew provided additional insights, noting that the four-hour chart for Bitcoin appears more constructive for bulls. He pointed to several indicators suggesting upward momentum, including the price being above the four-hour 50 EMA, the RSI remaining above 50, and the Stochastic RSI trending higher.
Skew identifies the $88,000 mark as a crucial “line in the sand,” arguing that a drop below this level would signal weakness and a failed attempt to gain momentum.
Despite the cautious optimism from some analysts, others, like Jacob King, offer a starkly different perspective. He argues that given the Bitcoin price decline from its all-time high in October, it has never experienced such a fall followed by a sustained bull market.
According to King, Bitcoin is now in a bear market that may persist for years, poised to affect the fortunes of countless investors, particularly those heavily leveraged.
As of this writing, the Bitcoin price stands at $91,390, marking a 4% recovery within the last 24 hours. This places the cryptocurrency 27% below its all-time high.
Featured image from DALL-E, chart from TradingView.com
VeChain will talk with Rekord AG about Digital Product Passport technology and how it can help Europe’s digital growth. Such events can help VeChain’s token if they show new deals or real business use. If traders and investors see VeChain making partnerships or moving into real-world work, it could increase demand for VET. Still, talks alone may not drive a large price move unless new partnerships or solutions are revealed during the event. More about the talk is available source.
VeChain@vechainofficialNov 26, 2025Join Jake as he hosts VeChain’s new partner, @RekordAG, Friday, 6pm UTC
We’ll be talking Digital Product Passport tech - and how it’s driving the EU’s digital transformation.
This is tokenization & RWA put to real economic use. Be there!https://t.co/5mj2DOoMrT $VET pic.twitter.com/8rkD8twXiV
The planned delisting of GOATS from ONUS could have a negative effect on the price. When a token is removed from an exchange, it becomes harder to buy or sell, leading to less demand and lower liquidity. This often results in selling pressure as users may try to exit their positions before the removal deadline. Also, ONUS stopping support means users must act fast or risk asset loss. Traders should watch for possible price drops around the delisting dates. Learn more from the official announcement source.
ONUS@ONUSFinanceNov 27, 2025GOATS Delisting Plan
As GOATS no longer meets ONUS’s trading standards, the team will proceed to delist it from the ONUS app.
The GOATS delisting plan is scheduled as follows:
- 05:00 UTC on November 27, 2025: ONUS will disable on-chain deposits for GOATS.
- Before 03:00… pic.twitter.com/e6UVI2fZbb
The launch of Arise Playtest 3 gives more users a chance to try the game, with rewards and new features like weapons and dungeons. This wider access can attract fresh players and bring more interest to the Cross The Ages token. If feedback is good, the token could see more buying, especially if rewards require using or holding CTA. However, playtests do not always lead to big price moves unless they highlight real progress or adoption. Details are shared by the Cross The Ages team source.
Cross The Ages@CrossTheAgesNov 26, 2025ARISE Playtest 3
The new version of Arise is now available
From 26 November to 10 December, Playtest 3 is available to everyone without any restrictions!
Exclusive rewards, PvP challenges, New weapons, New dungeons.
Available on @EpicGameshttps://t.co/a9jDRefhSc pic.twitter.com/mDAx7UP94O
Bitcoin’s most important reversal signal may finally be forming. After three weeks of relentless sell pressure from US spot markets and record ETF outflows, a rare cluster of metrics is shifting in unison.
The Coinbase Premium is recovering, whales are going long aggressively, funding rates have flipped negative, and fresh ETF inflows have reappeared. Analysts say it is the first coordinated improvement in Bitcoin’s market structure since early November.
US Selling Pressure Suddenly Cools After 22 Days of Pain
For most of November, US-based entities drove the price of Bitcoin lower. The Coinbase Premium Index, which compares BTC prices on Coinbase Pro (heavily used by US institutions) versus global exchanges, remained negative for 22 consecutive days, marking the longest discount window of 2025.
Analyst Crypto Goos added that every time this indicator turns “deeply red,” Bitcoin dumps, recognizing the budding change this week. Now it’s starting to cool off, which could signal the beginning of a reversal.
Dark Fost, who reportedly monitors the indicator daily, said the same selling cohort, institutions, professionals, and US whales, has sharply reduced pressure since the panic peak on November 21.
“The selling pressure from these actors has significantly decreased…if the trend continues, it should give the market some breathing room,” wrote Fost.
Elsewhere, analysts note that the most significant shift is occurring in position data, with whales going long on Bitcoin more aggressively than individual investors for the first time in history.
With the Coinbase Premium rising again, funding rates falling, and retail showing hesitance, analysts say such conditions often precede sustained uptrends.
“The uptrend will probably continue for a while longer. Maybe until the end of the year,” analyst Para Muhendisi suggested.
In the same tone, analyst Daan Crypto Trades confirmed the spot dynamic improving underneath, citing a steadily returning Coinbase premium with funding rates turning negative. In his view, even small improvements matter because the prior sell pressure was extreme.
Macro Flips Risk-On: Dollar Rejects, Yields Break Lower, and ETF Flows Finally Turn Green Again
However, others observe key catalysts emerging from the macro level, with MV Crypto highlighting a series of market-wide shifts.
“Rate-cut probabilities jumped from 30% to 84% in one week, bullish for the broader market… DXY is rejecting a crucial resistance… the 10-year yield is falling below 4%,” they stated.
Against this backdrop, the prevailing sentiment is that it may be time to adopt a bullish stance rather than a bearish one, thanks to macroeconomic conditions turning positive for the crypto market.
Large transfers and associated flow signals add credence to this line of thought, with SpaceX moving $105 million worth of Bitcoin to Coinbase Prime for custody.
Additionally, after one of the worst ETF outflow months on record, November 25 and 26 finally posted positive inflows.
Historically, Bitcoin performs best when ETF inflows and the Coinbase Premium rise in tandem, signaling broad US demand across both institutional products and spot exchanges.
Analyst Ted has, however, issued a more cautious tone, indicating that even though the Coinbase Bitcoin premium is recovering now, until this trajectory stabilizes in favor of the upside, most BTC rallies will be sold.
Perhaps that is exactly where the market sits, a state that is not fully reversed, but no longer bleeding. This aligns with a recent BeInCrypto analysis that highlighted lingering liquidity concerns despite the Bitcoin price climbing over $90,000.
With whales increasing longs, US sell pressure cooling, funding rates going negative, macro flipping bullish, and ETF inflows reappearing, analysts say Bitcoin is entering its first legitimate window for upside since early November.
White Label
Data API
Web Plug-ins
Poster Maker
Affiliate Program
The risk of loss in trading financial instruments such as stocks, FX, commodities, futures, bonds, ETFs and crypto can be substantial. You may sustain a total loss of the funds that you deposit with your broker. Therefore, you should carefully consider whether such trading is suitable for you in light of your circumstances and financial resources.
No decision to invest should be made without thoroughly conducting due diligence by yourself or consulting with your financial advisors. Our web content might not suit you since we don't know your financial conditions and investment needs. Our financial information might have latency or contain inaccuracy, so you should be fully responsible for any of your trading and investment decisions. The company will not be responsible for your capital loss.
Without getting permission from the website, you are not allowed to copy the website's graphics, texts, or trademarks. Intellectual property rights in the content or data incorporated into this website belong to its providers and exchange merchants.
Not Logged In
Log in to access more features

FastBull Membership
Not yet
Purchase
Log In
Sign Up