• Trade
  • Markets
  • Copy
  • Contests
  • News
  • 24/7
  • Calendar
  • Q&A
  • Chats
Trending
Screeners
SYMBOL
LAST
BID
ASK
HIGH
LOW
NET CHG.
%CHG.
SPREAD
SPX
S&P 500 Index
6846.50
6846.50
6846.50
6878.28
6827.18
-23.90
-0.35%
--
DJI
Dow Jones Industrial Average
47739.31
47739.31
47739.31
47971.51
47611.93
-215.67
-0.45%
--
IXIC
NASDAQ Composite Index
23545.89
23545.89
23545.89
23698.93
23455.05
-32.22
-0.14%
--
USDX
US Dollar Index
99.000
99.080
99.000
99.000
99.000
+0.050
+ 0.05%
--
EURUSD
Euro / US Dollar
1.16356
1.16386
1.16356
1.16365
1.16322
-0.00008
-0.01%
--
GBPUSD
Pound Sterling / US Dollar
1.33213
1.33264
1.33213
1.33213
1.33140
+0.00008
+ 0.01%
--
XAUUSD
Gold / US Dollar
4189.70
4190.14
4189.70
4218.85
4175.92
-8.21
-0.20%
--
WTI
Light Sweet Crude Oil
58.555
58.807
58.555
60.084
58.495
-1.254
-2.10%
--

Community Accounts

Signal Accounts
--
Profit Accounts
--
Loss Accounts
--
View More

Become a signal provider

Sell trading signals to earn additional income

View More

Guide to Copy Trading

Get started with ease and confidence

View More

Signal Accounts for Members

All Signal Accounts

Best Return
  • Best Return
  • Best P/L
  • Best MDD
Past 1W
  • Past 1W
  • Past 1M
  • Past 1Y

All Contests

  • All
  • Trump Updates
  • Recommend
  • Stocks
  • Cryptocurrencies
  • Central Banks
  • Featured News
Top News Only
Share

SPDR Gold Holdings Down 0.11%, Or 1.14 Tonnes

Share

On Monday (December 8), In Late New York Trading, S&P 500 Futures Fell 0.21%, Dow Jones Futures Fell 0.43%, NASDAQ 100 Futures Fell 0.08%, And Russell 2000 Futures Fell 0.04%

Share

Morgan Stanley: Data Center ABS Spreads Are Expected To Widen In 2026

Share

(US Stocks) The Philadelphia Gold And Silver Index Closed Down 2.34% At 311.01 Points. (Global Session) The NYSE Arca Gold Miners Index Closed Down 2.17%, Hitting A Daily Low Of 2235.45 Points; US Stocks Remained Slightly Down Before The Opening Bell—holding Steady Around 2280 Points—before Briefly Rising Slightly

Share

IMF: IMF Executive Board Approves Extension Of The Extended Credit Facility Arrangement With Nepal

Share

Trump: Same Approach Will Apply To Amd, Intel, And Other Great American Companies

Share

Trump: Department Of Commerce Is Finalizing Details

Share

Trump: $25% Will Be Paid To United States Of America

Share

Trump: President Xi Responded Positively

Share

[Consumer Discretionary ETFs Fell Over 1.4%, Leading The Decline Among US Sector ETFs; Semiconductor ETFs Rose Over 1.1%] On Monday (December 8), The Consumer Discretionary ETF Fell 1.45%, The Energy ETF Fell 1.09%, The Internet ETF Fell 0.18%, The Regional Banks ETF Rose 0.34%, The Technology ETF Rose 0.70%, The Global Technology ETF Rose 0.93%, And The Semiconductor ETF Rose 1.13%

Share

Trump: I Have Informed President Xi, Of China, That United States Will Allow Nvidia To Ship Its H200 Products To Approved Customers In China

Share

Argentina's Merval Index Closed Up 0.02% At 3.047 Million Points. It Rose To A New Daily High Of 3.165 Million Points In Early Trading In Buenos Aires Before Gradually Giving Back Its Gains

Share

US Stock Market Closing Report | On Monday (December 8), The Magnificent 7 Index Fell 0.20% To 208.33 Points. The "mega-cap" Tech Stock Index Fell 0.33% To 405.00 Points

Share

Pentagon - USA State Dept Approves Potential Sale Of Hellfire Missiles To Belgium For An Estimated $79 Million

Share

Toronto Stock Index .GSPTSE Unofficially Closes Down 141.44 Points, Or 0.45 Percent, At 31169.97

Share

The Nasdaq Golden Dragon China Index Closed Up Less Than 0.1%. Nxtt Rose 21%, Microalgo Rose 7%, Daqo New Energy Rose 4.3%, And 21Vianet, Baidu, And Miniso All Rose More Than 3%

Share

The S&P 500 Initially Closed Down More Than 0.4%, With The Telecom Sector Down 1.9%, And Materials, Consumer Discretionary, Utilities, Healthcare, And Energy Sectors Down By As Much As 1.6%, While The Technology Sector Rose 0.7%. The NASDAQ 100 Initially Closed Down 0.3%, With Marvell Technology Down 7%, Fortinet Down 4%, And Netflix And Tesla Down 3.4%

Share

IMF: Review Pakistan Authorities To Draw The Equivalent Of About US$1 Billion

Share

President Trump Is Committed To The Continued Cessation Of Violence And Expects The Governments Of Cambodia And Thailand To Fully Honor Their Commitments To End This Conflict - Senior White House Official

Share

[Water Overflows From Spent Fuel Pool At Japanese Nuclear Facility] According To Japan's Nuclear Waste Management Company, Following A Strong Earthquake Off The Coast Of Aomori Prefecture Late On December 8th, Workers At The Nuclear Waste Treatment Plant In Rokkasho Village, Aomori Prefecture, Discovered "at Least 100 Liters Of Water" On The Ground Around The Spent Fuel Pool During An Inspection. Analysis Suggests This Water "may Have Overflowed Due To The Earthquake's Shaking." However, It Is Reported That The Overflowed Water "remains Inside The Building And Has Not Affected The External Environment."

TIME
ACT
FCST
PREV
France Trade Balance (SA) (Oct)

A:--

F: --

P: --
Euro Zone Employment YoY (SA) (Q3)

A:--

F: --

P: --
Canada Part-Time Employment (SA) (Nov)

A:--

F: --

P: --

Canada Unemployment Rate (SA) (Nov)

A:--

F: --

P: --

Canada Full-time Employment (SA) (Nov)

A:--

F: --

P: --

Canada Labor Force Participation Rate (SA) (Nov)

A:--

F: --

P: --

Canada Employment (SA) (Nov)

A:--

F: --

P: --

U.S. PCE Price Index MoM (Sept)

A:--

F: --

P: --

U.S. Personal Income MoM (Sept)

A:--

F: --

P: --

U.S. Core PCE Price Index MoM (Sept)

A:--

F: --

P: --

U.S. PCE Price Index YoY (SA) (Sept)

A:--

F: --

P: --

U.S. Core PCE Price Index YoY (Sept)

A:--

F: --

P: --

U.S. Personal Outlays MoM (SA) (Sept)

A:--

F: --

P: --
U.S. 5-10 Year-Ahead Inflation Expectations (Dec)

A:--

F: --

P: --

U.S. Real Personal Consumption Expenditures MoM (Sept)

A:--

F: --

P: --
U.S. Weekly Total Rig Count

A:--

F: --

P: --

U.S. Weekly Total Oil Rig Count

A:--

F: --

P: --

U.S. Consumer Credit (SA) (Oct)

A:--

F: --

P: --
China, Mainland Foreign Exchange Reserves (Nov)

A:--

F: --

P: --

Japan Trade Balance (Oct)

A:--

F: --

P: --

Japan Nominal GDP Revised QoQ (Q3)

A:--

F: --

P: --

China, Mainland Imports YoY (CNH) (Nov)

A:--

F: --

P: --

China, Mainland Exports (Nov)

A:--

F: --

P: --

China, Mainland Imports (CNH) (Nov)

A:--

F: --

P: --

China, Mainland Trade Balance (CNH) (Nov)

A:--

F: --

P: --

China, Mainland Exports YoY (USD) (Nov)

A:--

F: --

P: --

China, Mainland Imports YoY (USD) (Nov)

A:--

F: --

P: --

Germany Industrial Output MoM (SA) (Oct)

A:--

F: --

P: --
Euro Zone Sentix Investor Confidence Index (Dec)

A:--

F: --

P: --

Canada National Economic Confidence Index

A:--

F: --

P: --

U.K. BRC Like-For-Like Retail Sales YoY (Nov)

--

F: --

P: --

U.K. BRC Overall Retail Sales YoY (Nov)

--

F: --

P: --

Australia Overnight (Borrowing) Key Rate

--

F: --

P: --

RBA Rate Statement
RBA Press Conference
Germany Exports MoM (SA) (Oct)

--

F: --

P: --

U.S. NFIB Small Business Optimism Index (SA) (Nov)

--

F: --

P: --

Mexico 12-Month Inflation (CPI) (Nov)

--

F: --

P: --

Mexico Core CPI YoY (Nov)

--

F: --

P: --

Mexico PPI YoY (Nov)

--

F: --

P: --

U.S. Weekly Redbook Index YoY

--

F: --

P: --

U.S. JOLTS Job Openings (SA) (Oct)

--

F: --

P: --

China, Mainland M1 Money Supply YoY (Nov)

--

F: --

P: --

China, Mainland M0 Money Supply YoY (Nov)

--

F: --

P: --

China, Mainland M2 Money Supply YoY (Nov)

--

F: --

P: --

U.S. EIA Short-Term Crude Production Forecast For The Year (Dec)

--

F: --

P: --

U.S. EIA Natural Gas Production Forecast For The Next Year (Dec)

--

F: --

P: --

U.S. EIA Short-Term Crude Production Forecast For The Next Year (Dec)

--

F: --

P: --

EIA Monthly Short-Term Energy Outlook
U.S. API Weekly Gasoline Stocks

--

F: --

P: --

U.S. API Weekly Cushing Crude Oil Stocks

--

F: --

P: --

U.S. API Weekly Crude Oil Stocks

--

F: --

P: --

U.S. API Weekly Refined Oil Stocks

--

F: --

P: --

South Korea Unemployment Rate (SA) (Nov)

--

F: --

P: --

Japan Reuters Tankan Non-Manufacturers Index (Dec)

--

F: --

P: --

Japan Reuters Tankan Manufacturers Index (Dec)

--

F: --

P: --

Japan Domestic Enterprise Commodity Price Index MoM (Nov)

--

F: --

P: --

Japan Domestic Enterprise Commodity Price Index YoY (Nov)

--

F: --

P: --

China, Mainland PPI YoY (Nov)

--

F: --

P: --

China, Mainland CPI MoM (Nov)

--

F: --

P: --

Italy Industrial Output YoY (SA) (Oct)

--

F: --

P: --

Q&A with Experts
    • All
    • Chatrooms
    • Groups
    • Friends
    Connecting
    .
    .
    .
    Type here...
    Add Symbol or Code

      No matching data

      All
      Trump Updates
      Recommend
      Stocks
      Cryptocurrencies
      Central Banks
      Featured News
      • All
      • Russia-Ukraine Conflict
      • Middle East Flashpoint
      • All
      • Russia-Ukraine Conflict
      • Middle East Flashpoint
      Search
      Products

      Charts Free Forever

      Chats Q&A with Experts
      Screeners Economic Calendar Data Tools
      Membership Features
      Data Warehouse Market Trends Institutional Data Policy Rates Macro

      Market Trends

      Market Sentiment Order Book Forex Correlations

      Top Indicators

      Charts Free Forever
      Markets

      News

      News Analysis 24/7 Columns Education
      From Institutions From Analysts
      Topics Columnists

      Latest Views

      Latest Views

      Trending Topics

      Top Columnists

      Latest Update

      Signals

      Copy Rankings Latest Signals Become a signal provider AI Rating
      Contests
      Brokers

      Overview Brokers Assessment Rankings Regulators News Claims
      Broker listing Forex Brokers Comparison Tool Live Spread Comparison Scam
      Q&A Complaint Scam Alert Videos Tips to Detect Scam
      More

      Business
      Events
      Careers About Us Advertising Help Center

      White Label

      Data API

      Web Plug-ins

      Affiliate Program

      Awards Institution Evaluation IB Seminar Salon Event Exhibition
      Vietnam Thailand Singapore Dubai
      Fans Party Investment Sharing Session
      FastBull Summit BrokersView Expo
      Recent Searches
        Top Searches
          Markets
          News
          Analysis
          User
          24/7
          Economic Calendar
          Education
          Data
          • Names
          • Latest
          • Prev

          View All

          No data

          Scan to Download

          Faster Charts, Chat Faster!

          Download App
          English
          • English
          • Español
          • العربية
          • Bahasa Indonesia
          • Bahasa Melayu
          • Tiếng Việt
          • ภาษาไทย
          • Français
          • Italiano
          • Türkçe
          • Русский язык
          • 简中
          • 繁中
          Open Account
          Search
          Products
          Charts Free Forever
          Markets
          News
          Signals

          Copy Rankings Latest Signals Become a signal provider AI Rating
          Contests
          Brokers

          Overview Brokers Assessment Rankings Regulators News Claims
          Broker listing Forex Brokers Comparison Tool Live Spread Comparison Scam
          Q&A Complaint Scam Alert Videos Tips to Detect Scam
          More

          Business
          Events
          Careers About Us Advertising Help Center

          White Label

          Data API

          Web Plug-ins

          Affiliate Program

          Awards Institution Evaluation IB Seminar Salon Event Exhibition
          Vietnam Thailand Singapore Dubai
          Fans Party Investment Sharing Session
          FastBull Summit BrokersView Expo

          Beste crypto om vandaag te kopen: 3 kleine crypto’s met potentie in januari

          NewsBTC
          Kyber Network / Tether
          -0.23%
          1inch / Tether
          -0.22%
          AAVE / Tether
          -0.19%
          Acala / Tether
          -0.69%
          Fusionist / Tether
          +0.50%

          Nu de crypto markt zich in een moeilijke fase bevindt gaan investeerders op zoek naar alternatieve cryptocurrency’s die wel in staat zijn om goede resultaten neer te zetten. Hieronder gaan we daarom verder in op de drie beste crypto met potentie om vandaag te kopen.

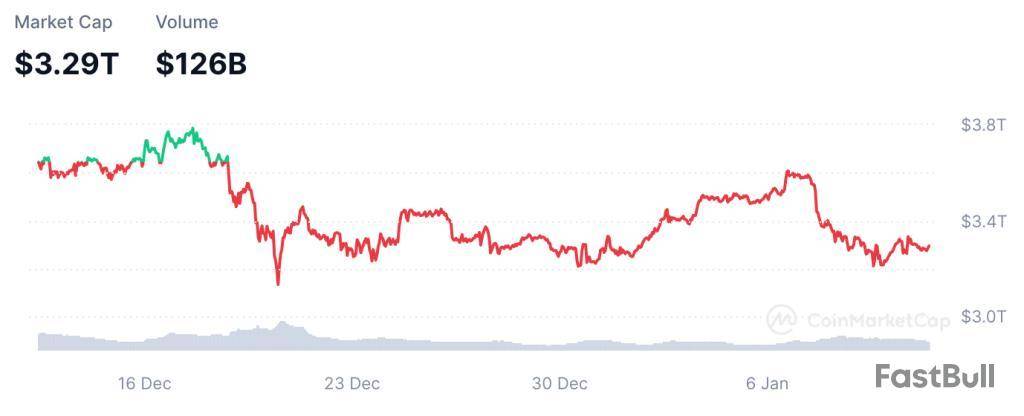
          De crypto markt is rood vandaag. Met een totale market cap van $3,29 miljard is de crypto markt nu iets meer dan 0,8% gedaald sinds gisteren. Vier dagen geleden bevond deze market cap zich nog boven de $3,60 miljard.

          crypto markt

          Een van de belangrijkste redenen achter de recente prestaties van de crypto markt is Bitcoin. Bitcoin is er namelijk nog altijd niet in geslaagd om een waarde boven de $100.000 vast te houden. Bitcoin was op 7 januari nog in staat was om kort boven de $102.000 uit te stijgen. Diezelfde dag moest het echter weer een daling tot onder de $97.000 accepteren.

          Bitcoin

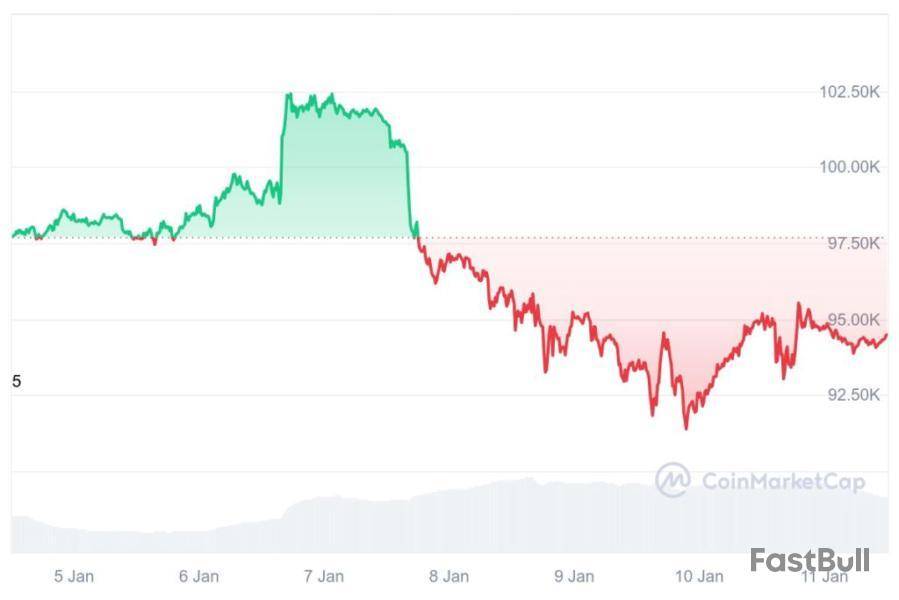
          Sinds 7 januari heeft Bitcoin zich vooral zijwaarts bewogen met als gevolg de huidige waarde van rond de $94.300. De markt lijkt nu vooral de inauguratie van Trump af te wachten. De hoop is dat zijn beleidsveranderingen een positieve invloed kunnen uitoefenen op de crypto markt.

          Maar waarom wachten tot 20 januari als er vandaag al meerdere kansen zijn te vinden binnen de crypto markt? Hieronder beschrijven we drie kleine crypto’s die ondanks de moeilijke fase van de crypto markt veel potentie met zich meebrengen.

          Welke crypto kopen vandaag? Wall Street Pepe is een van de beste opties van vandaag

          Pepe coin is nog altijd een van de beste meme coins van dit moment, en wat nou als je de virale Pepe coin combineert met de trading strategieën van de Wolf of Wall Street? Dan krijg je Wall Street Pepe, een nieuw crypto project dat de nodige potentie met zich meebrengt. Dit project probeert de kleine trader een eerlijke kans te geven tegen de grote whales en financiële instituten.

          wepe

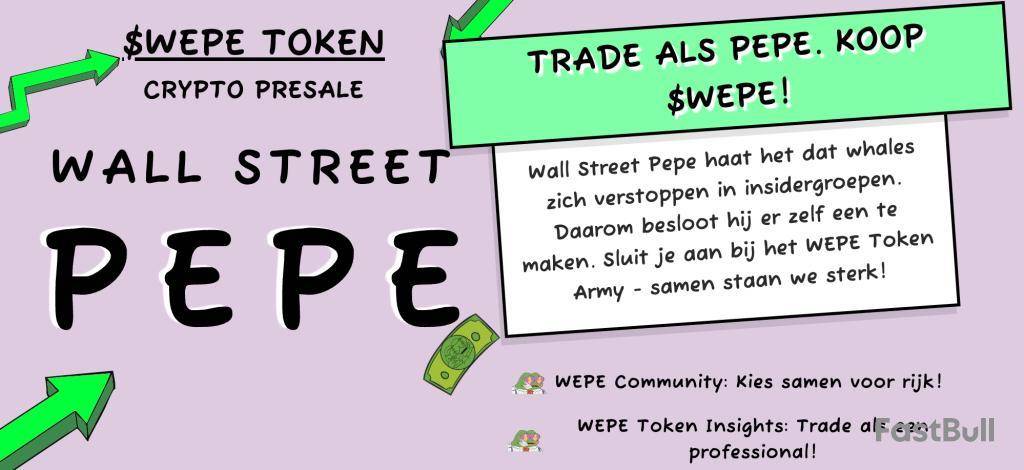
          Door de kleine particuliere trader te voorzien van exclusieve trading inzichten en strategieën hoopt het deze groep investeerders een voordeel te geven over de rest van de markt. Het doel van Wall Street Pepe is dan ook om van zijn Wepe Army de volgende golf van rijke investeerders te maken. Word nu onderdeel van Wall Street Pepe en grijp jouw kans om een voordeel te behalen over de grote whales van de crypto markt.

          Wall Street Pepe wordt aangedreven door de native WEPE token, een token die op dit moment te koop is tijdens zijn presale fase. Deze presale heeft nu al meer dan $ 45 miljoen aan investeringen opgehaald. Een indrukwekkend bedrag dat aangeeft hoeveel aandacht er al is voor dit project. Tokens kosten op dit moment $ 0,00036645 per stuk, maar deze prijs zal binnen korte tijd verder gaan stijgen. Grijp vandaag dus je kans om goedkoop WEPE tokens te kopen.

          Bezoek Wall Street Pepe Presale

          Ontdek de eerste Solana Layer 2 blockchain van Solaxy

          De Solana blockchain is hard op weg om de grootste blockchain van de crypto markt te worden. De efficiëntie en snelheid waren een aantal van de functies die Solana al snel populair maakten. Deze snelle groei in omvang komt echter ook met zijn nadelen. Solana heeft namelijk steeds vaker te maken met gefaalde transacties, overvolle transactiekanalen, een toename in tarieven en een afname in snelheden. Met de introductie van Solaxy wordt hier nu echter verandering in aangebracht.

          solaxy beste crypto

          Solaxy is verantwoordelijk voor de eerste Layer 2 blockchain van Solana. Deze Layer 2 oplossing moet de belangrijkste problemen van Solana op gaan lossen. Tegelijkertijd probeert Solaxy ook de liquiditeit van de Ethereum blockchain te combineren met de efficiëntie van Solana. Op deze manier biedt het zijn gebruikers dus nog meer voordelen en mogelijkheden.

          De presale van de native $SOLX token geeft gebruikers nu een kans om vroegtijdig in te stappen bij dit project, tegen de laagste mogelijke prijs. Omdat de prijs van $SOLX tokens in elke fase van de presale stijgt zullen gebruikers er dus snel bij moeten zijn. Een investeerder die vandaag nog instapt kan ook meteen al beginnen met het staken van zijn $SOLX tokens en op die manier extra winsten realiseren. $SOLX tokens kosten op dit moment $ 0,001596 per stuk in een presale die al bijna $ 10 miljoen aan investeringen heeft opgebracht.

          Bezoek Solaxy Presale

          De toekomst van de crypto wallet industrie?

          Het is geen verrassing dat de industrie van crypto wallets hard aan het groeien is. Nadat de crypto eind 2024 een opleving doormaakte, is er ook steeds meer vraag naar crypto gerelateerde functies ontstaan. Met Best Wallet is er nu echter een project op de markt verschenen dat de crypto wallet industrie op zijn kop kan gaan zetten. Dit project biedt namelijk veel meer aan dan een simpele crypto wallet; het biedt een volledig multi-chain, multi-wallet platform aan.

          best wallet

          Het doel van Best Wallet is om voor het einde van 2026 maar liefst 40% van de crypto wallet industrie in handen te hebben. Door zijn multi-chain, multi-wallet platform in combinatie met de Fireblocks MPC-CMP wallet technologie is dit een zeer realistisch doel. Dit allesomvattende platform geeft zelfs nieuwkomers het vertrouwen dat nodig is om succesvol te zijn binnen de crypto markt.

          Best Wallet wordt aangedreven door de native $BEST token, een token die veel voordelen met zich meebrengt. Token houders komen namelijk in aanmerking voor gereduceerde transactietarieven, vroege toegang tot nieuwe projecten, hogere stakingsbeloningen en zeggenschap binnen het bestuur. Om $BEST tokens te kopen tijdens de presale moet je naar de Upcoming Tokens pagina van Best Wallet gaan. Dit is ook de plek waar alle nieuwe tokens op gelanceerd worden zodra het Best Wallet platform live gaat.

          Bezoek Best Wallet Presale

          Risk Warnings and Disclaimers
          You understand and acknowledge that there is a high degree of risk involved in trading. Following any strategies or investment methods may lead to potential losses. The content on the site is provided by our contributors and analysts for information purposes only. You are solely responsible for determining whether any trading assets, securities, strategy, or any other product is suitable for investing based on your own investment objectives and financial situation.
          Add to Favorites
          Share

          BTC Nears $95,000 Indicating a Ripe Buying Period: How $MEMEX Can Help Diversify Risk

          NewsBTC
          Kyber Network / Tether
          -0.23%
          1inch / Tether
          -0.22%
          AAVE / Tether
          -0.19%
          Acala / Tether
          -0.69%
          Fusionist / Tether
          +0.50%

          Bitcoin slipped below the $95,000 mark on Thursday, marking a 10% fall in the last three days from the highs of $102,760. The coin has seemed to form a base at around the $91,150 mark – Bitcoin has not closed below this mark since 15th November. This begs the question whether it’s a golden time to accumulate Bitcoin, especially for investors looking for a fresh entry?

          Besides favorable price action setup (such as the Golden Cross), the SOPR (Spent Output Profit Ratio) has also slipped below 1 and now stands at 0.987. This indicates that short-term investors have been selling Bitcoin at a loss. Simply put, this means that Bitcoin is now available at a discount. Historically too, whenever the SOPR falls below 1, it’s succeeded by an increase in price.

          Note: SOPR measures the ratio between the value of Bitcoin when they were sold and the value when they were bought. A selling price lower than the buying price yields a value less than 1.

          Often, as short term investors experience pain, it leads to better accumulation opportunities, which is exactly the case with Bitcoin right now. If the prices slip further down, smart investors will look to benefit from lower buying prices.

          So, if you’re looking to buy Bitcoin, the might just be the right time. However, if you want to play it safe and not put all your eggs in one basket, we’ve got something interesting for you – Meme Index ($MEMEX).

          Why Choose $MEMEX?

          Meme Index is one of the best meme coins on the market right now, bringing the benefits of diversification to the table. Instead of investing your money in a single asset like Bitcoin, you can buy $MEMEX to invest it in a basket of coins (indexes).

          Yep, you wouldn’t be wrong if you considered it a mutual fund-like scheme for cryptocurrency.

          Meme Index ($MEMEX)

          Meme Index offers four indexes depending on the level of risk you’re willing to take:

          • Meme Titan: This basket includes well-established meme coins, most of which have a market cap of more than $1B, such as $PEPE, $DOGE, and $SHIB. This index is ideal for investors who want to play it safe.
          • Moonshot: This includes meme coins that have the potential of breaking into the top 10. Many of them have already been listed on tier 1 exchanges or are in the process of being listed soon.
          • Midcap: This basket includes meme coins with a market cap between $50-250M. Buy this index if you’re willing to take a bit of risk as the coins are volatile.
          • Meme Frenzy: This index is built for risk lovers with potential multibagger meme coins with high risk levels.

          The project has a lot of potential. Available at a price of just $0.0151032 per token, you can benefit from early entry thanks to the $MEMEX presale, which is currently live. However, note that the prices will increase in the next 21 hours and then at every following stage of the presale.

          $MEMEX has already raised $2.2 M and has a strong community following with 19K followers on X.

          Active community members can vote on crucial topics and proposals and maneuver the direction of the project. This community-driven approach ensures that it’s the investors who ultimately decide the future of the project.

          Overall, $MEMEX is one-of-a-kind basket-based investing that lowers your overall portfolio risk through diversification. It’s, therefore, also ideal for new investors who often find it difficult to spot fantastic meme coins to invest in. With $MEMEX, they can simply invest in a basket of meme coins as per their risk appetite.

          However, please keep in mind that this isn’t investment advice. As always, we highly recommend you do your own research and consult a financial advisor if needed before making any investment decisions.

          Risk Warnings and Disclaimers
          You understand and acknowledge that there is a high degree of risk involved in trading. Following any strategies or investment methods may lead to potential losses. The content on the site is provided by our contributors and analysts for information purposes only. You are solely responsible for determining whether any trading assets, securities, strategy, or any other product is suitable for investing based on your own investment objectives and financial situation.
          Add to Favorites
          Share

          Is The Bitcoin Bull Market Still On? STH Cost Basis Suggests So

          NewsBTC
          Kyber Network / Tether
          -0.23%
          1inch / Tether
          -0.22%
          AAVE / Tether
          -0.19%
          Acala / Tether
          -0.69%
          Fusionist / Tether
          +0.50%

          The Bitcoin price has been somewhat quiet since hitting its all-time high of $108,135, struggling to hold a six-figure valuation for long. Case in point — the premier cryptocurrency barely lasted a day above $100,000 before crashing to under $92,000 in the past week.

          This sluggish price action has triggered discussions about the likelihood of a top being in and the Bitcoin bull market being over. However, the latest on-chain observation suggests that the flagship cryptocurrency might still have room for further upward price movement.

          What’s The Current Bitcoin Short-Term Holders Cost Basis?

          In its latest post on the X platform, blockchain analytics firm Glassnode revealed that the Bitcoin bull market might not be over just yet. This on-chain observation is based on the movement of the BTC price in relation to the short-term holders (STH) cost basis.

          The STH cost-basis metric tracks the average price at which short-term holders (investors who have held Bitcoin for less than 155 days) purchased their coins. It represents a psychological level for BTC investors and could serve as a technical point for analyzing prices, especially during bull cycles.

          Typically, the price of Bitcoin floats above the STH cost basis during bull markets, indicating significant buying interest and positive sentiment from short-term traders. Conversely, when the BTC price falls beneath this level — as often seen in bear markets, this means that newer investors are in the red, leading to substantial selling pressure.

          Bitcoin

          According to data from Glassnode, Bitcoin’s price is roughly 7% above the STH cost basis, which currently stands at around $88,135. While the premier cryptocurrency is a little closer to the cost basis, the inkling is still that short-term holders are less likely to offload their assets.

          If the price of Bitcoin manages to sustain above the STH cost basis, it means the potential continuation of the current bull market. On the flip side, a move beneath $88,000 could set the stage for a trend reversal, with the market shifting from a bull to a bear phase.

          As of this writing, the price of BTC sits just above $94,000, reflecting barely a 1% increase in the past 24 hours. According to data from CoinGecko, the flagship cryptocurrency is down by more than 3% in the last seven days.

          Is A Market Rebound Imminent?

          The crypto market has been in terrible form over the past week, with several large-cap assets dipping by double digits. Unsurprisingly, many crypto traders have indicated interest in offloading their assets on various social media platforms.

          However, this shift in investor sentiment increases the odds of a market recovery, as prices tend to move in the crowd’s opposite direction. On-chain intelligence firm Santiment noted in a post on X that this was the case in the rally witnessed in 2024 Q4, as higher prices followed increased bearish mentions.

          Risk Warnings and Disclaimers
          You understand and acknowledge that there is a high degree of risk involved in trading. Following any strategies or investment methods may lead to potential losses. The content on the site is provided by our contributors and analysts for information purposes only. You are solely responsible for determining whether any trading assets, securities, strategy, or any other product is suitable for investing based on your own investment objectives and financial situation.
          Add to Favorites
          Share

          Bitcoin's 1st Tweet at $0 Marks 16 Years: Details

          U.Today
          Kyber Network / Tether
          -0.23%
          1inch / Tether
          -0.22%
          AAVE / Tether
          -0.19%
          Acala / Tether
          -0.69%
          Fusionist / Tether
          +0.50%

          On Jan. 10, 2009, history was made with the first-ever Bitcoin-related tweet by early Bitcoin pioneer and computer scientist Hal Finney.

          Finney's iconic tweet "Running Bitcoin" was highlighted by Bitcoin historian Pete Rizzo, who shared on X, "The 1st Bitcoin tweet, posted when the price was $0, exactly 16 years ago."

          The Bitcoin Historian
          @pete_rizzo_

          ✨ The 1st #Bitcoin tweet, posted when the price was $0, exactly 16 years ago

          Today, we are all running Bitcoin 👏 pic.twitter.com/Hy7bTJ3Ysc

          Jan 10, 2025

          Finney was among the earliest Bitcoin users, and on Jan. 12, 2009, he received the first Bitcoin transaction from Satoshi Nakamoto, Bitcoin's pseudonymous creator.

          Finney's first Bitcoin tweet, sent 16 years ago, marked the beginning of a new era, as Bitcoin had no monetary value at the time. Fast forward 16 years, and Bitcoin has become a global financial asset, with an all-time high of $108,268 on Dec. 17, 2024.

          As reported, Finney predicted that if Bitcoin became the world's dominant payment system, its value "should be equal to the total value of all the wealth in the world." Extending this logic, he determined a value of $10 million for the leading cryptocurrency.

          What indicators reveal on Bitcoin

          At the time of writing, BTC was down 0.83% in the last 24 hours to $94,507.

          Bitcoin's Short-Term Holder (STH) cost-basis model is a crucial indicator for gauging sentiment among new investors. Historically, this model has tracked market lows during bull cycles and distinguished between bull and bear markets.

          According to Glassnode, the BTC price is presently nearly 7% above the STH cost-basis of $88,135. If the price stabilizes below this level, it may indicate dwindling sentiment among new investors, which is often a turning point in market trends.

          Meanwhile, the percentage of Bitcoin wealth held by new investors (coins less than three months old) has increased, accounting for 49.6% of network liquidity. This implies that mature investors have meaningfully distributed coins throughout the rally, with new demand offsetting sell-side pressure.

          Risk Warnings and Disclaimers
          You understand and acknowledge that there is a high degree of risk involved in trading. Following any strategies or investment methods may lead to potential losses. The content on the site is provided by our contributors and analysts for information purposes only. You are solely responsible for determining whether any trading assets, securities, strategy, or any other product is suitable for investing based on your own investment objectives and financial situation.
          Add to Favorites
          Share

          Cardano Founder Validates XRP Community, Here's Why

          U.Today
          Kyber Network / Tether
          -0.23%
          1inch / Tether
          -0.22%
          AAVE / Tether
          -0.19%
          Acala / Tether
          -0.69%
          Fusionist / Tether
          +0.50%

          The XRP community has received an unlikely endorsement for its leadership and strength. In an X post, Charles Hoskinson, Cardano founder, emphasized that XRP has a real community and defined leadership. He also lauded their purpose-driven approach.

          Hoskinson acknowledges XRP's community and leadership

          Hoskinson acknowledges that XRP has a genuine user base with an active community supporting the project.

          Additionally, he said the XRP team is credible, which is critical for its long-term success. Hoskinson’s reference to XRP’s purpose implies the token’s utility in facilitating cross-border payments and other financial services.

          Charles Hoskinson
          @IOHK_Charles

          XRP has a real community, leadership, purpose, and its founders aren't on an Interpol red notice

          Jan 10, 2025

          The Cardano founder’s comments about his XRP counterparts were significant. "…And its founders aren't on an Interpol red notice," he wrote.

          Hoskinson emphasized that XRP founders were not involved in fraud allegations, necessitating placing them on an "Interpol red notice."

          This contrasts with an earlier post where he proclaimed his intolerance of a specific project as it is "divorced from reality."

          Notably, Hoskinson was taking a subtle jab at Richard Schuele, popularly known as Richard Heart, the creator of Hex and PulseChain. Schuele is facing legal issues with the authorities over his dealings with users’ funds.

          Last month, Interpol placed Schuele on red notice over fund misappropriation. He allegedly misused $12 million on luxury goods. This follows an earlier indictment by the U.S. Securities and Exchange Commission (SEC) for fraud and violating federal securities law in 2023.

          Bridging differences with XRP community

          Hence, the Cardano founder’s comments clarify why he thinks XRP is distinct from such projects as Hex or PulseChain.

          Interestingly, in the past, Hoskinson did not see eye-to-eye with the XRP community and the Ripple team. Their disagreement stems from accusations the Ethereum team played a role in influencing the SEC to go after Ripple in 2020 in a lawsuit.

          However, Hoskinson, in an apology via a live stream in November, reconciled with the XRP community. He has even gone a step further to discuss with Ripple executives, including Brad Garlinghouse and David Schwartz, on potential partnerships.

          Risk Warnings and Disclaimers
          You understand and acknowledge that there is a high degree of risk involved in trading. Following any strategies or investment methods may lead to potential losses. The content on the site is provided by our contributors and analysts for information purposes only. You are solely responsible for determining whether any trading assets, securities, strategy, or any other product is suitable for investing based on your own investment objectives and financial situation.
          Add to Favorites
          Share

          XRP Chart Pattern Warns of Incoming XRP Price Swings

          U.Today
          Kyber Network / Tether
          -0.23%
          1inch / Tether
          -0.22%
          AAVE / Tether
          -0.19%
          Acala / Tether
          -0.69%
          Fusionist / Tether
          +0.50%

          XRP, the fourth largest cryptocurrency, could be gearing up for significant volatility if a key chart pattern holds. CoinsKid, a market analysis-focused X account, noted in a recent tweet that XRP’s current chart setup might suggest a major price move is on the horizon. Highlighting a pennant forming on the XRP price chart, the analyst added, "There is a move coming here for XRP."

          CoinsKid
          @Coins_Kid

          Unfortunately It looks as though #xrp is creating a bear pennant on the daily timeframe. Pennants tend to be continuation patterns.

          Compression leads to expansion. There is a move coming here for $xrp ⏳️👀 pic.twitter.com/6mALhpybSA

          Jan 11, 2025

          Pennants are continuation chart patterns that occur after strong moves. After a big upward or downward move, buyers or sellers usually pause to catch their breath before pushing the price in the same direction. Because of this, the price typically consolidates and forms a tiny symmetrical triangle, known as a pennant.

          The analyst highlighted in a chart a possible breakout from the pennant pattern that could propel XRP’s price to $4 — a 70% increase from its present value.

          XRP price action

          XRP continues to trade within a symmetrical triangular pattern, suggesting a balance of supply and demand. At the time of writing, XRP was trading in green amid an ongoing market sell-off, up 1.61% in the last 24 hours to $2.35.

          The daily RSI slightly above the midpoint gives a slight edge to the bulls. If the XRP price breaks and closes above the barrier at $2.50, it might spark a rally to $2.72 and then to $2.90. In contrast, a break and close below the support line at the daily SMA 50 at $2.21 might trigger a fall to $1.62.

          XRP metrics bullish

          A slew of XRP metrics have flipped bullish at 2025's early start. According to the on-chain analytics platform Santiment, the amount of hodlers for various crypto assets has fluctuated wildly since the new year.

          XRP saw a 1% increase in holders since 2025's start, adding 58,000 wallets in this span. Santiment highlighted this as bullish, adding that if wallets are rising fast, the community is comfortable with the project for the long term.

          Across social media, sentiment has been shifting for crypto's largest market caps. In a recent report, Santiment noted that XRP enjoyed a nice 18% market cap rise in the first three days of the new year and has been holding up quite well compared to other altcoin peers.

          Since the massive price surge that saw XRP's value jump 455% (from Nov. 1 to Dec. 2), there has been an increased level of optimism from the crowd. Currently, sentiment is slightly bullish. 

          Risk Warnings and Disclaimers
          You understand and acknowledge that there is a high degree of risk involved in trading. Following any strategies or investment methods may lead to potential losses. The content on the site is provided by our contributors and analysts for information purposes only. You are solely responsible for determining whether any trading assets, securities, strategy, or any other product is suitable for investing based on your own investment objectives and financial situation.
          Add to Favorites
          Share

          Solana Retest Key Support Level: Is $130 Or $200 Next?

          NewsBTC
          Kyber Network / Tether
          -0.23%
          1inch / Tether
          -0.22%
          AAVE / Tether
          -0.19%
          Acala / Tether
          -0.69%
          Fusionist / Tether
          +0.50%

          Solana (SOL) has seen a 12% retrace from the Monday high, falling to a crucial zone in the last 24 hours. Some analysts remain bullish ahead of Trump’s inauguration, while others have warned that the cryptocurrency’s bullish momentum could be in danger if the current levels are lost.

          Solana Holds Key Support Zone

          Amid the market retrace, Solana has also lost its New Year highs, falling to its lowest price since the late December retrace. On Monday, SOL registered a 17.3% increase from its yearly opening after retesting the $220 mark.

          However, its bullish momentum was halted after Bitcoin’s price dropped nearly 8% in 24 hours. After hovering between the $190-$199 prince zone, Solana fell below the zone’s lower range, dropping to its current low of $182 on Thursday.

          In the last 24 hours, the cryptocurrency bounced above the $190 range before dipping to the $185 support zone again. A crypto investor pointed out that, despite the latest drop, Solana still holds the price target of $325, as it didn’t fall to the previous low of $175.

          The investor suggested that “as the downtrend is sharp, the uptrend is likely to be sharp as well,” adding that a “V-shaped rebound is likely to occur. The target price may be reached faster than the time shown in that pattern.”

          Trader Crypto General noted that SOL has tested the previous breakout level during the “much-needed correction.” Ahead of the post-election pump, the $180-$185 zone served as a key resistance level, which was later broken when Solana climbed above $200.

          Moreover, this level was retested as support during the late December retraces, serving as a bounce zone for the cryptocurrency. Crypto General suggested that the following days will be “very bullish for the market,” citing Trump’s upcoming inauguration as a potential catalyst.

          With Trump taking the oath, markets are expected to start a parabolic season, taking sol also along with them. My target is around $285.

          Analyst Warns Of These Levels For SOL

          Crypto analyst Ali Martinez warned investors about SOL’s current levels, stating that the cryptocurrency “must not break below $180.” A potential drop below this support zone could send Solana into a 20% to 30% decline.

          Martinez stated that the $150 to $130 range, not seen since September and October, would become “a likely target.” Similarly, analyst Jelle recently stated it would be “Worth keeping an eye on SOL/BTC for the coming weeks.”

          According to the post, SOL’s trading pair against Bitcoin has been at a key zone, suggesting that Solana should reclaim the 0.0022 level soon to continue its bullish momentum, as it currently sits at 0.0020.

          Meanwhile, another market watcher noted that SOL’s performance during Q1 could be dampened due to “over-saturated positioning, a cooling off of pump fun metas, and the looming FTX SOL unlocks that was sold some time ago and have started unlocking, with the biggest unlock coming in March.”

          However, he considers that “from Q2 onwards,” Solana will be a “major winner” due to the possible launch of Solana-based exchange-traded funds (ETFs) and the “potential for new Pump.fun metas” reigniting its bull case. Based on this, the analyst predicts that SOL could hit $400-$500 this year.

          As of this writing, Solana is trading at $191, a 3.3% increase in the daily timeframe.

          Solana, SOL, SOLUSDT
          Risk Warnings and Disclaimers
          You understand and acknowledge that there is a high degree of risk involved in trading. Following any strategies or investment methods may lead to potential losses. The content on the site is provided by our contributors and analysts for information purposes only. You are solely responsible for determining whether any trading assets, securities, strategy, or any other product is suitable for investing based on your own investment objectives and financial situation.
          Add to Favorites
          Share
          FastBull
          Copyright © 2025 FastBull Ltd

          728 RM B 7/F GEE LOK IND BLDG NO 34 HUNG TO RD KWUN TONG KLN HONG KONG

          TelegramInstagramTwitterfacebooklinkedin
          App Store Google Play Google Play
          Products
          Charts

          Chats

          Q&A with Experts
          Screeners
          Economic Calendar
          Data
          Tools
          Membership
          Features
          Function
          Markets
          Copy Trading
          Latest Signals
          Contests
          News
          Analysis
          24/7
          Columns
          Education
          Company
          Careers
          About Us
          Contact Us
          Advertising
          Help Center
          Feedback
          User Agreement
          Privacy Policy
          Business

          White Label

          Data API

          Web Plug-ins

          Poster Maker

          Affiliate Program

          Risk Disclosure

          The risk of loss in trading financial instruments such as stocks, FX, commodities, futures, bonds, ETFs and crypto can be substantial. You may sustain a total loss of the funds that you deposit with your broker. Therefore, you should carefully consider whether such trading is suitable for you in light of your circumstances and financial resources.

          No decision to invest should be made without thoroughly conducting due diligence by yourself or consulting with your financial advisors. Our web content might not suit you since we don't know your financial conditions and investment needs. Our financial information might have latency or contain inaccuracy, so you should be fully responsible for any of your trading and investment decisions. The company will not be responsible for your capital loss.

          Without getting permission from the website, you are not allowed to copy the website's graphics, texts, or trademarks. Intellectual property rights in the content or data incorporated into this website belong to its providers and exchange merchants.

          Not Logged In

          Log in to access more features

          FastBull Membership

          Not yet

          Purchase

          Become a signal provider
          Help Center
          Customer Service
          Dark Mode
          Price Up/Down Colors

          Log In

          Sign Up

          Position
          Layout
          Fullscreen
          Default to Chart
          The chart page opens by default when you visit fastbull.com