Markets
News
Analysis
User
24/7
Economic Calendar
Education
Data
- Names
- Latest
- Prev


Signal Accounts for Members
All Signal Accounts
All Contests


Turkey Trade BalanceA:--
F: --
P: --
Germany Construction PMI (SA) (Nov)A:--
F: --
P: --
Euro Zone IHS Markit Construction PMI (Nov)A:--
F: --
P: --
Italy IHS Markit Construction PMI (Nov)A:--
F: --
P: --
U.K. Markit/CIPS Construction PMI (Nov)A:--
F: --
P: --
France 10-Year OAT Auction Avg. YieldA:--
F: --
P: --
Euro Zone Retail Sales MoM (Oct)A:--
F: --
P: --
Euro Zone Retail Sales YoY (Oct)A:--
F: --
P: --
Brazil GDP YoY (Q3)A:--
F: --
P: --
U.S. Challenger Job Cuts (Nov)A:--
F: --
P: --
U.S. Challenger Job Cuts MoM (Nov)A:--
F: --
P: --
U.S. Challenger Job Cuts YoY (Nov)A:--
F: --
P: --
U.S. Initial Jobless Claims 4-Week Avg. (SA)A:--
F: --
P: --
U.S. Weekly Initial Jobless Claims (SA)A:--
F: --
P: --
U.S. Weekly Continued Jobless Claims (SA)A:--
F: --
P: --
Canada Ivey PMI (SA) (Nov)A:--
F: --
P: --
Canada Ivey PMI (Not SA) (Nov)A:--
F: --
P: --
U.S. Non-Defense Capital Durable Goods Orders Revised MoM (Excl. Aircraft) (SA) (Sept)A:--
F: --
U.S. Factory Orders MoM (Excl. Transport) (Sept)A:--
F: --
P: --
U.S. Factory Orders MoM (Sept)A:--
F: --
P: --
U.S. Factory Orders MoM (Excl. Defense) (Sept)A:--
F: --
P: --
U.S. EIA Weekly Natural Gas Stocks ChangeA:--
F: --
P: --
Saudi Arabia Crude Oil ProductionA:--
F: --
P: --
U.S. Weekly Treasuries Held by Foreign Central BanksA:--
F: --
P: --
Japan Foreign Exchange Reserves (Nov)A:--
F: --
P: --
India Repo RateA:--
F: --
P: --
India Benchmark Interest RateA:--
F: --
P: --
India Reverse Repo RateA:--
F: --
P: --
India Cash Reserve Ratio--
F: --
P: --
Japan Leading Indicators Prelim (Oct)A:--
F: --
P: --
U.K. Halifax House Price Index YoY (SA) (Nov)--
F: --
P: --
U.K. Halifax House Price Index MoM (SA) (Nov)--
F: --
P: --
France Current Account (Not SA) (Oct)--
F: --
P: --
France Trade Balance (SA) (Oct)--
F: --
P: --
France Industrial Output MoM (SA) (Oct)--
F: --
P: --
Italy Retail Sales MoM (SA) (Oct)--
F: --
P: --
Euro Zone Employment YoY (SA) (Q3)--
F: --
P: --
Euro Zone GDP Final YoY (Q3)--
F: --
P: --
Euro Zone GDP Final QoQ (Q3)--
F: --
P: --
Euro Zone Employment Final QoQ (SA) (Q3)--
F: --
P: --
Euro Zone Employment Final (SA) (Q3)--
F: --
Brazil PPI MoM (Oct)--
F: --
P: --
Mexico Consumer Confidence Index (Nov)--
F: --
P: --
Canada Unemployment Rate (SA) (Nov)--
F: --
P: --
Canada Labor Force Participation Rate (SA) (Nov)--
F: --
P: --
Canada Employment (SA) (Nov)--
F: --
P: --
Canada Part-Time Employment (SA) (Nov)--
F: --
P: --
Canada Full-time Employment (SA) (Nov)--
F: --
P: --
U.S. Dallas Fed PCE Price Index YoY (Sept)--
F: --
P: --
U.S. PCE Price Index YoY (SA) (Sept)--
F: --
P: --
U.S. PCE Price Index MoM (Sept)--
F: --
P: --
U.S. Personal Outlays MoM (SA) (Sept)--
F: --
P: --
U.S. Core PCE Price Index MoM (Sept)--
F: --
P: --
U.S. UMich 5-Year-Ahead Inflation Expectations Prelim YoY (Dec)--
F: --
P: --
U.S. Core PCE Price Index YoY (Sept)--
F: --
P: --
U.S. 5-10 Year-Ahead Inflation Expectations (Dec)--
F: --
P: --
U.S. UMich Current Economic Conditions Index Prelim (Dec)--
F: --
P: --
U.S. UMich Consumer Sentiment Index Prelim (Dec)--
F: --
P: --
U.S. UMich 1-Year-Ahead Inflation Expectations Prelim (Dec)--
F: --
P: --
U.S. UMich Consumer Expectations Index Prelim (Dec)--
F: --
P: --


No matching data
Latest Views
Latest Views
Trending Topics
Top Columnists
Latest Update
White Label
Data API
Web Plug-ins
Affiliate Program
View All

No data
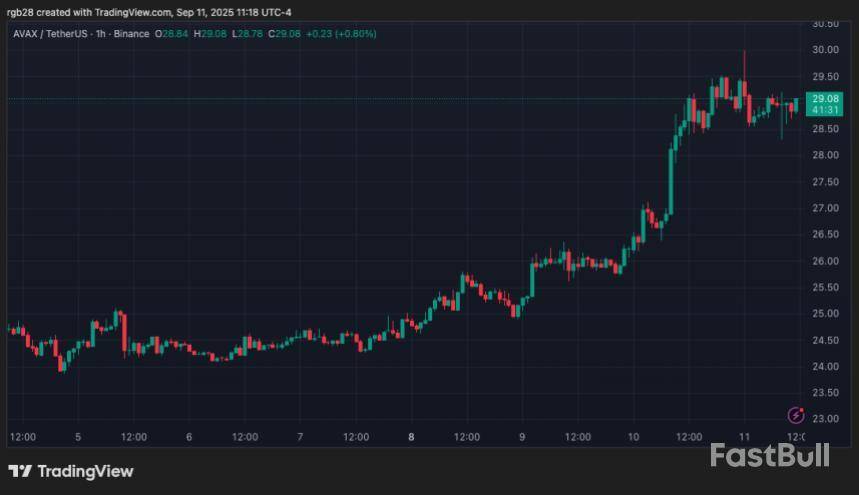
Avalanche (AVAX) has reclaimed a crucial level as support after its recent rally, fueled by multiple bullish developments for the ecosystem. Some analysts forecast a massive rally toward the start-of-year highs if the momentum holds.
Avalanche Eyes 35%-40% Rally
On Thursday, Avalanche hit a seven-month high of $29.99 after breaking out of its multi-month accumulation range and turning the $26.50 resistance into support for the first time since February.
The cryptocurrency has been rallying over the past few days, currently printing five consecutive green candles in the daily timeframe. Analyst Sjuul from AltCryptoGems noted that AVAX had been pushing on the key resistance, holding a series of higher local lows before smashing past this area.
A breakout from this resistance level could set the stage for a rally to the start-of-year range between $40-$45, the market watcher signaled in a previous analysis.
Similarly, Rekt Capital highlighted that Avalanche had been “working to build a cluster of stability” since late July, which resembles the mid-2024 re-accumulation range that preceded Q4 2024’s breakout.
According to the analyst, “if repeated, could open the green pathway toward the red resistance region that is increasingly confluent with the Macro Wedge top.” He explained that AVAX has been forming Higher Lows in the weekly timeframe, positioning the price slightly higher with each retest.
As a result, a weekly close above the $26 area, followed by a successful post-breakout retest, would enable AVAX price to reclaim the $30 resistance region and attempt to retest the Macro Wedge Top, currently around the $35 mark.
Market watcher CW pointed out that Avalanche’s next sell wall exists around the $35-$36 area, suggesting that the cryptocurrency could retest this level in the coming days if momentum continues.
Meanwhile, the next major support zone sits around the $24 level, which could be revisited in case of a rejection from the key resistance.
Crypto Treasuries, Partnerships Drive Momentum
As the market turns green again, multiple bullish developments have also fueled AVAX’s rally. According to recent reports, the Avalanche Foundation, the nonprofit behind the project, is seeking to raise $1 billion to establish two US-based crypto treasury vehicles.
One of the deals, led by Hivemind Capital and advised by SkyBridge’s founder Anthony Scaramucci, aims to raise up to $500 million in a private investment in a Nasdaq-traded company. It is expected to be completed by the end of September.
The other deal, which is expected to be closed in October, seeks to raise the same amount and involves a special purpose acquisition (SPAC) vehicle sponsored by Dragonfly Capital.
Notably, the funds from the two deals will reportedly be destined to purchase millions of AVAX from the Avalanche Foundation’s reserves, which could continue to fuel momentum for the cryptocurrency.
Meanwhile, Ava Labs secured a strategic partnership with Toyota Blockchain Lab to build a blockchain-based system, the Mobility Open Network (MON), designed to pave the road for new emerging use cases, including robotaxi fleets.
Additionally, the company behind the Avalanche Network also signed a Memorandum of Understanding (MoU) agreement with WeBlock to push Real-World Asset (RWA) tokenization and stablecoins in South Korea.
As of this writing, Avalanche trades at $29.04, a 22.7% increase in the monthly timeframe.
XRP price gained pace for a move above the $3.00 resistance. The price is now consolidating gains and might start another increase above $3.080.
XRP Price Eyes Upside Break
XRP price managed to stay above the $2.880 level and started a fresh increase, beating Bitcoin and Ethereum. The price climbed above the $2.920 and $2.980 resistance levels.
The bulls even pumped the price above the $3.020 level. A high was formed at $3.0725 and the price is now consolidating gains. There was a minor decline and the price tested the 23.6% Fib retracement level of the upward move from the $2.9365 swing low to the $3.0725 high.
The price is now trading above $3.00 and the 100-hourly Simple Moving Average. Besides, there is a key bullish trend line forming with support at $3.020 on the hourly chart of the XRP/USD pair.
If the bulls protect the $3.00 support, the price could attempt another increase. On the upside, the price might face resistance near the $3.050 level. The first major resistance is near the $3.080 level. A clear move above the $3.080 resistance might send the price toward the $3.120 resistance. Any more gains might send the price toward the $3.150 resistance. The next major hurdle for the bulls might be near $3.20.
Downside Correction?
If XRP fails to clear the $3.080 resistance zone, it could continue to move down. Initial support on the downside is near the $3.00 level. The next major support is near the $2.9880 level and the 50% Fib retracement level of the upward move from the $2.9365 swing low to the $3.0725 high.
If there is a downside break and a close below the $2.9880 level, the price might continue to decline toward $2.950. The next major support sits near the $2.920 zone, below which the price could gain bearish momentum.
Technical Indicators
Hourly MACD – The MACD for XRP/USD is now gaining pace in the bullish zone.
Hourly RSI (Relative Strength Index) – The RSI for XRP/USD is now above the 50 level.
Major Support Levels – $3.020 and $3.00.
Major Resistance Levels – $3.080 and $3.120.
As Ethereum (ETH) trades in the mid $4,000 range, the Chicago Mercantile Exchange (CME) futures open interest (OI) for the digital asset continues to hit new highs. Against that backdrop, analysts are now predicting a new all-time high (ATH) for ETH later this year.
Ethereum New ATH By End Of 2025?
According to a CryptoQuant Quicktake post by contributor PelinayPA, Ethereum’s CME futures OI is steadily moving towards new highs. The analyst brought attention to past data about Ethereum futures OI to predict its next move.
Back in 2021-2022, Ethereum futures OI remained relatively low, largely dominated by 1-2 month contracts. At the time, although ETH gained bullish momentum, institutional exposure to the cryptocurrency on CME was still limited.
In sharp contrast, during the 2022 bear market, a drop in the ETH price led to a steep decline in its OI. While the period was still dominated by short-term contracts, long-term contracts stayed low, indicating weak institutional confidence in ETH.
However, a trend change was observed during the 2023-2024 recovery as Ethereum OI started to rise again – specifically among 3-6 month contracts. Simultaneously, institutional demand grew alongside ETH’s price.
Fast-forward to 2025, Ethereum OI has surged to new highs. As ETH rallied to the $4,500 to $5,000 range, there was a noticeable growth in short-term contracts. This dynamic indicates strong institutional participation and demand for derivatives.
The CryptoQuant analyst explained the implications of two potential combinations of OI and contract concentration. First, high OI with concentrated short-term contracts can lead to increased volatility, potentially leading to sharp swings and liquidation cascades.
On the contrary, rising long-term OI in 3-6 month contracts indicates growing institutional confidence and potential for higher ETH prices in the long-term. That said, crowded leveraged positions could trigger rapid corrections in the short term. PelinayPA added:
ETH is trading around $5K (near ATH) with record OI on CME clear evidence of institutional FOMO. While this supports the ongoing bull trend, liquidation risk is high. Short term volatility and corrections are likely, but the medium to long term outlook remains bullish.
Concluding, the analyst predicted that ETH could reach the $6,800 resistance level by the end of 2025. However, any deterioration in the global macroeconomic outlook could stall ETH’s momentum temporarily.
Case For A New ETH ATH
Besides the aforementioned prediction on the back of rising institutional interest in ETH, positive exchange data is also likely to benefit the cryptocurrency. For example, recent ETH outflows from Binance drove the supply ratio to a new low.
In addition, an increasing amount of ETH continues to be staked on the Ethereum network, strengthening the smart contract platform’s fundamentals and making it more robust. At press time, ETH trades at $4,409, down 0.7% in the past 24 hours.
Ethereum price started a fresh increase and climbed above $4,500. ETH is now consolidating and might aim for more gains if it clears $4,550.
Ethereum Price Eyes More Gains
Ethereum price started a recovery wave after it formed a base above the $4,320 zone, like Bitcoin. ETH price was able to climb above the $4,350 and $4,440 resistance levels.
The price even climbed above $4,500. A high was formed at $4,531 and the price is now consolidating gains. There was a minor pullback, but the price stayed above the 23.6% Fib retracement level of the upward move from the $4,268 swing low to the $4,531 high.
Ethereum price is now trading above $4,500 and the 100-hourly Simple Moving Average. Besides, there is a bullish trend line forming with support at $4,470 on the hourly chart of ETH/USD.
On the upside, the price could face resistance near the $4,530 level. The next key resistance is near the $4,550 level. The first major resistance is near the $4,580 level. A clear move above the $4,580 resistance might send the price toward the $4,650 resistance. An upside break above the $4,650 resistance might call for more gains in the coming sessions. In the stated case, Ether could rise toward the $4,740 resistance zone or even $4,800 in the near term.
Another Drop In ETH?
If Ethereum fails to clear the $4,550 resistance, it could start a fresh decline. Initial support on the downside is near the $4,470 level and the trend line. The first major support sits near the $4,450 zone.
A clear move below the $4,450 support might push the price toward the $4,400 support. Any more losses might send the price toward the $4,370 pivot level in the near term. The next key support sits at $4,270.
Technical Indicators
Hourly MACD – The MACD for ETH/USD is gaining momentum in the bullish zone.
Hourly RSI – The RSI for ETH/USD is now above the 50 zone.
Major Support Level – $4,450
Major Resistance Level – $4,550
Bitcoin price is showing positive signs above $114,500. BTC is now consolidating and might rise further if it clears the $116,200 resistance zone.
Bitcoin Price Gains Traction
Bitcoin price started a fresh recovery wave from the $111,200 zone. BTC managed to climb above the $112,500 and $113,500 resistance levels.
The bulls were able to push the price above $114,000 and $115,000. The price traded as high as $116,298 and recently started a consolidation phase. There was a minor decline below $115,800, but the price is still above the 23.6% Fib retracement level of the recent move from the $110,815 swing low to the $116,298 high.
Bitcoin is now trading above $114,500 and the 100 hourly Simple moving average. Besides, there is a bullish trend line forming with support at $115,000 on the hourly chart of the BTC/USD pair.
Immediate resistance on the upside is near the $116,000 level. The first key resistance is near the $116,200 level. The next resistance could be $116,800. A close above the $116,800 resistance might send the price further higher. In the stated case, the price could rise and test the $117,500 resistance level. Any more gains might send the price toward the $118,400 level. The next barrier for the bulls could be $118,800.
Another Decline In BTC?
If Bitcoin fails to rise above the $116,200 resistance zone, it could start a fresh decline. Immediate support is near the $115,000 level and the trend line zone. The first major support is near the $113,550 level or the 50% Fib retracement level of the recent move from the $110,815 swing low to the $116,298 high.
The next support is now near the $113,000 zone. Any more losses might send the price toward the $112,500 support in the near term. The main support sits at $110,500, below which BTC might decline sharply.
Technical indicators:
Hourly MACD – The MACD is now gaining pace in the bullish zone.
Hourly RSI (Relative Strength Index) – The RSI for BTC/USD is now above the 50 level.
Major Support Levels – $115,000, followed by $113,500.
Major Resistance Levels – $116,000 and $116,200.
Crypto markets are “on the edge” of a broad altcoin breakout, with XRP, Dogecoin, and Cardano positioned to lead, according to technical strategist CryptoInsightUK. In a video analysis released today, the analyst argues that structural signals across major charts—supported by improving macro conditions—tilt the risk-reward toward a decisive upside move, provided US inflation data doesn’t deliver a negative surprise.
The setup begins with Bitcoin grinding higher into range highs while still sitting in what he calls “a position of potential reversal,” a juncture he links to today’s US CPI print after a softer-than-expected PPI reading. “If CPI comes in weak today, I think the markets will rip,” he said, framing inflation as the swing factor that could unlock risk appetite across crypto.
Cardano, Doge, XRP Ready For Lift-Off
He contends the strongest signals are emerging away from Bitcoin and Ethereum. On Ethereum, liquidity “still” sits below price around $4,100, with a pocket of resting orders above, leaving open the possibility of “a quick flush… to take that” before higher levels are attacked. “How much of a drop would we need to sweep this liquidity? Six percent,” he said, adding that the base of recent transactions “looks pretty good as a support,” even if a brief downside wick cannot be ruled out.
The case for altcoins rests largely on visible liquidity concentrations and higher-timeframe structures. Cardano (ADA), he said, exhibits a favorable imbalance with “a… load of liquidity” stacked above “around one dollar,” and additional magnets in the $1.21 and $1.40 areas if momentum expands.
He emphasized the sequence of higher lows and higher highs that preceded a consolidation, a pattern he compared across several charts. Dogecoin (DOGE), in his view, mirrors the same anatomy on a larger timeframe: a prior higher-high/higher-low sequence, a tightening range, and “liquidity above us,” with a push through $0.29 opening a path to targeting $0.45.
“I’ve been saying for a while tokens like DOGE look like they are going to absolutely send it,” he said. For XRP, he argued that price action has “led the cycle” and recently broke a well-tracked downtrend on the daily and four-hour charts, while shorter-term liquidity maps now show concentrations overhead.
Beyond single names, he anchored his thesis in market-wide breadth gauges. He highlighted “Total 3”—the combined market capitalization of all crypto assets excluding Bitcoin and Ethereum—pressing against prior highs and “knocking at the door… for price discovery.”
In a closely related lens, he said “Total 2” (market cap ex-Bitcoin) is one incremental push away—“half a percent higher”—from a highest-ever weekly close, with three days left in the candle. The evolving formations, he added, can be interpreted as an “ascending wedge” that morphs into a “cup and handle” after a textbook Wyckoff-style accumulation and back-test, the kind of structural progression that often resolves with a powerful range break.
The Core Thesis
Rotation dynamics are at the core of his call. Drawing on an ETH-vs-BTC dominance composite, he said the tape “looks like weakness” for the pair, with heavier volume on down moves in that ratio—an indication, he believes, that capital is migrating from Bitcoin and Ethereum into the broader altcoin complex.
“If [Bitcoin] dominance breaks down… it’s better for altcoins,” he said. “As long as capital’s flowing into the market, I don’t really mind which starts to outperform which… but if we have a significant rise in Bitcoin’s price and a drop in dominance, it means that altcoins are going to be absolutely sending it.”
At the same time, he flagged the near-term fork in the road. Markets are testing “decision” levels into macro data, and a brief liquidity sweep lower—on Bitcoin and ETH in particular—remains plausible before any sustained impulse. “We’re not in a breakout territory here yet,” he cautioned. “We’ve seen the first signs of it… [and] we could reject here and consolidate for a little bit longer… but one catalyst here and it’s green season in my opinion for crypto generally.”
Throughout the analysis, the analyst returned to a handful of price signposts traders are likely to watch: ADA gravity around $1.00 with follow-ups near $1.21 and $1.40; DOGE confirmation above ~$0.29 and then $0.45 as the next objective; and XRP’s break of descending resistance with liquidity pools sitting overhead on intraday maps.
If the macro side cooperates, his base case is unambiguous. “I think the breakout is imminent,” he said, pointing to synchronized strength across Total 2 and Total 3, gold’s recent breakout, and equities at or near all-time highs. “This is the sort of time where we’re going to break out,” he added. “Massive breakouts” in altcoins, when they come, often unfold as “a few weeks or a few days of massively green candles.”
Even so, he closed with a reminder that timing remains hostage to catalysts. “It’s decision time for the market,” he said. “Could reject here and consolidate… but one catalyst here and it’s green season.”
At press time, XRP traded at $2.99.
Despite a brief pause in its trajectory, institutional appetite for Ethereum remains strong. In fact, a whopping $342 million worth of ETH has left a prominent cryptocurrency exchange.
Such movements of funds are typically expected to have a bullish impact on ETH’s price.Supply Tightens
According to an update shared by Lookonchain, in just the past 10 hours, four newly created wallets withdrew a total of 78,229 ETH (which is worth approximately $342 million) from Kraken. Such large-scale movements from exchanges often signal that institutions are moving assets into cold storage, which reflects a long-term bullish stance.
Rising institutional accumulation reflects increasing faith in ETH’s long-term prospects as it trades above $4,430. By withdrawing significant amounts from exchanges, these investors limit circulating supply, thereby creating tighter liquidity conditions that could drive ETH prices higher if demand persists.
Amid these significant withdrawals, market experts are turning to technical indicators for clues on ETH’s next move.
Popular crypto analyst Ali Martinez, for one, observed that Ethereum is poised for a significant move, as he pointed to a Bollinger Bands squeeze as a technical setup for heightened volatility.
Meanwhile, another market commentator, Ted Pillows, stressed the importance of key price levels: a daily close above $4,500 could open the door for a new all-time high, while a rejection at this resistance might push Ethereum down to the $4,000-$4,100 range.
It is also important to note that Ethereum hassurgedahead of Bitcoin across multiple fronts. Since early August, ETH captured 32.9% of spot market share versus BTC’s 32.6%, and even peaked at 41% in late August with $480 billion in spot volume. Futures momentum has been equally strong as it hit a record $3.08 trillion. Institutional appetite also remains high, with ETH ETFs drawing $10 billion in inflows this year and AUM reaching $25 billion.
But not all signals are aligned, as broader market data suggest Ethereum may face underlying pressures. Structural pressures remain that could temper ETH’s upward momentum.Ethereum At a Crossroads
Matrixport’s recent report revealed that treasury companies have gone quiet and net asset values are hovering near 1, which could mean that investors are reluctant to pay a premium for these shares. Even Bitcoin treasury companies are experiencing sharp declines in NAVs, in line with broader risk-off sentiment among crypto treasuries.
On top of that, Ethereum’s trading volumes have plunged from $122 billion to just $41 billion, while futures open interest has barely budged. This divergence helps explain why ETH prices remain relatively steady, but with volumes drying up, leveraged longs face growing pressure, especially as high funding rates make holding these positions increasingly expensive.
The report warned that even a potential bullish catalyst, such as recent US inflation data or the upcoming FOMC meeting, may not fully offset the risks posed by thinning liquidity.
White Label
Data API
Web Plug-ins
Poster Maker
Affiliate Program
The risk of loss in trading financial instruments such as stocks, FX, commodities, futures, bonds, ETFs and crypto can be substantial. You may sustain a total loss of the funds that you deposit with your broker. Therefore, you should carefully consider whether such trading is suitable for you in light of your circumstances and financial resources.
No decision to invest should be made without thoroughly conducting due diligence by yourself or consulting with your financial advisors. Our web content might not suit you since we don't know your financial conditions and investment needs. Our financial information might have latency or contain inaccuracy, so you should be fully responsible for any of your trading and investment decisions. The company will not be responsible for your capital loss.
Without getting permission from the website, you are not allowed to copy the website's graphics, texts, or trademarks. Intellectual property rights in the content or data incorporated into this website belong to its providers and exchange merchants.
Not Logged In
Log in to access more features

FastBull Membership
Not yet
Purchase
Log In
Sign Up