• Trade
  • Markets
  • Copy
  • Contests
  • 24/7
  • Calendar
  • Q&A
  • Chats
Screeners
SYMBOL
LAST
BID
ASK
HIGH
LOW
NET CHG.
%CHG.
SPREAD
SOURCE
SPX
S&P 500 Index
7630.12
7630.12
7630.12
7652.76
7550.84
+10.74
+ 0.14%
--
--
DJI
Dow Jones Industrial Average
52691.82
52691.82
52691.82
52751.22
52363.55
+205.33
+ 0.39%
--
--
IXIC
NASDAQ Composite Index
25479.95
25479.95
25479.95
25597.23
25068.28
+13.77
+ 0.05%
--
--
USDX
US Dollar Index
103.068
103.068
103.148
103.087
102.690
+0.265
+ 0.26%
--
--
EURUSD
Euro / US Dollar
1.10525
1.10525
1.10534
1.11023
1.10525
-0.00355
-0.32%
--
--
GBPUSD
Pound Sterling / US Dollar
1.32290
1.32290
1.32302
1.32806
1.32208
-0.00422
-0.32%
--
--
XAUUSD
Gold / US Dollar
3873.59
3873.59
3874.00
4000.42
3852.27
-114.28
-2.87%
--
--
WTI
Light Sweet Crude Oil
86.721
86.721
86.751
86.869
84.204
+1.306
+ 1.53%
--
--

Community Accounts

Signal Accounts
--
Profit Accounts
--
Loss Accounts
--
View More

Become a signal provider

Sell trading signals to earn additional income

View More

Guide to Copy Trading

Get started with ease and confidence

View More

Signal Accounts for Members

All Signal Accounts

Best Return
  • Best Return
  • Best P/L
  • Best MDD
Past 1W
  • Past 1W
  • Past 1M
  • Past 1Y

All Contests

  • All
  • Recommend
  • Stocks
  • Cryptocurrencies
  • Central Banks
  • Trump Updates
  • Featured News
Top News Only
Share

Fitch Ratings: US Consumer Spending Strengthens Amid Affordability Pressures; Market Downside Is The Main Risk

Share

Trump Urged The Senate To Immediately Move Forward With The Budget Reconciliation Bill

Share

U.S. Treasury Secretary Bessant: Washington Has Long Viewed The Decline Of U.S. Industry As Inevitable. President Trump Recognized That It Was A Result Of Policy Choices And Therefore Reversible. Following Trump's Trade Policy Reset And The Implementation Of His Historic Tax Cuts, The Industry Regained Momentum, Demonstrating That The Right Policies Can Reverse Decades Of Industrial Decline. The Industry Has Expanded For Ten Consecutive Months, Adding 101,000 Jobs So Far This Year. Output Rose Again In September, And Job Openings Climbed To 584,000, The Highest Level On Record Before The COVID-19 Pandemic

Share

The Deputy Governor Of The Central Bank Of Mexico Said That If Inflation Fails To Fall Or The Federal Reserve Continues To Raise Interest Rates, The Central Bank Of Mexico May Need To Further Tighten Its Policy

Share

The Deputy Governor Of The Central Bank Of Mexico Said The Recent Key Interest Rate Cuts Were "confusing And Sent The Wrong Signal" Because Inflation Is Currently On The Rise

Share

The November Diesel Futures Contract On The Intercontinental Exchange Settled At $1,341.25 Per Tonne

Share

U.S. Crude Oil Inventories Rose By 4.66 Million Barrels Last Week, Compared With Analysts' Expectations Of A Decrease Of 852,600 Barrels And A Decrease Of 865,000 Barrels The Previous Week

Share

Democrats Are Seeking Access To Communications Records Between The Commerce Department And Jensen Huang

Share

The Federal Reserve Updated Its 2027 Federal Open Market Committee Schedule, Canceling The October Interest Rate Meeting

Share

The Yield On The 10-year U.S. Treasury Note Rose 10 Basis Points To 5.09% On The Day

Share

Goldman Sachs: The Baseline Scenario Projects An Average Brent Crude Oil Price Of $88 Per Barrel And An Average European TTF Natural Gas Price Of €45 Per Megawatt-hour In 2027

Share

Israel Has Announced It Will Ban French Far-left Leader Jean-Luc Mélenchon From Entering The Country

Share

The Yen Briefly Rose To 159.33 Against The Dollar After Hitting The 160 Level

Share

Enel, Italy's National Power Company, Reported Adjusted Net Profit Of €6.02 Billion For The First Three Quarters, Exceeding The Forecast Of €5.76 Billion; Revenue Was €65.02 Billion, Also Exceeding The Forecast Of €61.35 Billion

Share

Chicago Federal Reserve President Goolsby: I Don't Want To Predict The Direction Of Monetary Policy

Share

European Central Bank Vice President Vujicic: France Needs Credible Fiscal Adjustments

Share

The Settlement Price For UK ICE Natural Gas Futures For December Was 230.65 Pence Per Thermometer

Share

Chicago Federal Reserve President Goolsby: The Fed Has Ample Room To Discuss Policy Options

Share

The US Dollar Rose Above 160 Against The Japanese Yen, Up 0.14% On The Day

Share

The Kremlin Has Stated That It Hopes Europe Will Support The Idea Of ​​reaching An Agreement On A New European Security Architecture

TIME
ACT
FCST
PREV
IMPACT
U.K. Trade Balance (Sept)

A:--

F: --

P: --

GBPUSD
  • GBPUSD
  • XAUUSD
  • XAGUSD
  • WTI
  • USDX
U.K. Construction Output MoM (SA) (Sept)

A:--

F: --

P: --
GBPUSD
  • GBPUSD
  • XAUUSD
  • XAGUSD
  • WTI
  • USDX
U.K. GDP YoY (SA) (Sept)

A:--

F: --

P: --
GBPUSD
  • GBPUSD
  • XAUUSD
  • XAGUSD
  • WTI
  • USDX
U.K. Services Index MoM (Sept)

A:--

F: --

P: --
GBPUSD
  • GBPUSD
  • XAUUSD
  • XAGUSD
  • WTI
  • USDX
U.K. Trade Balance EU (SA) (Sept)

A:--

F: --

P: --

GBPUSD
  • GBPUSD
  • XAUUSD
  • XAGUSD
  • WTI
  • USDX
U.K. Trade Balance Non-EU (SA) (Sept)

A:--

F: --

P: --
GBPUSD
  • GBPUSD
  • XAUUSD
  • XAGUSD
  • WTI
  • USDX
U.K. Construction Output YoY (Sept)

A:--

F: --

P: --
GBPUSD
  • GBPUSD
  • XAUUSD
  • XAGUSD
  • WTI
  • USDX
U.K. Monthly GDP 3M/3M Change (Sept)

A:--

F: --

P: --
GBPUSD
  • GBPUSD
  • XAUUSD
  • XAGUSD
  • WTI
  • USDX
South Africa Mining Output YoY (Sept)

A:--

F: --

P: --

XAUUSD
  • XAUUSD
  • XAGUSD
  • WTI
  • USDX
South Africa Gold Production YoY (Sept)

A:--

F: --

P: --

XAUUSD
  • XAUUSD
  • XAGUSD
  • WTI
  • USDX
India CPI YoY (Oct)

A:--

F: --

P: --

XAUUSD
  • XAUUSD
  • XAGUSD
  • WTI
  • USDX
U.K. Refinitiv/Ipsos Primary Consumer Sentiment Index (PCSI) (Nov)

A:--

F: --

P: --

GBPUSD
  • GBPUSD
  • XAUUSD
  • XAGUSD
  • WTI
  • USDX
Brazil CPI YoY (Oct)

A:--

F: --

P: --

XAUUSD
  • XAUUSD
  • XAGUSD
  • WTI
  • USDX
U.S. Weekly Initial Jobless Claims (SA)

A:--

F: --

P: --
XAUUSD
  • XAUUSD
  • XAGUSD
  • WTI
  • USDX
U.S. Initial Jobless Claims 4-Week Avg. (SA)

A:--

F: --

P: --
XAUUSD
  • XAUUSD
  • XAGUSD
  • WTI
  • USDX
U.S. Weekly Continued Jobless Claims (SA)

A:--

F: --

P: --
XAUUSD
  • XAUUSD
  • XAGUSD
  • WTI
  • USDX
Canada Building Permits MoM (SA) (Sept)

A:--

F: --

P: --
USDCAD
  • USDCAD
  • XAUUSD
  • XAGUSD
  • WTI
  • USDX
FOMC Member Hammack Speaks
U.S. Existing Home Sales Annualized MoM (Oct)

A:--

F: --

P: --
USDX
  • USDX
  • XAUUSD
  • XAGUSD
  • WTI
U.S. Existing Home Sales Annualized Total (Oct)

A:--

F: --

P: --
USDX
  • USDX
  • XAUUSD
  • XAGUSD
  • WTI
Germany Current Account (Not SA) (Sept)

A:--

F: --

P: --
EURUSD
  • EURUSD
  • XAUUSD
  • XAGUSD
  • WTI
  • USDX
China, Mainland M2 Money Supply YoY (Oct)

--

F: --

P: --

China, Mainland M0 Money Supply YoY (Oct)

--

F: --

P: --

China, Mainland M1 Money Supply YoY (Oct)

--

F: --

P: --

U.S. EIA Weekly Gasoline Stocks Change

A:--

F: --

P: --

WTI
  • WTI
  • XAUUSD
  • XAGUSD
  • USDX
U.S. EIA Weekly Crude Demand Projected by Production

--

F: --

P: --

U.S. EIA Weekly Cushing, Oklahoma Crude Oil Stocks Change

A:--

F: --

P: --

WTI
  • WTI
  • XAUUSD
  • XAGUSD
  • USDX
U.S. EIA Weekly Crude Stocks Change

A:--

F: --

P: --

WTI
  • WTI
  • XAUUSD
  • XAGUSD
  • USDX
U.S. EIA Weekly Crude Oil Imports Changes

A:--

F: --

P: --

WTI
  • WTI
  • XAUUSD
  • XAGUSD
  • USDX
U.S. EIA Weekly Heating Oil Stock Changes

A:--

F: --

P: --

WTI
  • WTI
  • XAUUSD
  • XAGUSD
  • USDX
U.S. 30-Year Bond Auction Avg. Yield

--

F: --

P: --

U.S. Budget Balance (Oct)

--

F: --

P: --

Argentina CPI MoM (Oct)

--

F: --

P: --

U.S. Weekly Treasuries Held by Foreign Central Banks

--

F: --

P: --

New York Federal Reserve President Williams delivered a speech.
France HICP Final MoM (Oct)

--

F: --

P: --

China, Mainland Outstanding Loans Growth YoY (Oct)

--

F: --

P: --

IEA Oil Market Report
Euro Zone Trade Balance (Not SA) (Sept)

--

F: --

P: --

Euro Zone Trade Balance (SA) (Sept)

--

F: --

P: --

Euro Zone Employment YoY (SA) (Q3)

--

F: --

P: --

Euro Zone GDP Revised YoY (Q3)

--

F: --

P: --

India Deposit Gowth YoY

--

F: --

P: --

Brazil Retail Sales MoM (Sept)

--

F: --

P: --

Canada Wholesale Sales MoM (SA) (Sept)

--

F: --

P: --

Canada Wholesale Sales YoY (Sept)

--

F: --

P: --

Canada Manufacturing Unfilled Orders MoM (Sept)

--

F: --

P: --

Canada Manufacturing New Orders MoM (Sept)

--

F: --

P: --

U.S. PPI MoM (SA) (Oct)

--

F: --

P: --

U.S. PPI YoY (Oct)

--

F: --

P: --

U.S. Core PPI MoM (SA) (Oct)

--

F: --

P: --

U.S. Core PPI YoY (Oct)

--

F: --

P: --

Canada Manufacturing Inventory MoM (Sept)

--

F: --

P: --

Canada Wholesale Inventory MoM (Sept)

--

F: --

P: --

Canada Wholesale Inventory YoY (Sept)

--

F: --

P: --

U.S. EIA Weekly Natural Gas Stocks Change

--

F: --

P: --

Russia CPI YoY (Oct)

--

F: --

P: --

U.S. Weekly Total Rig Count

--

F: --

P: --

U.S. Weekly Total Oil Rig Count

--

F: --

P: --

Saudi Arabia CPI YoY (Oct)

--

F: --

P: --

Japan Real GDP QoQ (Q3)

--

F: --

P: --

Q&A with Experts
    • All
    • Chatrooms
    • Groups
    • Friends
    Sanjeev Ku flag
    i too have open position in btc . sell in btc at 88k but in demo and gold sell at 4800 haha
    Areeba Mini❣️❣️ flag
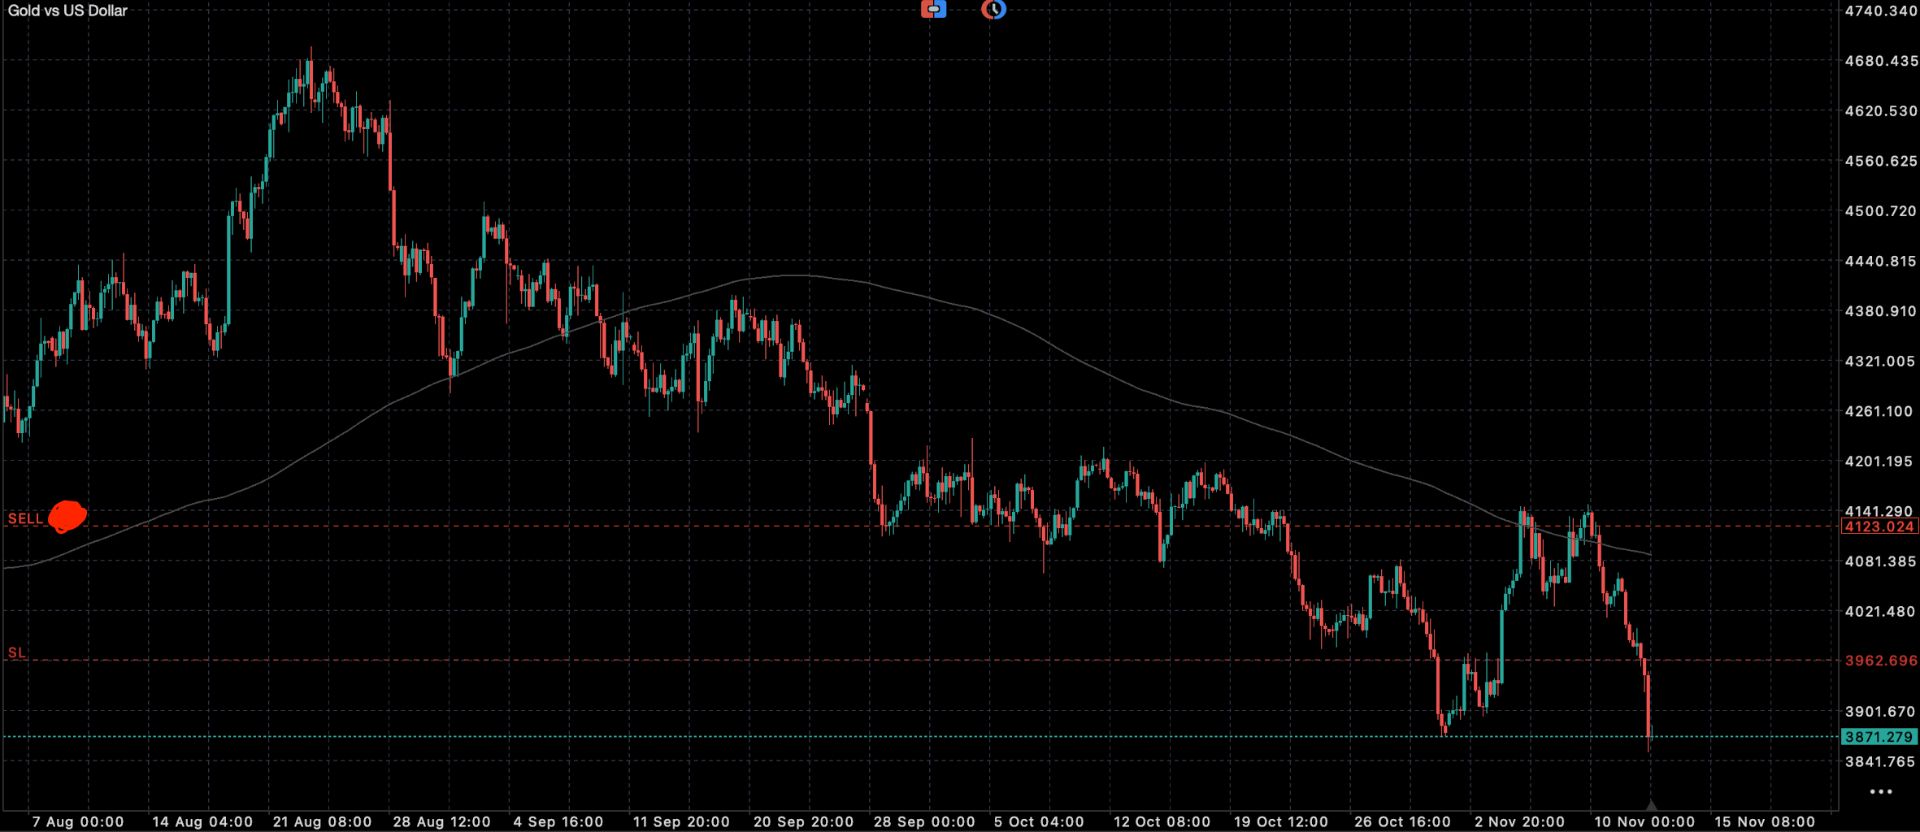
    Gold target 3390 ⬇️⬇️☑️
    EuroTrader flag
    Sanjeev Ku
    i too have open position in btc . sell in btc at 88k but in demo and gold sell at 4800 haha
    @Sanjeev KuWow that's really good, that means you saw this good drop very early?
    EuroTrader flag
    Areeba Mini❣️❣️
    Gold target 3390 ⬇️⬇️☑️
    @Areeba Mini❣️❣️I couldn't find the chart that you shared earlier friend
    EuroTrader flag
    Areeba Mini❣️❣️
    Gold target 3390 ⬇️⬇️☑️
    @Areeba Mini❣️❣️From this, seems like you are heaving shorting gold my friend
    Sanjeev Ku flag
    EuroTrader
    @Sanjeev KuWow that's really good, that means you saw this good drop very early?
    @EuroTrader bro account is demo 🤣🤣🤣
    Sanjeev Ku flag
    100 points up then tgt 4600 and 200 points down then just saw 🤣🤣🤣
    SlowBear ⛅ flag
    Areeba Mini❣️❣️
    Gold target 3390 ⬇️⬇️☑️
    @Areeba Mini❣️❣️Well i thought you alredy closed your gold short bro
    SlowBear ⛅ flag
    Sanjeev Ku flag
    yeh at 3945 with big bold disclaimer my tp hit haha
    SlowBear ⛅ flag
    Areeba Mini❣️❣️
    Gold target 3390 ⬇️⬇️☑️
    @Areeba Mini❣️❣️ Wait did youjust say target is 3390 or 3890? which one is it?
    Sanjeev Ku flag
    haha
    Sanjeev Ku flag
    ask where is gold going now from 3871. you will come to know the answer
    SlowBear ⛅ flag
    Sanjeev Ku
    yeh at 3945 with big bold disclaimer my tp hit haha
    @Sanjeev KuDamn you will soon have a full household name here now haha
    Sanjeev Ku flag
    SlowBear ⛅
    @Sanjeev KuDamn you will soon have a full household name here now haha
    @SlowBear ⛅ haha.
    Osaghae Cephas flag
    EuroTrader
    @Osaghae Cephasyeah, I don't even think anyone trades it mate
    @EuroTraderok then y ask mate😑
    Osaghae Cephas flag
    EuroTrader
    @Osaghae Cephaswe juts use it to know the strength and weaknesses of dollar which will help us to understand other pairs
    @EuroTraderoh ok send a screen shot and espliain how dxy I read mate pls for meeee😉🥰🥰
    2952070 flag
    hiii
    Areeba Mini❣️❣️ flag
    SlowBear ⛅
    @Areeba Mini❣️❣️ Wait did youjust say target is 3390 or 3890? which one is it?
    @Sanjeev Ku@SlowBear ⛅friend For a few days, gold will surely fall to 3390
    2952070 flag
    how are you Trader
    Type here...
    Add Symbol or Code

      No matching data

      All
      Recommend
      Stocks
      Cryptocurrencies
      Central Banks
      Trump Updates
      Featured News
      • All
      • Russia-Ukraine Conflict
      • Middle East Flashpoint
      • All
      • Russia-Ukraine Conflict
      • Middle East Flashpoint
      Search
      Products

      Charts Free Forever

      Chats Q&A with Experts
      Screeners Economic Calendar Data Tools
      Membership Features
      Data Warehouse Market Trends Institutional Data Policy Rates Macro

      Market Trends

      Market Sentiment Order Book Forex Correlations

      Top Indicators

      Charts Free Forever
      Markets

      News

      24/7 Analysis Education

      Latest Views

      Latest Update

      Signals

      Copy Rankings Latest Signals Become a signal provider AI Rating
      Contests
      Brokers

      Overview Brokers Assessment Rankings Regulators News Claims
      Broker listing Forex Brokers Comparison Tool Live Spread Comparison Scam
      Q&A Complaint Scam Alert Videos Tips to Detect Scam
      More

      Business
      Events
      Careers About Us Advertising Help Center

      White Label

      Broker API

      Data API

      Web Plug-ins

      Affiliate Program

      Awards Institution Evaluation IB Seminar Salon Event Exhibition
      Vietnam Thailand Singapore Dubai
      Fans Party Investment Sharing Session
      FastBull Summit BrokersView Expo
      Recent Searches
        Top Searches
          Markets
          Analysis
          User
          24/7
          Economic Calendar
          Education
          Data
          • Names
          • Latest
          • Prev

          View All

          No data

          Scan to Download

          Faster Charts, Chat Faster!

          Download
          English
          • English
          • Español
          • العربية
          • Bahasa Indonesia
          • Bahasa Melayu
          • Tiếng Việt
          • ภาษาไทย
          • Français
          • Italiano
          • Türkçe
          • Русский язык
          • 简中
          • 繁中
          Open Account
          Search
          Products
          Charts Free Forever
          Markets
          News
          Signals

          Copy Rankings Latest Signals Become a signal provider AI Rating
          Contests
          Brokers

          Overview Brokers Assessment Rankings Regulators News Claims
          Broker listing Forex Brokers Comparison Tool Live Spread Comparison Scam
          Q&A Complaint Scam Alert Videos Tips to Detect Scam
          More

          Business
          Events
          Careers About Us Advertising Help Center

          White Label

          Broker API

          Data API

          Web Plug-ins

          Affiliate Program

          Awards Institution Evaluation IB Seminar Salon Event Exhibition
          Vietnam Thailand Singapore Dubai
          Fans Party Investment Sharing Session
          FastBull Summit BrokersView Expo

          Alarming $1B Drain Hits Spot ETH ETFs in 6-Day Streak – Is a Deeper Crash Imminent?

          CryptoNews
          Bitcoin / Tether
          -2.86%
          1inch / Tether
          -0.28%
          Vaulta / Tether
          -1.32%
          AAVE / Tether
          -5.91%

          Spot Ether exchange-traded funds (ETFs) are facing their sharpest pullback yet, with more than $1.04 billion in net outflows recorded across six consecutive trading days, according to data from SoSoValue.

          The sustained withdrawals mark a sharp reversal for Ethereum products, which dominated flows in recent months, and raise questions about whether the trend could indicate a deeper downturn.Ethereum ETFs Drop to $27.39B as Outflows Accelerate

          from Sosovalue, Ether ETFs shed $96.7 million on Monday, led by BlackRock’s flagship ETHA fund, which saw $192.7 million in withdrawals.Source:

          The blow was partly offset by inflows into Fidelity’s FETH ($75 million), Grayscale’s ETHE ($9.5 million), and its lower-fee Mini Trust ($11 million).

          Despite those cushions, total assets under management fell to $27.39 billion, representing 5.28% of Ether’s market capitalization. Daily trading volume across Ethereum ETFs reached $1.52 billion.

          The latest withdrawals extend a week-long streak that began with a $446.7 million single-day outflow on Friday and bottomed at $38.2 million on Wednesday.

          Together, they wiped over $1 billion from Ethereum ETFs in less than two weeks, a dramatic shift from the bullish momentum seen in August.

          In contrast, Bitcoin ETFs continue to attract inflows. spot Bitcoin ETFs recorded $368.2 million in net inflows on September 8, led by Fidelity’s FBTC with $156.5 million, bringing its total inflows to $11.93 billion.Source:

          Ark Invest and 21Shares’ ARKB followed with $89.4 million, lifting ARKB’s historical total to $2.1 billion. Across all issuers, Bitcoin ETFs now hold $145.4 billion in assets, equal to 6.52% of Bitcoin’s market cap, with lifetime cumulative inflows of $54.86 billion.

          The divergence between the two sectors is striking, given Ethereum’s outperformance through much of the summer.

          Ethereum ETFs registered roughly $4 billion in net inflows in August, their second-largest monthly haul since launching in July 2024. That performance outpaced Bitcoin ETFs, which logged $622.5 million in outflows during the same month.

          🇺🇸 US Bitcoin ETFs dominate spot volume with $10B daily trading, capturing 13.1% market share as Ethereum ETFs surge with $4B August inflows. — Cryptonews.com (@cryptonews)

          Over July and August combined, Ethereum products attracted $9.5 billion, compared with $5.4 billion for Bitcoin.

          Ethereum’s summer surge coincided with ETH reclaiming a 13.8% year-to-date lead over Bitcoin by late July, alongside inflows of $7.1 billion since mid-July.

          At their peak, Ethereum products even set a record monthly intake of $5.4 billion in July. Bitcoin, however, retained its lead in cumulative inflows with $54.6 billion since launch, compared with Ethereum’s $13.7 billion.

          The tide turned at the end of August. On August 29, Ethereum ETFs logged $164.6 million in outflows, breaking a five-day streak of inflows that added $1.5 billion.

          The trend worsened in September, with BlackRock’s ETHA bearing the brunt of redemptions, including $151.9 million on September 4. Fidelity’s FETH and Grayscale’s Mini Trust managed smaller inflows of $65.8 million and $62.5 million that day, but the losses outweighed the gains.

          Ethereum ETFs have historically struggled in September. In 2024, they recorded $46.5 million in net outflows for the month, while Bitcoin ETFs drew $1.26 billion.

          Analysts suggest the current slump may be part of that recurring seasonal weakness. Still, cumulative inflows into Ethereum products remain positive at $13.34 billion, nearly all of which is concentrated in BlackRock’s ETHA.

          Ethereum (ETH) entered September trading at $4,302, down from an August peak of $4,953 that was bolstered by corporate treasury allocations totaling $119.6 billion.Ethereum Slides as Traders Weigh Breakout Potential, Revenue Concerns, and Institutional Moves

          Ethereum slipped 1.9% in the past 24 hours to $4,290.81, extending a 3.8% decline over the past two weeks. Despite the pullback, traders see signs of momentum.

          on X that ETH recently broke out of a four-hour descending triangle at $4,356, setting sights on $4,500 and possibly $4,956 if resistance clears. Strong support, he said, remains at $4,200.

          Ethereum is heating up.At $4,356, has broken out of its 4H descending triangle. The spotlight now shifts to $4,500, clearing it could unlock momentum toward $4,956.Strong support remains at $4,200, keeping the bullish setup alive. Momentum is building, and the chart… — Iko | Web3 🇳🇱 🇦🇪 (@IkoWEB3)

          Optimism has also come from Ethereum co-founder Joseph Lubin, who argued that ETH could rally “100x or more” as Wall Street adopts decentralized finance.

          Lubin compared Ethereum’s role to the U.S. dollar’s break from the gold standard in 1971, calling it future infrastructure for institutions such as JPMorgan.

          His view aligns with Fundstrat’s Tom Lee, who sees ETH hitting $5,500 soon and potentially $12,000 by year-end.

          🚀 Tom Lee predicts Ethereum rally to $5,500 soon, $12,000 by year-end as BitMine accumulates $7.65B treasury. — Cryptonews.com (@cryptonews)

          But fundamentals tell a more complex story. Ethereum’s on-chain revenue plunged 44% in August to $14.1 million, despite ETH reaching an all-time high of $4,957.

          Network fees fell 20% to $39.7 million, reflecting the impact of March’s Dencun upgrade, which lowered costs for layer-2 rollups but cut fee income. The drop has revived debate about Ethereum’s long-term economic model.

          Institutional adoption remains a counterweight. Etherealize, a firm backed by Vitalik Buterin, raised $40 million in September to build infrastructure for tokenized assets and expand corporate Ethereum use.

          Meanwhile, stablecoin supply on Ethereum surged to a record $165 billion, growing by $5 billion in a week.

          😱 The crypto market has entered a risk-off phase, with investor sentiment dipping into “Fear” territory over the weekend. — Cryptonews.com (@cryptonews)

          Sentiment across crypto remains cautious. The Fear & Greed Index slipped into “Fear” at 44, with traders rotating from smaller altcoins back into majors like Bitcoin, ETH, and XRP, according to Santiment.

          While CoinMarketCap’s Altcoin Season Index hit 56, analysts warn a broader altcoin rally may not emerge until more ETF products launch later this year.

          Risk Warnings and Disclaimers
          You understand and acknowledge that there is a high degree of risk involved in trading. Following any strategies or investment methods may lead to potential losses. The content on the site is provided by our contributors and analysts for information purposes only. You are solely responsible for determining whether any trading assets, securities, strategy, or any other product is suitable for investing based on your own investment objectives and financial situation.
          Add to Favorites
          Share
          FastBull
          Copyright © 2026 FastBull Ltd

          728 RM B 7/F GEE LOK IND BLDG NO 34 HUNG TO RD KWUN TONG KLN HONG KONG

          TelegramInstagramTwitterfacebooklinkedin
          App Store Google Play Android Windows
          Products
          Charts

          Chats

          Q&A with Experts
          Screeners
          Economic Calendar
          Data
          Tools
          Membership
          Features
          Function
          Markets
          Copy Trading
          Latest Signals
          Contests
          24/7
          Analysis
          Education
          Company
          Careers
          About Us
          Contact Us
          Advertising
          Download FastBull
          Help Center
          Feedback
          User Agreement
          Privacy Policy
          Personal Information Protection Statement
          Business

          White Label

          Broker API

          Data API

          Web Plug-ins

          Poster Maker

          Affiliate Program

          Risk Disclosure

          The risk of loss in trading financial instruments such as stocks, FX, commodities, futures, bonds, ETFs and crypto can be substantial. You may sustain a total loss of the funds that you deposit with your broker. Therefore, you should carefully consider whether such trading is suitable for you in light of your circumstances and financial resources.

          No decision to invest should be made without thoroughly conducting due diligence by yourself or consulting with your financial advisors. Our web content might not suit you since we don't know your financial conditions and investment needs. Our financial information might have latency or contain inaccuracy, so you should be fully responsible for any of your trading and investment decisions. The company will not be responsible for your capital loss.

          Without getting permission from the website, you are not allowed to copy the website's graphics, texts, or trademarks. Intellectual property rights in the content or data incorporated into this website belong to its providers and exchange merchants.

          Not Logged In

          Log in to access more features

          Connect Broker
          Become a signal provider
          Help Center
          Customer Service
          Dark Mode
          Price Up/Down Colors

          Log In

          Sign Up

          Position
          Layout
          Fullscreen
          Default to Chart
          The chart page opens by default when you visit fastbull.com