• Trade
  • Markets
  • Copy
  • Contests
  • 24/7
  • Calendar
  • Q&A
  • Chats
Screeners
SYMBOL
LAST
BID
ASK
HIGH
LOW
NET CHG.
%CHG.
SPREAD
SOURCE
SPX
S&P 500 Index
7316.16
7316.16
7316.16
7450.84
7313.92
-112.61
-1.52%
--
--
DJI
Dow Jones Industrial Average
51594.44
51594.44
51594.44
52674.21
51551.18
-1152.88
-2.19%
--
--
IXIC
NASDAQ Composite Index
24442.95
24442.95
24442.95
25054.53
24425.34
-433.95
-1.74%
--
--
USDX
US Dollar Index
100.860
100.860
100.940
100.880
100.610
+0.240
+ 0.24%
--
--
EURUSD
Euro / US Dollar
1.14382
1.14382
1.14389
1.14746
1.14341
-0.00270
-0.24%
--
--
GBPUSD
Pound Sterling / US Dollar
1.33420
1.33420
1.33427
1.33751
1.33325
-0.00245
-0.18%
--
--
XAUUSD
Gold / US Dollar
4043.04
4043.04
4043.38
4100.26
4028.33
-24.31
-0.60%
--
--
WTI
Light Sweet Crude Oil
84.158
84.158
84.188
84.435
82.122
+0.595
+ 0.71%
--
--

Community Accounts

Signal Accounts
--
Profit Accounts
--
Loss Accounts
--
View More

Become a signal provider

Sell trading signals to earn additional income

View More

Guide to Copy Trading

Get started with ease and confidence

View More

Signal Accounts for Members

All Signal Accounts

Best Return
  • Best Return
  • Best P/L
  • Best MDD
Past 1W
  • Past 1W
  • Past 1M
  • Past 1Y

All Contests

  • All
  • Recommend
  • Stocks
  • Cryptocurrencies
  • Central Banks
  • Trump Updates
  • Featured News
Top News Only
Share

Lan Fo'an Met With Bouya, Deputy Prime Minister Of The Republic Of The Congo

Share

Ministry Of Foreign Affairs: China Has Consistently Pursued A Self-defensive Nuclear Strategy And Does Not Participate In Any Form Of Nuclear Arms Race

Share

The Secretary-General Of The Council Of Europe Stated That Russia's War In Ukraine Is Escalating To An Unprecedented Level. The Same Applies To Wars In The Middle East. All Parties Must Sit Down And Begin Working Towards A Sustainable, Realistic, And Long-term Peace Solution

Share

Deutsche Bank: The Nasdaq Has Entered A Correction Zone; Vague Signals From The Federal Reserve Triggered The Sell-Off

Share

Ministry Of National Defense: Japan's Attempt To "label Reefs As Islands," In Defiance Of The Facts, Is Utterly Untenable

Share

Ministry Of National Defense: The Philippine Side's Illegal Schemes Will Never Succeed

Share

The Egyptian Cabinet Stated That The Authorities Are Continuing Their Investigation And Taking Necessary Measures To Protect Egypt's Interests And National Security

Share

The Egyptian Cabinet Stated That Preliminary Investigations Have Revealed That The Fires On Two Ships In The Port Of Damieta Were Caused By Drones

Share

Ministry Of National Defense: A Chinese Naval Fleet Will Visit Indonesia

Share

Following The Federal Reserve Meeting, Eurozone Bond Yields Rose In Tandem With U.S. Treasury Yields

Share

Ministry Of Commerce: China And The EU Have Preliminarily Agreed To Hold The Second Meeting Of Their Consultation Mechanism This Autumn

Share

National Bureau Of Statistics: In 2025, The Value Added Of China's "three New" Economy Will Account For 18.39% Of The Country's GDP

Share

Spain's Preliminary July Month-on-month CPI Came In At 0.2%, In Line With Expectations Of 0.2% And Down From The Previous Reading Of 0.60%

Share

Spain's Preliminary July YoY CPI Came In At 3.5%, Versus An Expected 3.4% And A Previous Reading Of 3.20%

Share

Spain's Preliminary Q2 GDP Growth Came In At 0.7% Quarter-over-quarter, Above The Expected 0.6% And Previous Reading Of 0.60%

Share

Spain's Preliminary Year-on-Year GDP Growth For Q2 Came In At 2.7%, Above The Expected 2.5% And Unchanged From The Previous Reading Of 2.70%

Share

Switzerland's KOF Leading Economic Indicator For July Stood At 103.5, Above The Forecast Of 101.0 And Up From The Previously Reported 101.2, Which Was Revised To 102.1

Share

Traders Said The Reserve Bank Of India (RBI) Might Sell Dollars To Limit The Rupee's Depreciation Due To Rising Oil Prices. The Indian Rupee Fell 0.1% Against The Dollar To 95.73 Rupees Per Dollar, After Rising To 95.5775 Earlier

Share

LSEG Data Shows That The Yield On German 30-year Government Bonds Rose To A Two-month High Of 3.687%

Share

Meeting Of The Political Bureau Of The CPC Central Committee: Accelerate The Transition From Old To New Growth Drivers And Effectively Implement A More Proactive Fiscal Policy And A Moderately Accommodative Monetary Policy

TIME
ACT
FCST
PREV
IMPACT
Australia RBA Trimmed Mean CPI YoY (Q2)

A:--

F: --

P: --

AUDUSD
  • AUDUSD
  • XAUUSD
  • XAGUSD
  • WTI
Australia CPI YoY (Q2)

A:--

F: --

P: --

AUDUSD
  • AUDUSD
  • XAUUSD
  • XAGUSD
  • WTI
Australia Weighted CPI YoY (Jun)

A:--

F: --

P: --

U.K. M4 Money Supply YoY (Jun)

A:--

F: --

P: --

GBPUSD
  • GBPUSD
  • XAUUSD
  • XAGUSD
  • WTI
  • USDX
U.K. Mortgage Approvals (Jun)

A:--

F: --

P: --
GBPUSD
  • GBPUSD
  • XAUUSD
  • XAGUSD
  • WTI
  • USDX
U.K. M4 Money Supply MoM (Jun)

A:--

F: --

P: --

GBPUSD
  • GBPUSD
  • XAUUSD
  • XAGUSD
  • WTI
  • USDX
U.K. Mortgage Lending (Jun)

A:--

F: --

P: --
GBPUSD
  • GBPUSD
  • XAUUSD
  • XAGUSD
  • WTI
  • USDX
Italy Average Hourly Wage MoM (Jun)

A:--

F: --

P: --

EURUSD
  • EURUSD
  • XAUUSD
  • XAGUSD
  • WTI
  • USDX
Germany 10-Year Bund Auction Avg. Yield

A:--

F: --

P: --

EURUSD
  • EURUSD
  • XAUUSD
  • XAGUSD
  • WTI
  • USDX
U.S. MBA Mortgage Application Activity Index WoW

A:--

F: --

P: --

USDX
  • USDX
  • XAUUSD
  • XAGUSD
  • WTI
U.S. EIA Weekly Heating Oil Stock Changes

A:--

F: --

P: --

WTI
  • WTI
  • XAUUSD
  • XAGUSD
  • USDX
U.S. EIA Weekly Crude Oil Imports Changes

A:--

F: --

P: --

WTI
  • WTI
  • XAUUSD
  • XAGUSD
  • USDX
U.S. EIA Weekly Crude Stocks Change

A:--

F: --

P: --

WTI
  • WTI
  • XAUUSD
  • XAGUSD
  • USDX
U.S. EIA Weekly Cushing, Oklahoma Crude Oil Stocks Change

A:--

F: --

P: --

WTI
  • WTI
  • XAUUSD
  • XAGUSD
  • USDX
U.S. EIA Weekly Crude Demand Projected by Production

A:--

F: --

P: --

WTI
  • WTI
  • XAUUSD
  • XAGUSD
  • USDX
U.S. EIA Weekly Gasoline Stocks Change

A:--

F: --

P: --

WTI
  • WTI
  • XAUUSD
  • XAGUSD
  • USDX
Russia Retail Sales YoY (Jun)

A:--

F: --

P: --

WTI
  • WTI
  • XAUUSD
  • XAGUSD
  • USDX
Russia Unemployment Rate (Jun)

A:--

F: --

P: --

WTI
  • WTI
  • XAUUSD
  • XAGUSD
  • USDX
Brazil CAGED Net Payroll Jobs (Jun)

A:--

F: --

P: --

XAUUSD
  • XAUUSD
  • XAGUSD
  • WTI
  • USDX
U.S. Target Federal Funds Rate Lower Limit (Overnight Reverse Repo Rate)

A:--

F: --

P: --

XAUUSD
  • XAUUSD
  • XAGUSD
  • WTI
  • USDX
U.S. Target Federal Funds Rate Upper Limit (Excess Reserves Ratio)

A:--

F: --

P: --

XAUUSD
  • XAUUSD
  • XAGUSD
  • WTI
  • USDX
FOMC Statement
FOMC Press Conference
Australia Building Permits MoM (SA) (Jun)

A:--

F: --

P: --
AUDUSD
  • AUDUSD
  • XAUUSD
  • XAGUSD
  • WTI
  • USDX
Australia Import Price Index YoY (Q2)

A:--

F: --

P: --

Australia Building Permits YoY (SA) (Jun)

A:--

F: --

P: --

AUDUSD
  • AUDUSD
  • XAUUSD
  • XAGUSD
  • WTI
  • USDX
Australia Private Building Permits MoM (SA) (Jun)

A:--

F: --

P: --

AUDUSD
  • AUDUSD
  • XAUUSD
  • XAGUSD
  • WTI
  • USDX
Japan Household Consumer Confidence Index (Jul)

A:--

F: --

P: --

USDJPY
  • USDJPY
  • XAUUSD
  • XAGUSD
  • WTI
  • USDX
France GDP Prelim YoY (SA) (Q2)

A:--

F: --

P: --

Turkey Economic Sentiment Indicator (Jul)

A:--

F: --

P: --

XAUUSD
  • XAUUSD
  • XAGUSD
  • WTI
  • USDX
Germany GDP Prelim YoY (Working-day Adjusted) (Q2)

--

F: --

P: --

Italy GDP Prelim YoY (SA) (Q2)

--

F: --

P: --

Germany GDP Prelim YoY (Not SA) (Q2)

--

F: --

P: --

Germany GDP Prelim QoQ (SA) (Q2)

--

F: --

P: --

Euro Zone GDP Prelim QoQ (SA) (Q2)

--

F: --

P: --
Euro Zone Consumer Confidence Index Final (Jul)

--

F: --

P: --

Euro Zone Services Sentiment Index (Jul)

--

F: --

P: --

Euro Zone GDP Prelim YoY (SA) (Q2)

--

F: --

P: --

Euro Zone Economic Sentiment Indicator (Jul)

--

F: --

P: --

Italy Quarterly Unemployment Rate (SA) (Jun)

--

F: --

P: --

Euro Zone Industrial Climate Index (Jul)

--

F: --

P: --

Euro Zone Unemployment Rate (Jun)

--

F: --

P: --

Italy Unemployment Rate (SA) (Jun)

--

F: --

P: --

Euro Zone Selling Price Expectations (Jul)

--

F: --

P: --

Euro Zone Consumer Inflation Expectations (Jul)

--

F: --

P: --

Italy 10-Year BTP Bond Auction Avg. Yield

--

F: --

P: --

Italy 5-Year BTP Bond Auction Avg. Yield

--

F: --

P: --

South Africa PPI YoY (Jun)

--

F: --

P: --

Italy PPI YoY (Jun)

--

F: --

P: --

U.K. BOE MPC Vote Cut

--

F: --

P: --

U.K. BOE MPC Vote Hike

--

F: --

P: --

U.K. BOE MPC Vote Unchanged

--

F: --

P: --

U.K. Benchmark Interest Rate

--

F: --

P: --

MPC Rate Statement
Bank of England Governor Bailey held a press conference on monetary policy.
Germany GDP Final QoQ (SA) (Jul)

--

F: --

P: --

Germany HICP Prelim MoM (Jul)

--

F: --

P: --

Germany CPI Final MoM (Jul)

--

F: --

P: --

Germany HICP Prelim YoY (Jul)

--

F: --

P: --

Brazil Unemployment Rate (Jun)

--

F: --

P: --

U.S. Core PCE Price Index YoY (Jun)

--

F: --

P: --

Q&A with Experts
    • All
    • Chatrooms
    • Groups
    • Friends
    Henry flag
    Henry flag
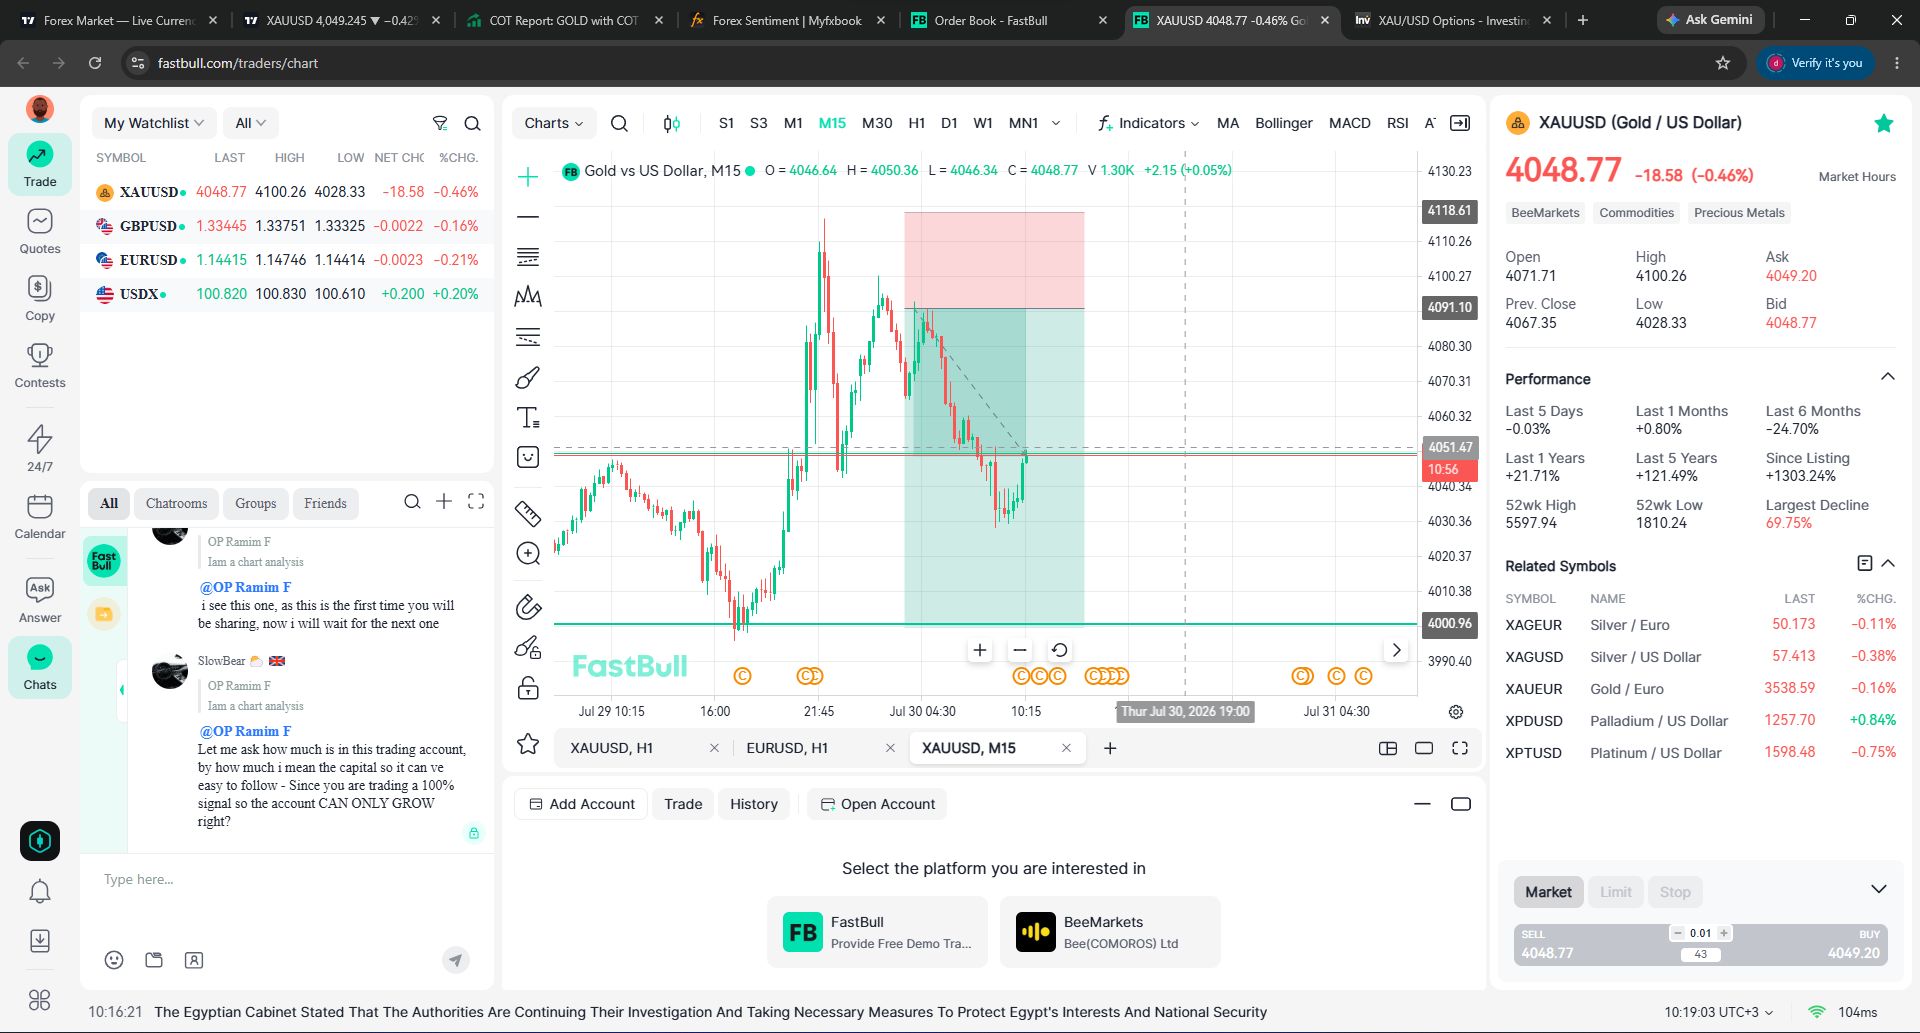
    targetting that low
    EuroTrader flag
    Henry
    my gold trade
    @HenryHows your Gold trade going. This is real good short position you built there
    SlowBear ⛅ flag
    Henry
    @Henryoh i see this one now, thansk for sharing bro, lovely showyt bro, you took it earlier today right?
    SlowBear ⛅ flag
    Henry
    targetting that low
    @Henry The target is around the 4000 level yes?
    Henry flag
    yes
    SlowBear ⛅ flag
    Henry
    yes
    @Henry NOt bad at all bro are you trailing your stop or you are not?
    OP Ramim F flag
    SlowBear ⛅
    @OP Ramim FLet me ask how much is in this trading account, by how much i mean the capital so it can ve easy to follow - Since you are trading a 100% signal so the account CAN ONLY GROW right?
    @SlowBear ⛅Brother, I have shared the chart, the rest depends on you.
    SlowBear ⛅ flag
    OP Ramim F
    @SlowBear ⛅Brother, I have shared the chart, the rest depends on you.
    @OP Ramim F I have seen it and i will be watching out now brother do not worry i see the account balance i sitting on 42k so all the best brother, i am rooting for you
    Size flag
    OP Ramim F
    @SlowBear ⛅Brother, I have shared the chart, the rest depends on you.
    @OP Ramim FCould you re-share the chart? I think I missed it earlier..
    EuroTrader flag
    OP Ramim F
    @SlowBear ⛅Brother, I have shared the chart, the rest depends on you.
    @OP Ramim Fcan you resend the charts. I didn't get to see the charts 😭. i need some good outlook
    HMD-XAU ! flag
    HMD-XAU ! flag
    xXx_VINBENZIN flag
    HMD-XAU !
    @HMD-XAU !Это как?
    Size flag
    HMD-XAU !
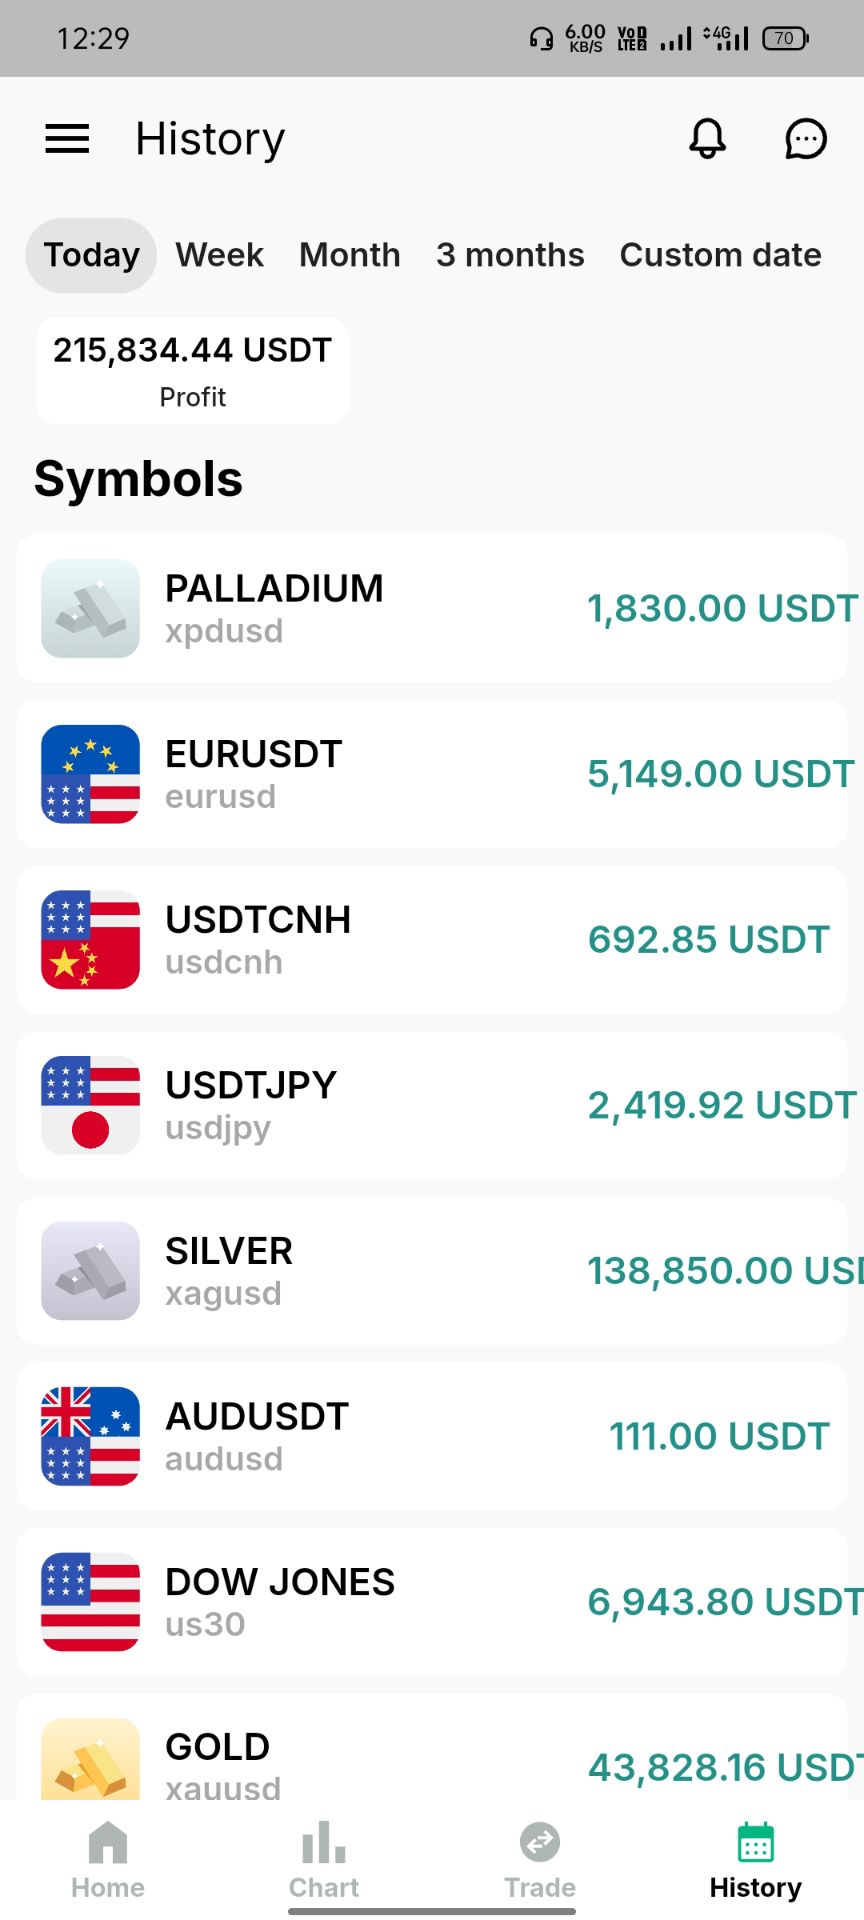
    @HMD-XAU !Hey mate, what's this? Are those your profits history?
    HMD-XAU ! flag
    GOLD TRADER
    @HMD-XAU !but I love you sir
    @GOLD TRADERBrother, I'm glad to hear that you love me. Thank you.😍🥰
    EuroTrader flag
    HMD-XAU !
    @GOLD TRADERBrother, I'm glad to hear that you love me. Thank you.😍🥰
    @HMD-XAU !I love your trading also. You have the be all end all of the marksts at your feet
    Size flag
    Size flag
    Size
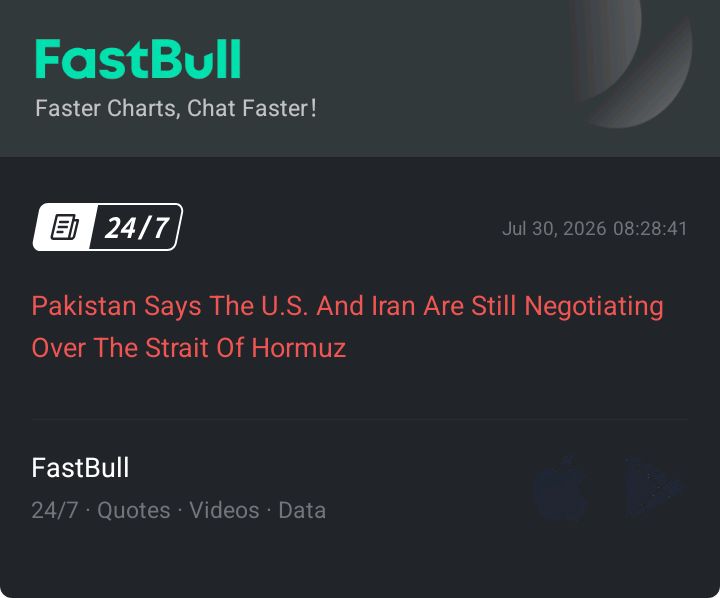
    Interesting development. Oil traders will be watching this closely, while gold and safe-haven currencies could react depending on how the talks evolve.
    EuroTrader flag
    Type here...
    Add Symbol or Code

      No matching data

      All
      Recommend
      Stocks
      Cryptocurrencies
      Central Banks
      Trump Updates
      Featured News
      • All
      • Russia-Ukraine Conflict
      • Middle East Flashpoint
      • All
      • Russia-Ukraine Conflict
      • Middle East Flashpoint
      Search
      Products

      Charts Free Forever

      Chats Q&A with Experts
      Screeners Economic Calendar Data Tools
      Membership Features
      Data Warehouse Market Trends Institutional Data Policy Rates Macro

      Market Trends

      Market Sentiment Order Book Forex Correlations

      Top Indicators

      Charts Free Forever
      Markets

      News

      24/7 Analysis Education

      Latest Views

      Latest Update

      Signals

      Copy Rankings Latest Signals Become a signal provider AI Rating
      Contests
      Brokers

      Overview Brokers Assessment Rankings Regulators News Claims
      Broker listing Forex Brokers Comparison Tool Live Spread Comparison Scam
      Q&A Complaint Scam Alert Videos Tips to Detect Scam
      More

      Business
      Events
      Careers About Us Advertising Help Center

      White Label

      Broker API

      Data API

      Web Plug-ins

      Affiliate Program

      Awards Institution Evaluation IB Seminar Salon Event Exhibition
      Vietnam Thailand Singapore Dubai
      Fans Party Investment Sharing Session
      FastBull Summit BrokersView Expo
      Recent Searches
        Top Searches
          Markets
          Analysis
          User
          24/7
          Economic Calendar
          Education
          Data
          • Names
          • Latest
          • Prev

          View All

          No data

          Scan to Download

          Faster Charts, Chat Faster!

          Download
          English
          • English
          • Español
          • العربية
          • Bahasa Indonesia
          • Bahasa Melayu
          • Tiếng Việt
          • ภาษาไทย
          • Français
          • Italiano
          • Türkçe
          • Русский язык
          • 简中
          • 繁中
          Open Account
          Search
          Products
          Charts Free Forever
          Markets
          News
          Signals

          Copy Rankings Latest Signals Become a signal provider AI Rating
          Contests
          Brokers

          Overview Brokers Assessment Rankings Regulators News Claims
          Broker listing Forex Brokers Comparison Tool Live Spread Comparison Scam
          Q&A Complaint Scam Alert Videos Tips to Detect Scam
          More

          Business
          Events
          Careers About Us Advertising Help Center

          White Label

          Broker API

          Data API

          Web Plug-ins

          Affiliate Program

          Awards Institution Evaluation IB Seminar Salon Event Exhibition
          Vietnam Thailand Singapore Dubai
          Fans Party Investment Sharing Session
          FastBull Summit BrokersView Expo

          5 Best Trending Market Indicators to Confirm Strong Moves

          FastBull
          Summary:

          Amid market noise, how do elite traders verify real momentum? Discover how trending market indicators mathematically isolate the true trajectory of capital.

          Navigating financial markets requires more than just guessing where prices will go next; it requires mathematical proof that a directional move has the momentum to last. Trending market indicators provide this exact validation, stripping away daily volatility to reveal the true trajectory of capital flows. By filtering out market noise, these tools protect traders from false breakouts and low-probability reversals. This guide breaks down the most reliable indicators for confirming directional strength, demonstrating how to pair them effectively and how to recognize when market conditions render them ineffective.

          5 Best Trending Market Indicators to Confirm Strong Moves

          What Makes a Market Indicator Good at Confirming Trending Moves?

          Effective trending market indicators strip away short-term price volatility to measure the underlying direction and velocity of capital flows. They do not attempt to guess market tops or bottoms; instead, they mathematically validate that a directional bias has enough momentum to sustain a prolonged move.

          Why Confirmation Matters More Than Prediction in Trending Markets

          Attempting to predict exact market reversals yields low win rates and exposes capital to severe drawdowns. Trend-following indicators operate on the proven mechanical premise that capturing the middle 60% of a price move is structurally more profitable than catching the exact absolute high or low.

          When a market establishes a strong directional bias, predictive tools—such as oscillators looking for overbought or oversold conditions—frequently generate false signals because prices can remain at extremes for weeks or months. Relying on confirmation shifts the trading objective from forecasting to verification. Traders looking for the best indicator for entry and exit in these environments rely on tools that require price action to prove its trajectory before signaling a position.

          This creates a deliberate, necessary trade-off between entry speed and signal accuracy:

          • Predictive Approach (Low Probability, High Reward): Attempts to buy support and sell resistance before a move happens. This approach routinely fails during structural market shifts, trapping traders on the wrong side of a breakout.
          • Confirmation Approach (High Probability, Moderate Reward): Sacrifices the first 10-15% of a breakout to establish directional certainty. This delay acts as a filter against bull and bear traps, keeping traders out of the market until momentum is statistically verified.

          What Separates Trend-Confirming Indicators From Noise

          A robust trend indicator mathematically differentiates between directional momentum and mean-reverting chop. Traders frequently struggle to identify choppy vs trending markets because they rely on indicators overly sensitive to single-session anomalies or low-volume price spikes.

          High-quality trend indicators neutralize this noise through volatility adjustments and multi-period data smoothing. For example, the Average Directional Index (ADX) ignores the direction of the price entirely, calculating only the absolute strength of the movement. An ADX reading sustained above 25 confirms a trending market condition, while a reading below 20 strictly defines a sideways, noise-filled market. Similarly, the Aroon indicator filters out price-level noise by measuring the time elapsed since a 25-period high or low. By focusing on time rather than raw price increments, it isolates the persistence of buying or selling pressure.

          To distinguish genuine trend confirmation from market noise, evaluate indicators across three mechanical attributes:

          CharacteristicNoise-Prone IndicatorsTrend-Confirming Indicators
          Data WeightingReacts aggressively to the most recent 1-2 closing prices.Applies moving averages or exponential smoothing across 14+ periods.
          Volatility HandlingGenerates signals based purely on absolute price changes.Adjusts bands or thresholds based on True Range (ATR) to account for market expansion.
          Primary OutputIdentifies "overbought/oversold" levels that frequently fail during breakouts.Measures slope, moving average separation, or time-since-extremes to validate trend velocity.

          Indicators that fail to adjust for volatility or rely exclusively on static look-back periods without smoothing will invariably mistake a volatile trading range for a new trend. Confirmation requires a tool designed specifically to ignore the noise of the range.

          The 5 Best Trending Market Indicators Ranked by Reliability

          The most reliable trending market indicators isolate directional momentum and filter out false breakouts in choppy conditions. If you are wondering exactly what are market indicators in a trend-following context, they are strictly mathematical calculations—based on historical price and volume—designed to separate true signal from market noise.

          Instead of cluttering a chart with the top 20 trading indicators, a disciplined system requires only five distinct tools. The following indicators rank highest for reliability because they each measure a completely different dimension of a trending market condition: direction, strength, momentum, support, and institutional volume.

          IndicatorPrimary FunctionStandard TradingView SettingsPrimary Trade-Off
          Moving AveragesEstablishes baseline direction20, 50, 200 periodsHigh lag; generates false signals in ranging markets
          ADXQuantifies trend velocity14 periodsDoes not indicate trend direction, only strength
          MACDTimes entries and momentum shifts12, 26, 9 periodsProne to whipsaws if used without a macro trend filter
          Ichimoku CloudProjects dynamic support/resistance9, 26, 52, 26 periodsVisually dense; requires ignoring minor internal crossovers
          On-Balance VolumeValidates price moves via volumeCumulative (N/A)Can be skewed by single-day massive volume anomalies

          Moving Averages: The Baseline for Spotting Trend Direction

          Moving averages (MAs) establish the primary market bias by smoothing historical price data over specific periods. Price action sustaining above a rising MA defines an uptrend, while price trading below a falling MA confirms a downtrend.

          Exponential Moving Averages (EMAs) assign greater mathematical weight to recent prices, making them faster to react to immediate shifts than Simple Moving Averages (SMAs). As some of the best technical indicators for swing trading, the 20-period and 50-period EMAs are heavily utilized to ride short-term trends. Conversely, institutional capital relies on the 200-period SMA to dictate the macro trend.

          A structural bullish shift is often validated by a "Golden Cross," which occurs when the 50-day SMA crosses above the 200-day SMA. The inherent trade-off of any moving average is lag. MAs do not predict market reversals; they only mathematically confirm a reversal after the price has already moved.

          ADX: How to Measure Trend Strength Before You Commit

          The Average Directional Index (ADX) quantifies the exact velocity of a trend regardless of whether the price is moving up or down. Developed by J. Welles Wilder, the ADX plots as a single absolute line operating on a strict 0 to 100 scale. While tools like the Aroon indicator measure the time elapsed since a high or low, ADX directly measures the expansion of the price range.

          Traders use ADX thresholds to filter out low-probability environments before deploying capital:

          • ADX < 20: The market is chopping sideways. Trend-following indicators will fail here, and mean-reversion strategies are required.
          • ADX 25–50: A strong, tradable trend is active. Breakouts have a high probability of continuation.
          • ADX > 50: The trend is exceptionally strong but mathematically overextended, increasing the risk of a sharp pullback.

          To determine direction alongside strength, analysts pair the main ADX line with the +DI and -DI directional lines. A valid long entry requires the +DI to be positioned above the -DI, with the ADX line simultaneously crossing up through the 25 threshold.

          MACD: Catching Momentum Shifts Within an Existing Trend

          The Moving Average Convergence Divergence (MACD) oscillator measures the expanding or contracting distance between two moving averages—typically the 12-period and 26-period EMAs—to signal accelerating or decelerating momentum. When the 12-EMA pulls away from the 26-EMA, the MACD histogram expands, proving that the trend velocity is increasing.

          The indicator utilizes a 9-period EMA signal line as a trigger mechanism. A MACD line crossing above this signal line from beneath the zero bound provides an early quantitative signal of a new upward thrust.

          Because it excels at highlighting momentum exhaustion through divergence (e.g., when the price makes a higher high, but the MACD histogram prints a lower high), many analysts consider it the best indicator for entry and exit timing within broader macro trends. However, trading every MACD crossover blindly guarantees steep drawdowns; the indicator must be filtered by a longer-term directional tool like the 200-day SMA.

          Ichimoku Cloud: Reading Support, Resistance, and Trend in One View

          The Ichimoku Kinko Hyo system projects dynamic support and resistance zones 26 periods ahead of the current price, solving the severe lag problem inherent in standard moving averages. The core of this system is the Kumo (Cloud), a shaded zone formed by the space between two boundaries: Senkou Span A and Senkou Span B.

          Operating as one of the most comprehensive TradingView market indicators, Ichimoku dictates clear binary rules for trend identification:

          • Uptrend Validation: The current price trades above the Cloud, and the forward-projected Cloud is green (Span A > Span B). The Cloud acts as dynamic support on pullbacks.
          • Downtrend Validation: The current price trades below the Cloud, and the forward-projected Cloud is red (Span B > Span A). The Cloud acts as dynamic resistance on rallies.
          • No-Trade Zone: The price trades inside the Cloud. This signifies extreme chop, and trend continuation setups should be entirely avoided.

          On-Balance Volume: Does the Volume Back Up the Price Move?

          On-Balance Volume (OBV) operates on the proven market premise that volume precedes price. It maintains a running cumulative total of trading volume—adding the day's volume to the total on up days and subtracting it on down days.

          A breakout in price without a corresponding breakout in the OBV line signals a lack of institutional participation, exposing retail traders to a high probability of a false move. Conversely, if OBV begins stair-stepping aggressively higher while the price remains flat in consolidation, it signals hidden accumulation and forecasts an upward breakout.

          Because directional options require sustained underlying momentum to offset theta decay, options traders heavily rely on volume confirmation. Directional buyers seeking the best indicator for option trading setups often use OBV on the underlying equity to verify institutional sponsorship before paying premiums for out-of-the-money calls. If the OBV diverges negatively from the price action, the trend is hollow and likely to fail.

          How to Use These Trending Market Indicators Together Without Getting Conflicting Signals

          Combining trending market indicators successfully requires pairing tools that measure different dimensions of price action—such as direction, momentum, and volume—rather than stacking derivatives of the same data. Traders who layer multiple tools mathematically derived from closing prices suffer from indicator collinearity, a structural error where overlapping signals create false confidence or lag so severely that the entry window closes before execution.

          Which Indicators Work Best as a Pair?

          The most effective pairings match a directional trend-following indicator with a secondary tool that measures trend strength, volatility, or capital flow. This orthogonal approach filters out weak, choppy market conditions that generate false signals, ensuring you only allocate capital when the structural trend and momentum align.

          Indicator PairPrimary FunctionSecondary FunctionExecution Logic
          MACD + ADXTrend Direction (MACD)Trend Strength (ADX)MACD signals the directional shift; ADX reading above 25 confirms the move has enough velocity to sustain a trend, filtering out whipsaws.
          EMA Crossover + RSIBaseline Trend (EMA)Pullback Timing (RSI)A 9/21 EMA cross establishes the macro direction. An RSI dropping to the 40-50 range in a bull trend serves as the best indicator for entry and exit during swing setups.
          Aroon Indicator + OBVTrend Phase (Aroon)Capital Flow (OBV)The Aroon Up crossing 70 flags a recent high; rising On-Balance Volume (OBV) confirms the breakout is backed by heavy institutional accumulation, not low-liquidity spikes.

          When testing these combinations on platforms like TradingView, keep the lookback periods proportional. Pairing a hyper-sensitive 5-period momentum oscillator with a lagging 200-period moving average creates a mismatch where the oscillator issues dozens of conflicting signals before the baseline trend shifts once.

          How to Avoid Redundancy When Stacking Trend Tools

          Redundancy occurs when you stack multiple indicators that process the exact same raw price data using nearly identical mathematical formulas. Plotting the MACD, Stochastic Oscillator, and RSI on a single chart does not provide three independent confirmations; it provides the same momentum calculation expressed three slightly different ways.

          To prune a bloated chart setup and clarify decision-making, enforce these constraints:

          • Audit for mathematical overlap: If two tools are momentum oscillators (like RSI and CCI) or smoothing averages (like SMA and EMA), drop one immediately. A clean setup utilizes a maximum of one trend-following indicator per asset per timeframe.
          • Introduce orthogonal data: Price-derived tools will always correlate. To secure genuinely independent confirmation of a trending market condition, introduce tools that calculate volume (OBV, VWAP) or volatility (ATR, Bollinger Bands).
          • Filter for your specific hold time: The best technical indicators for swing trading differ mathematically from day-trading tools. A multi-day hold requires structural confirmation, making a 50-day SMA more relevant than a 14-period RSI.
          • Enforce a strict execution hierarchy: Define which indicator dictates the macro bias and which dictates the trigger. If a 200-period SMA dictates an upward trend, lower-timeframe oscillators are strictly restricted to triggering long entries. Short signals are ignored entirely.

          When Do These Indicators Fail to Confirm a Strong Move?

          Trending market indicators fail when they are applied to non-trending environments or subjected to sudden fundamental shocks. Because these tools—such as Moving Averages, the MACD, and the Aroon indicator—are mathematically derived from historical price data, they inherently lag real-time price action. In the wrong regime, this lag transforms from a confirmation tool into a mechanism for generating false signals.

          The most common point of failure is a choppy, range-bound market. Trend-following algorithms assume that a breakout from an average price will continue in that direction. When price action is confined between horizontal support and resistance, moving average crossovers will routinely trigger buy signals exactly at the top of the range and sell signals at the bottom. Traders refer to this rapid succession of false confirmations as whipsawing.

          To prevent deploying the best technical indicators for swing trading in the wrong environment, analysts look for specific failure conditions:

          • Low Directional Strength (ADX < 25): Because the Average Directional Index measures trend strength regardless of direction, a print below 25 mathematically confirms a trendless market. In this state, moving averages flatten and overlap, rendering their crossover signals mathematically useless.
          • Macroeconomic Data Gaps: Sudden catalysts—such as unexpected CPI prints, central bank rate decisions, or earnings surprises—cause immediate price recalibration. Because trending market indicators smooth out past closing prices, a massive overnight gap will heavily skew the moving averages, generating a delayed "trend confirmation" long after the actual institutional money has repositioned.
          • Aroon Oscillation: The Aroon indicator measures the time between consecutive highs and lows. When both Aroon Up and Aroon Down lines move in parallel or frequently cross near the 50-level, the asset is consolidating. Trusting a breakout signal from a secondary indicator while Aroon shows consolidation frequently results in a trapped entry.

          You can categorize indicator failure states by analyzing the structural mismatch between the market environment and the tool being used.

          Market EnvironmentTechnical SignatureMechanism of Failure
          Sideways ConsolidationFlat moving averages; ADX < 25.Indicator signals a new trend at the exact moment price hits a mean-reverting boundary.
          High-Volatility ShocksPrice gaps outside standard Bollinger Band deviations.Mathematical lag causes the indicator to fire an entry signal only after the move is entirely exhausted.
          Trend ExhaustionPrice makes a higher high, but MACD histogram prints a lower high (Divergence).The primary trend indicator continues to print bullish alignment even as underlying buying volume collapses.

          When a trending market condition deteriorates into chop, directional indicators lose their predictive utility. Professional traders do not adjust the settings on their trend tools to fix this; they abandon them temporarily in favor of momentum oscillators like the RSI or Stochastic, which are specifically designed to measure overbought and oversold conditions within a confined price channel.

          FAQs about trending market indicators

          Which indicator is best for trending market?

          Moving averages, such as the Simple Moving Average (SMA) and Exponential Moving Average (EMA), are widely considered some of the best indicators for trending markets. Trend-following tools like the Moving Average Convergence Divergence (MACD) and Parabolic SAR are also highly effective. These indicators help traders smooth out short-term price fluctuations to better visualize the overarching market direction.

          How do you identify a trending market?

          A trending market is primarily identified through price action by looking for a clear sequence of higher highs and higher lows in an uptrend, or lower highs and lower lows in a downtrend. Traders also commonly use technical analysis tools to confirm this movement. For example, a reading above 25 on the Average Directional Index (ADX) indicator signals that a market is actively trending rather than ranging sideways.

          What is the best indicator for trend strength?

          The Average Directional Index (ADX) is widely regarded as the most standard and reliable indicator for measuring trend strength. It calculates a value between 0 and 100 to gauge momentum, regardless of whether the price is moving up or down. Generally, an ADX reading above 25 indicates a strong trend, while a reading below 25 suggests a weak or consolidating market.

          What is the most accurate trend indicator?

          There is no single "most accurate" trend indicator, as an indicator's effectiveness heavily depends on the traded asset, the chosen timeframe, and broader market behavior. Accuracy is generally improved by combining multiple technical tools to validate signals rather than relying on just one. Traders often pair direction-based indicators like Moving Averages or Supertrend with momentum oscillators to filter out false signals and confirm trends.

          Conclusion

          Mastering trending market indicators transforms trading from a game of predictive guesswork into a systematic process of mathematical verification. By isolating momentum, strength, and institutional volume, tools like Moving Averages, ADX, and OBV allow traders to confidently capture the most profitable portion of a prolonged price move. Stacking these indicators intelligently—without creating redundant signals—filters out the deceptive noise of sideways markets. Protecting capital requires knowing exactly when to trust a confirmed trend and when to step aside as technical conditions deteriorate.

          Risk Warnings and Disclaimers
          You understand and acknowledge that there is a high degree of risk involved in trading. Following any strategies or investment methods may lead to potential losses. The content on the site is provided by our contributors and analysts for information purposes only. You are solely responsible for determining whether any trading assets, securities, strategy, or any other product is suitable for investing based on your own investment objectives and financial situation.
          Add to Favorites
          Share
          FastBull
          Copyright © 2026 FastBull Ltd

          728 RM B 7/F GEE LOK IND BLDG NO 34 HUNG TO RD KWUN TONG KLN HONG KONG

          TelegramInstagramTwitterfacebooklinkedin
          App Store Google Play Android Windows
          Products
          Charts

          Chats

          Q&A with Experts
          Screeners
          Economic Calendar
          Data
          Tools
          Membership
          Features
          Function
          Markets
          Copy Trading
          Latest Signals
          Contests
          24/7
          Analysis
          Education
          Company
          Careers
          About Us
          Contact Us
          Advertising
          Download FastBull
          Help Center
          Feedback
          User Agreement
          Privacy Policy
          Personal Information Protection Statement
          Business

          White Label

          Broker API

          Data API

          Web Plug-ins

          Poster Maker

          Affiliate Program

          Risk Disclosure

          The risk of loss in trading financial instruments such as stocks, FX, commodities, futures, bonds, ETFs and crypto can be substantial. You may sustain a total loss of the funds that you deposit with your broker. Therefore, you should carefully consider whether such trading is suitable for you in light of your circumstances and financial resources.

          No decision to invest should be made without thoroughly conducting due diligence by yourself or consulting with your financial advisors. Our web content might not suit you since we don't know your financial conditions and investment needs. Our financial information might have latency or contain inaccuracy, so you should be fully responsible for any of your trading and investment decisions. The company will not be responsible for your capital loss.

          Without getting permission from the website, you are not allowed to copy the website's graphics, texts, or trademarks. Intellectual property rights in the content or data incorporated into this website belong to its providers and exchange merchants.

          Not Logged In

          Log in to access more features

          Connect Broker
          Become a signal provider
          Help Center
          Customer Service
          Dark Mode
          Price Up/Down Colors

          Log In

          Sign Up

          Position
          Layout
          Fullscreen
          Default to Chart
          The chart page opens by default when you visit fastbull.com