- AUDUSD
- XAUUSD
- XAGUSD
- WTI


Markets
Analysis
User
24/7
Economic Calendar
Education
Data
- Names
- Latest
- Prev
















What is the real 3 gram gold price? Beneath the global spot market lies a complex web of retail markups, karat purities, and central bank demand.
Navigating the physical precious metals market requires a clear understanding of how global spot rates translate into actionable, real-world valuations. For buyers and sellers dealing in small fractional weights, determining the 3 gram gold price today means calculating exact purity levels and factoring in distinct retail premiums. This guide breaks down the live market value of 3-gram items across all standard karat tiers, from 14K jewelry to 24K investment bars. By examining current macroeconomic drivers and standard dealer markups, you can accurately price your next acquisition or liquidation.

At current mid-2026 market rates (approximately $4,087 per troy ounce), the baseline melt value for 3 grams of pure 24-karat gold is exactly $394.29. However, physical transaction prices will differ based on the direction of your trade. Retail buyers purchasing a 3 gram gold coin or fractional bar should expect to pay between $430 and $470 once dealer premiums—which typically run 10% to 20% on small fractional weights—are applied. Conversely, if you are selling 3 grams of gold jewelry or scrap, refiners and dealers generally offer 85% to 90% of the active spot price.
The actual financial value of a 3 gram gold piece is dictated entirely by its karatage, which measures the precise ratio of pure gold to alloy metals. The table below calculates the exact melt value of 3 grams across standard retail purities, anchored to a $131.43 per gram spot price.
| Karat | Pure Gold % | 3g Melt Value (Spot) | Typical Retail Application |
|---|---|---|---|
| 24K | 99.9% | $394.29 | Investment bars and standard bullion coins |
| 22K | 91.67% | $361.44 | High-purity Asian and Middle Eastern jewelry |
| 18K | 75.0% | $295.72 | Premium engagement rings and luxury watches |
| 14K | 58.3% | $229.87 | Durable, everyday-wear chains and bands |
Note: Melt value strictly represents the raw metal worth. It excludes manufacturing costs for a 3 gram gold ring, gem settings, or the numismatic value of minted coins.
Calculating the exact value of 3 grams of gold requires converting standard commodity pricing into fractional gram metrics. Global markets price gold in troy ounces, meaning quoted market figures must be parsed down to value small items like a 3 gram 14k gold chain or determine a 1 gram gold bar value.
The valuation process follows this exact four-step sequence:
Fractional gold carries a distinct mathematical trade-off for investors. While a 3 gram gold price is highly accessible for retail buyers upfront, the fixed fabrication and distribution costs for a 3 gram piece are nearly identical to those of a 1-ounce bar. This dynamic results in a substantially higher premium per gram for small weights compared to larger bullion formats.
The 3 gram gold price differs across karat tiers because the market strictly prices the percentage of pure precious metal in an item, ignoring the weight of cheaper alloy metals mixed in. Buyers and sellers pay only for the refined yield, meaning a 3-gram piece of 14K jewelry contains significantly less actual gold than a 3-gram 24K bar.
Purity dictates the exact fractional discount applied to the baseline spot price, as wholesale benchmark rates set by entities like the LBMA—such as the roughly $130 per gram valuation seen in mid-2026—only reflect 24K pure gold. When a refinery or dealer calculates the 3 gram gold price today, they multiply the total physical weight by the karat percentage and the current spot rate.
Because base metals like copper and zinc trade for mere cents per pound, their contribution to a piece's melt value is effectively zero. An 18K item (75% pure) will naturally price at precisely 75% of the 24K spot price, minus any dealer premiums or refining fees.
| Karat | Pure Gold Content | Actual Gold Weight in a 3g Item | Estimated Melt Value (at $130/g Spot)* |
|---|---|---|---|
| 24K | 99.9% | 3.00 grams | $390.00 |
| 22K | 91.6% | 2.75 grams | $357.24 |
| 18K | 75.0% | 2.25 grams | $292.50 |
| 14K | 58.3% | 1.75 grams | $227.37 |
\Melt values represent the raw metallic worth before retail premiums or secondary-market refining fees are applied.*
The karatage of a physical 3-gram piece dictates the direct trade-off between its intrinsic metallurgical value and its structural durability. A 3 gram gold coin price aligns perfectly with the raw spot market but scratches easily, whereas lower-karat items sacrifice metal value to gain the tensile strength required for daily wear.
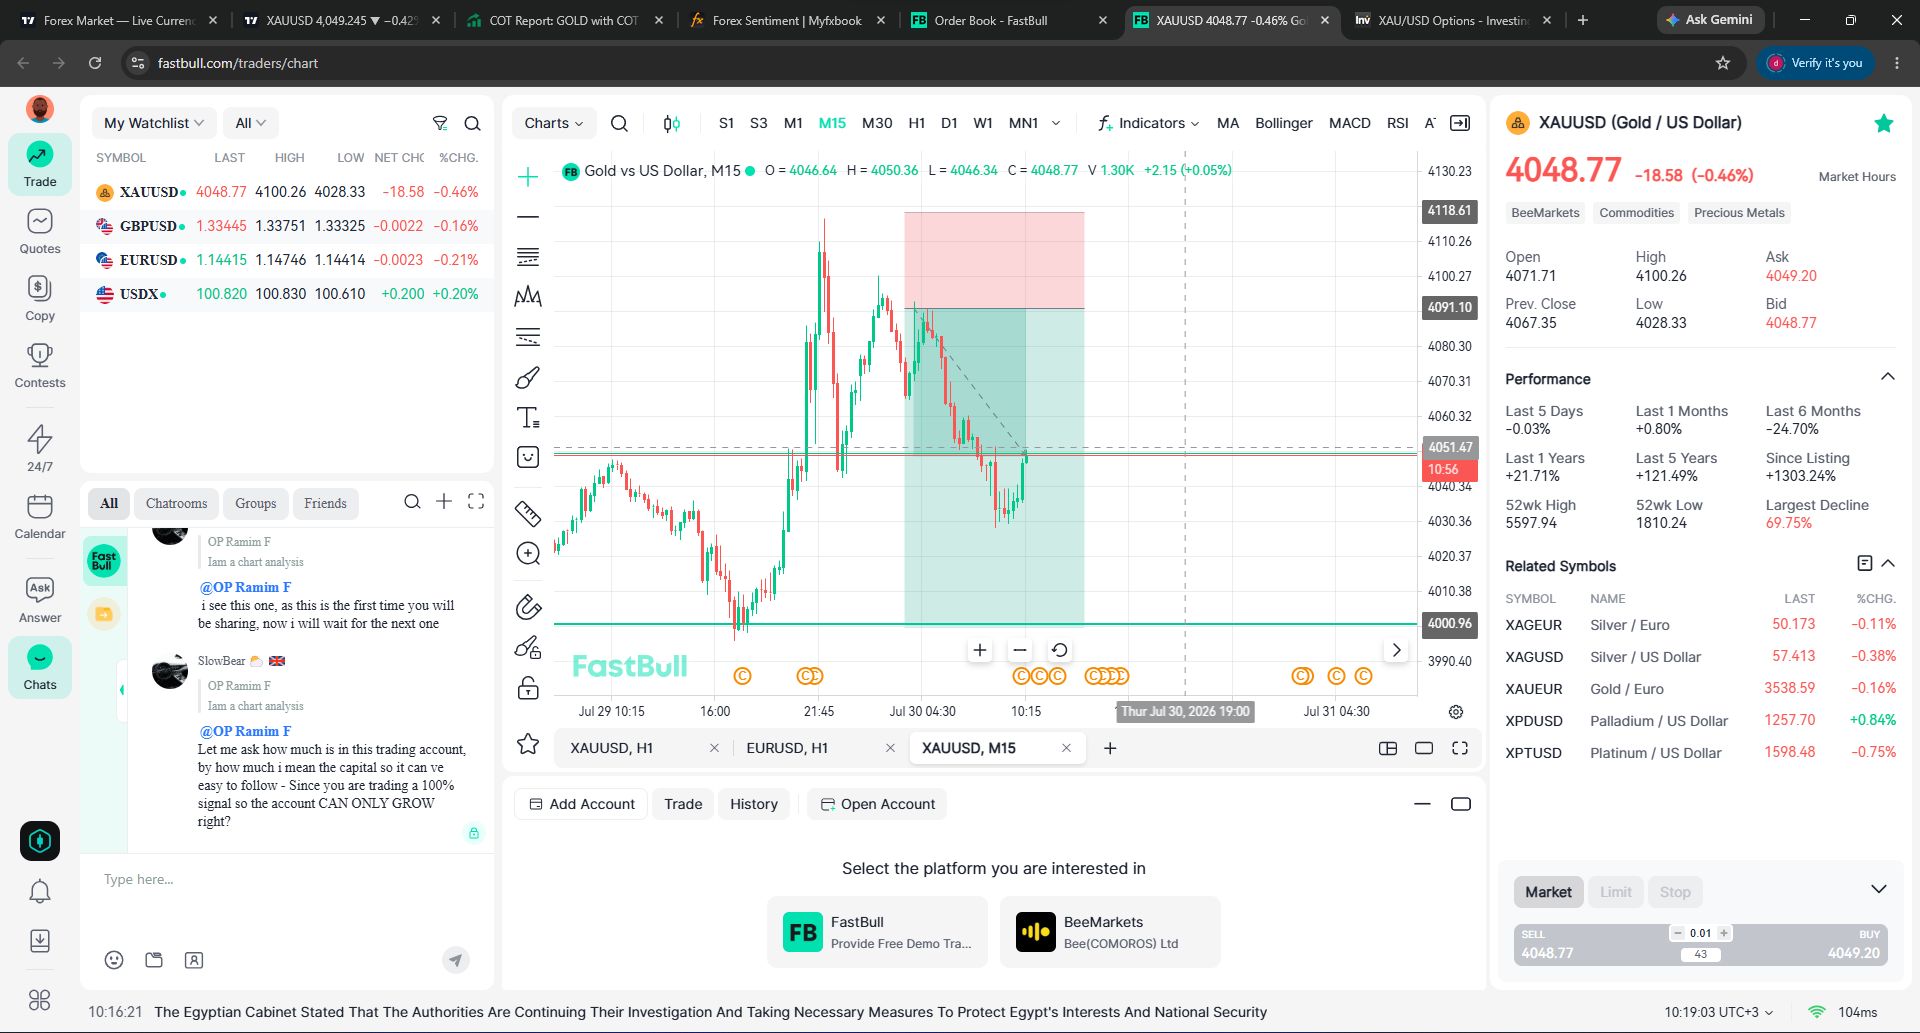
Regardless of the karat tier you choose, these baseline valuations are constantly shifting in response to macroeconomic forces. The retail cost of a 3-gram gold piece is anchored by global spot prices consolidating near $4,040 per troy ounce in late July 2026. Retailers derive today's exact premiums from a tug-of-war between aggressive physical accumulation by global central banks and restrictive monetary policy from the US Federal Reserve. At current spot levels, the raw melt value of a 3-gram 24K gold bar sits near $389, before assay fees, dealer markups, and local taxes are applied.
Base Melt Value for 3 Grams (Late July 2026 Spot)
| Purity | Gold Content | Estimated Raw Value (USD) | Common Retail Application |
|---|---|---|---|
| 24K | 99.9% | $389.67 | Bullion bars, investment coins |
| 22K | 91.6% | $357.20 | Premium Asian/Middle Eastern jewelry |
| 18K | 75.0% | $292.25 | Standard fine jewelry, luxury rings |
| 14K | 58.3% | $227.29 | High-durability commercial jewelry |
(Note: Excludes fabrication and dealer premiums, which typically add 10-25% to the final retail purchase price.)
Intense central bank purchasing and localized geopolitical risk premiums are currently defending gold's pricing floor after its sharp correction from January 2026 highs. Spot prices have retraced nearly 25% from their $5,595 peak, shifting the market from speculative momentum to fundamentally driven consolidation.
A resilient US dollar and persistent global inflation are capping gold's upside by forcing central banks to maintain high real interest rates. Because gold generates no yield, its price mechanics are highly sensitive to the opportunity cost of holding zero-coupon assets.
With US annual CPI registering at 3.5% in June 2026—well above the Federal Reserve's 2.0% target—markets are pricing in the reality of higher-for-longer borrowing costs. Ten-year US real yields currently hover near 2.4%, their highest level in recent years. This dynamic directly suppresses gold demand among institutional investors, who can secure guaranteed, inflation-adjusted returns in government paper. The current environment presents a strict trade-off: holding a 3-gram physical hedge against long-term currency debasement means forfeiting the immediate yield offered by money market funds or Treasuries.
Currency dynamics further fragment the price reality for retail buyers. Because the spot market prices gold in US dollars, the 3 gram gold price in India, Pakistan, and the UAE depends entirely on foreign exchange stability. If the Rupee or Dirham weakens against the greenback, local gold prices rise even if the global spot price remains flat. Consequently, buyers in emerging markets are currently paying a double premium: the high base cost of the metal and the localized penalty of a depreciating domestic currency.
Beyond these macroeconomic spot fluctuations, when buying 3 grams of gold at retail, expect to pay between 8% and 60% above the live spot market rate, depending entirely on the item's form and your geographical market. If the raw spot value of 24K gold is roughly $130 per gram, the raw material for a 3-gram piece sits near $390. However, a 3-gram fractional investment bar will typically retail for $430, while a heavily designed 3-gram 14K ring can easily cost over $500—despite containing significantly less pure gold. To calculate the actual out-of-pocket cost, dealers rely on a standard pricing formula: (Live Spot Price of Specific Karat × Weight) + Making Charges + Local Taxes.
The spot rate reflects raw, unrefined bullion traded in massive quantities on wholesale exchanges like the COMEX or LBMA. Physical retailers must recoup several layers of operational and production costs incurred between the refinery and the display case:
Markup structures vary wildly by region and product format. In Western markets like the United States, jewelry is usually priced as a finished good, obscuring the exact markup on the underlying metal. Conversely, tracking the 3 gram gold price in India or Dubai reveals a highly transparent model: the piece is weighed at the counter, a distinct "making charge" is added to the live 3 gram gold price today, and the transaction concludes with a standardized local tax.
Whether you are comparing a 1 gram gold bar value as a starter investment or estimating a baseline 3 gram 14k gold price for a custom pendant, use this framework to assess standard retail markups:
| Product Category | Common Karatage | Typical Markup Over Spot | Global Pricing Convention |
|---|---|---|---|
| Fractional Bullion (Bars/Coins) | 24K (99.9%) | 8% – 15% | Priced explicitly by metal weight plus a fixed mint premium. A 3 gram gold coin price carries a higher percentage premium than a 1-ounce equivalent due to fixed striking costs. |
| Basic Machine-Made Jewelry | 14K, 18K, 22K | 15% – 30% | Sold by live weight plus a flat making charge per gram (the common standard in Middle Eastern and Asian hubs). |
| Handcrafted / Designer Jewelry | 14K, 18K, 22K | 40% – 100%+ | Sold by the piece ("ticket price"). Brand prestige, gem-setting, and complex labor permanently detach the retail cost from the raw material value. |
The cost of 3 grams of gold depends on the current global spot price, which constantly fluctuates based on market conditions. Based on recent rates of approximately $130 per gram, 3 grams of pure gold has a raw value of around $390. If you are purchasing physical gold, the actual cost will be higher due to standard dealer premiums and manufacturing fees.
To calculate the base value of 3 grams of gold, you can multiply the current gold spot price per gram by three. Alternatively, if you are using the spot price per troy ounce, divide that figure by 31.1035 to find the gram price, and then multiply the result by three. If you are calculating the cost to purchase a physical gold item, you must also add the dealer's markup to this base calculation.
With the gold spot price currently trading at roughly $4,040 per troy ounce, the base value of a single gram is about $130 in US dollars. Therefore, the melt value of 3 grams of pure gold is approximately $390 USD. The exact retail cost to buy 3 grams of physical gold in US dollars will be higher than the melt value due to dealer premiums.
The price of a physical 3-gram gold bar is determined by taking the current spot price of the gold content and adding a dealer premium. With 3 grams of gold currently holding a base market value of approximately $390, a physical bar will cost more than this amount. Dealers add varying premiums, such as a flat fee or a percentage markup, to cover the costs of manufacturing, assaying, and distribution.
Determining the true cost of a 3-gram gold piece requires isolating the pure metal content from dealer markups and alloy weights. By multiplying the live spot price by the specific karat percentage—whether 14K for durable jewelry or 24K for investment bullion—buyers and sellers can establish a firm baseline valuation. Understanding these distinct fractional premiums and macroeconomic drivers ensures you can navigate retail transactions and liquidations with mathematical precision.

728 RM B 7/F GEE LOK IND BLDG NO 34 HUNG TO RD KWUN TONG KLN HONG KONG





The risk of loss in trading financial instruments such as stocks, FX, commodities, futures, bonds, ETFs and crypto can be substantial. You may sustain a total loss of the funds that you deposit with your broker. Therefore, you should carefully consider whether such trading is suitable for you in light of your circumstances and financial resources.
No decision to invest should be made without thoroughly conducting due diligence by yourself or consulting with your financial advisors. Our web content might not suit you since we don't know your financial conditions and investment needs. Our financial information might have latency or contain inaccuracy, so you should be fully responsible for any of your trading and investment decisions. The company will not be responsible for your capital loss.
Without getting permission from the website, you are not allowed to copy the website's graphics, texts, or trademarks. Intellectual property rights in the content or data incorporated into this website belong to its providers and exchange merchants.
Not Logged In
Log in to access more features


Log In
Sign Up