• Trade
  • Markets
  • Copy
  • Contests
  • 24/7
  • Calendar
  • Q&A
  • Chats
Screeners
SYMBOL
LAST
BID
ASK
HIGH
LOW
NET CHG.
%CHG.
SPREAD
SOURCE
SPX
S&P 500 Index
7698.64
7698.64
7698.64
7724.16
7666.59
-44.77
-0.58%
--
--
DJI
Dow Jones Industrial Average
51595.86
51595.86
51595.86
51780.51
51409.66
-232.76
-0.45%
--
--
IXIC
NASDAQ Composite Index
26888.15
26888.15
26888.15
26990.02
26709.69
-180.56
-0.67%
--
--
USDX
US Dollar Index
100.810
100.810
100.890
101.000
100.670
+0.070
+ 0.07%
--
--
EURUSD
Euro / US Dollar
1.13762
1.13762
1.13770
1.13908
1.13520
-0.00129
-0.11%
--
--
GBPUSD
Pound Sterling / US Dollar
1.32669
1.32669
1.32679
1.32798
1.32202
+0.00250
+ 0.19%
--
--
XAUUSD
Gold / US Dollar
4135.51
4135.51
4135.92
4276.07
4110.71
-149.34
-3.49%
--
--
WTI
Light Sweet Crude Oil
91.486
91.486
91.516
94.999
89.991
+0.167
+ 0.18%
--
--

Community Accounts

Signal Accounts
--
Profit Accounts
--
Loss Accounts
--
View More

Become a signal provider

Sell trading signals to earn additional income

View More

Guide to Copy Trading

Get started with ease and confidence

View More

Signal Accounts for Members

All Signal Accounts

Best Return
  • Best Return
  • Best P/L
  • Best MDD
Past 1W
  • Past 1W
  • Past 1M
  • Past 1Y

All Contests

  • All
  • Recommend
  • Stocks
  • Cryptocurrencies
  • Central Banks
  • Trump Updates
  • Featured News
Top News Only
Share

Federal Reserve Governor Cook: To Date, There Is Limited Evidence That Artificial Intelligence Is Changing The Structure Of The Labor Market

Share

Federal Reserve Governor Cook: The Productivity Gains Brought About By Artificial Intelligence Will Have A Mild De-inflationary Effect In The Coming Years

Share

Federal Reserve Governor Cook: There Are Signs Of Widespread Pressure In Inflation Data

Share

Federal Reserve Governor Cook: The Number And Magnitude Of Future Interest Rate Adjustments Will Be Influenced By Inflation And Labor Market Data, As Well As The Economy’s Response To The Actions The Fed Has Taken So Far

Share

Federal Reserve Governor Cook: The Labor Market Is Ready For Interest Rate Hikes

Share

Federal Reserve Governor Cook: We Expect To Continue To Face Inflationary Pressures From Artificial Intelligence And The Middle East Conflict In The Coming Months

Share

Putin Signs A Presidential Decree; The Russian Military Is Being Expanded Once Again

Share

Russian President Vladimir Putin Met With Alexei Likhachev, CEO Of Rosatom

Share

Yemeni Military: Over The Past 24 Hours, We Conducted 356 Precision Strikes Against Legitimate Military Targets Of The Houthi Armed Group Across Various Fronts And Directions. According To Field Assessments, These Operations Resulted In The Elimination Of 476 Houthi Militants

Share

The Federal Reserve Accepted A Total Of $851 Million From Three Counterparties In Its Fixed-rate Reverse Repurchase Operations

Share

According To Saudi Media Outlet Alhadath, Sources Say That Mediators Are Pressuring Iran To Make Concessions On The Nuclear Issue

Share

According To Saudi Media Outlet Alhadath, Sources Say Iran Has Agreed To Halt Uranium Enrichment In Exchange For The Easing Of US Sanctions

Share

Both WTI And Brent Crude Oil Prices Fell By 1.00% During The Day, Currently Trading At $96.32 Per Barrel And $90.40 Per Barrel Respectively

Share

Houthi Rebels: In The Past 24 Hours, Saudi Warplanes Launched 38 Airstrikes And Missile Attacks, Using F-15 And Typhoon Fighter Jets That Took Off From Khamis Mushait And Taif Air Bases. Since The Escalation Of The Situation, The Total Number Of Saudi Airstrikes And Missile Attacks Has Reached 1,123

Share

The Mayor Of Kyiv Reported That A Non-residential Building In The Oblonsky District Was Attacked, And A Warehouse Building At Another Location Caught Fire

Share

According To Relevant Budget Documents, Russia Expects To Receive 200 Billion Rubles Annually From Windfall Profits Taxes Levied On Mining And Metal Companies Between 2027 And 2029

Share

Turkish President Erdogan: Measures Are Being Taken To Ensure That Similar Problems Do Not Happen Again

Share

Turkish President Erdogan: We Are Acting Very Cautiously, And The Fund Clearing Work Is Proceeding Seriously

Share

The European Union Failed To Reach An Agreement On Providing Ukraine With Additional Patriot Missiles

Share

Israeli Military Claims Strikes On Hezbollah Infrastructure In Southern Lebanon

TIME
ACT
FCST
PREV
IMPACT
U.S. Weekly Treasuries Held by Foreign Central Banks

A:--

F: --

P: --

USDX
  • USDX
  • XAUUSD
  • XAGUSD
  • WTI
U.K. GfK Consumer Confidence Index (Sept)

A:--

F: --

P: --

GBPUSD
  • GBPUSD
  • XAUUSD
  • XAGUSD
  • WTI
Germany GfK Consumer Confidence Index (SA) (Oct)

A:--

F: --

P: --
EURUSD
  • EURUSD
  • XAUUSD
  • XAGUSD
  • WTI
  • USDX
Euro Zone 3-Month M3 Money Supply YoY (Aug)

A:--

F: --

P: --

EURUSD
  • EURUSD
  • XAUUSD
  • XAGUSD
  • WTI
  • USDX
Euro Zone M3 Money Supply YoY (Aug)

A:--

F: --

P: --

EURUSD
  • EURUSD
  • XAUUSD
  • XAGUSD
  • WTI
  • USDX
Euro Zone Private Sector Credit YoY (Aug)

A:--

F: --

P: --

EURUSD
  • EURUSD
  • XAUUSD
  • XAGUSD
  • WTI
  • USDX
New York Federal Reserve President Williams delivered a speech.
India Deposit Gowth YoY

A:--

F: --

P: --

XAUUSD
  • XAUUSD
  • XAGUSD
  • WTI
  • USDX
Mexico Unemployment Rate (Not SA) (Aug)

A:--

F: --

P: --

XAUUSD
  • XAUUSD
  • XAGUSD
  • WTI
  • USDX
U.S. Durable Goods Orders MoM (Aug)

A:--

F: --

P: --
USDX
  • USDX
  • XAUUSD
  • XAGUSD
  • WTI
U.S. Durable Goods Orders MoM (Excl.Transport) (Aug)

A:--

F: --

P: --
USDX
  • USDX
  • XAUUSD
  • XAGUSD
  • WTI
U.S. Non-Defense Capital Durable Goods Orders MoM (Excl. Aircraft) (Aug)

A:--

F: --

P: --
USDX
  • USDX
  • XAUUSD
  • XAGUSD
  • WTI
U.S. Durable Goods Orders MoM (Excl. Defense) (SA) (Aug)

A:--

F: --

P: --
USDX
  • USDX
  • XAUUSD
  • XAGUSD
  • WTI
U.S. UMich Current Economic Conditions Index Final (Sept)

A:--

F: --

P: --

USDX
  • USDX
  • XAUUSD
  • XAGUSD
  • WTI
U.S. UMich Consumer Expectations Index Final (Sept)

A:--

F: --

P: --

USDX
  • USDX
  • XAUUSD
  • XAGUSD
  • WTI
U.S. UMich Consumer Sentiment Index Final (Sept)

A:--

F: --

P: --

USDX
  • USDX
  • XAUUSD
  • XAGUSD
  • WTI
U.S. UMich 1-Year-Ahead Inflation Expectations Final (Sept)

A:--

F: --

P: --

USDX
  • USDX
  • XAUUSD
  • XAGUSD
  • WTI
Canada Federal Government Budget Balance (Jul)

A:--

F: --

P: --

USDCAD
  • USDCAD
  • XAUUSD
  • XAGUSD
  • WTI
  • USDX
U.S. Weekly Total Oil Rig Count

A:--

F: --

P: --

WTI
  • WTI
  • XAUUSD
  • XAGUSD
  • USDX
U.S. Weekly Total Rig Count

A:--

F: --

P: --

WTI
  • WTI
  • XAUUSD
  • XAGUSD
  • USDX
FOMC Member Hammack Speaks
China, Mainland Industrial Profit YoY (YTD) (Aug)

A:--

F: --

P: --

XAUUSD
  • XAUUSD
  • XAGUSD
  • WTI
  • USDX
India Manufacturing Output MoM (Aug)

A:--

F: --

P: --

XAUUSD
  • XAUUSD
  • XAGUSD
  • WTI
  • USDX
India Industrial Production Index YoY (Aug)

A:--

F: --

P: --

XAUUSD
  • XAUUSD
  • XAGUSD
  • WTI
  • USDX
Brazil Current Account (Aug)

A:--

F: --

P: --

XAUUSD
  • XAUUSD
  • XAGUSD
  • WTI
  • USDX
Mexico Trade Balance (Aug)

A:--

F: --

P: --

XAUUSD
  • XAUUSD
  • XAGUSD
  • WTI
  • USDX
Canada National Economic Confidence Index

A:--

F: --

P: --

USDCAD
  • USDCAD
  • XAUUSD
  • XAGUSD
  • WTI
  • USDX
ECB President Lagarde Speaks
U.S. Dallas Fed General Business Activity Index (Sept)

A:--

F: --

P: --

USDX
  • USDX
  • XAUUSD
  • XAGUSD
  • WTI
U.S. Dallas Fed New Orders Index (Sept)

A:--

F: --

P: --

USDX
  • USDX
  • XAUUSD
  • XAGUSD
  • WTI
Richmond Federal Reserve President Barkin delivered a speech.
U.K. BRC Shop Price Index YoY (Sept)

--

F: --

P: --

Australia Overnight (Borrowing) Key Rate

--

F: --

P: --

RBA Rate Statement
RBA Press Conference
Turkey Economic Sentiment Indicator (Sept)

--

F: --

P: --

U.K. M4 Money Supply YoY (Aug)

--

F: --

P: --

U.K. Mortgage Lending (Aug)

--

F: --

P: --

U.K. M4 Money Supply MoM (Aug)

--

F: --

P: --

U.K. Mortgage Approvals (Aug)

--

F: --

P: --

Euro Zone Consumer Confidence Index Final (Sept)

--

F: --

P: --

Euro Zone Services Sentiment Index (Sept)

--

F: --

P: --

Euro Zone Economic Sentiment Indicator (Sept)

--

F: --

P: --

Euro Zone Industrial Climate Index (Sept)

--

F: --

P: --

Italy PPI YoY (Aug)

--

F: --

P: --

Euro Zone Consumer Inflation Expectations (Sept)

--

F: --

P: --

Euro Zone Selling Price Expectations (Sept)

--

F: --

P: --

Italy 10-Year BTP Bond Auction Avg. Yield

--

F: --

P: --

Italy 5-Year BTP Bond Auction Avg. Yield

--

F: --

P: --

France Unemployment Class-A (Aug)

--

F: --

P: --

Brazil Unemployment Rate (Aug)

--

F: --

P: --

Canada GDP YoY (Jul)

--

F: --

P: --

Canada GDP MoM (SA) (Jul)

--

F: --

P: --

U.S. Weekly Redbook Index YoY

--

F: --

P: --

U.S. S&P/CS 20-City Home Price Index MoM (SA) (Jul)

--

F: --

P: --

U.S. S&P/CS 10-City Home Price Index MoM (Not SA) (Jul)

--

F: --

P: --

U.S. S&P/CS 10-City Home Price Index YoY (Jul)

--

F: --

P: --

U.S. FHFA House Price Index YoY (Jul)

--

F: --

P: --

U.S. FHFA House Price Index (Jul)

--

F: --

P: --

U.S. S&P/CS 20-City Home Price Index YoY (Not SA) (Jul)

--

F: --

P: --

U.S. FHFA House Price Index MoM (Jul)

--

F: --

P: --

Q&A with Experts
    • All
    • Chatrooms
    • Groups
    • Friends
    SlowBear ⛅ flag
    SlowBear ⛅
    @zenko Alright bro, i will soon go and eat too, did you see Nawhdir today?
    @zenko if you see Nawhdir in mosque tell him, SlowBear ask after him!
    Osaghae Cephas flag
    SlowBear ⛅
    @sanjeevThis is why anyone that rushed into buying gold always become a liquidity
    @SlowBear ⛅I know right😆
    sanjeev flag
    SlowBear ⛅
    @sanjeev i mean it has never been more clear, since gold broke below 4220 it is strait sell, simple as that
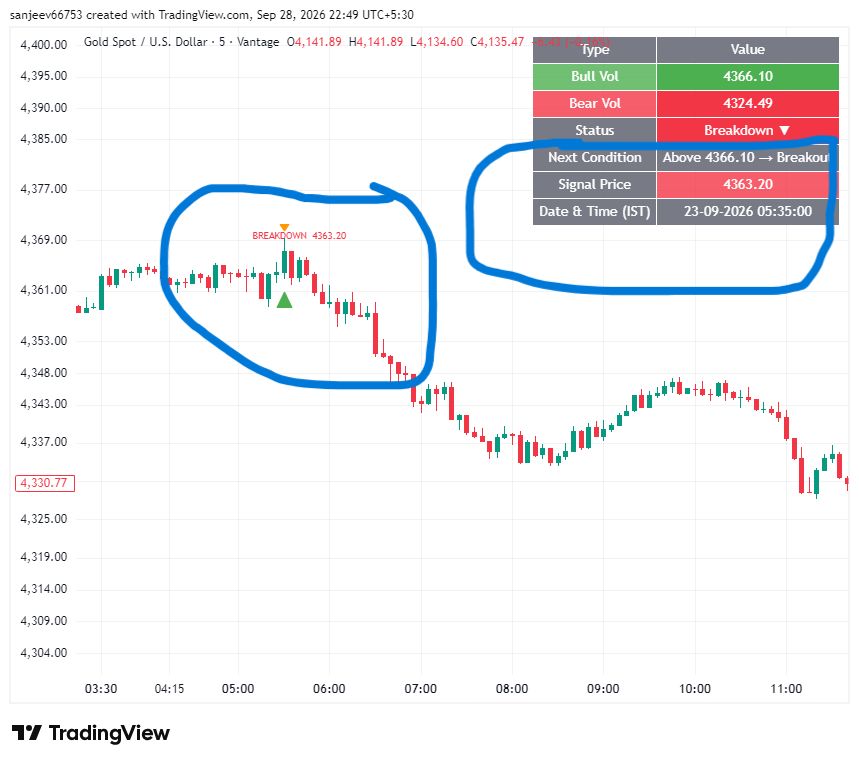
    @SlowBear ⛅ yeh bro, but for me breakdown came at 4324 as also shared in group the breakdown level
    Osaghae Cephas flag
    SlowBear ⛅
    @zenko NFP would be the right catalyst to drive gold higher and that will be if the data came unfavorable to the US dollar
    @SlowBear ⛅ohh looking forward to NFP
    Osaghae Cephas flag
    SlowBear ⛅
    @zenko if you see Nawhdir in mosque tell him, SlowBear ask after him!
    @SlowBear ⛅would u be trading gold that day if the data are released early?
    SlowBear ⛅ flag
    Osaghae Cephas
    @SlowBear ⛅I know right😆
    @Osaghae CephasLol, i see this is why you stepped away from gold buy early if you gad not, you would have become the market meal
    SlowBear ⛅ flag
    sanjeev
    @SlowBear ⛅ yeh bro, but for me breakdown came at 4324 as also shared in group the breakdown level
    @sanjeevOh for sure, the structre started at 4324 - 4330 then it proceeds, i have been folowing your calls
    Osaghae Cephas flag
    SlowBear ⛅
    @Osaghae CephasLol, i see this is why you stepped away from gold buy early if you gad not, you would have become the market meal
    @SlowBear ⛅haha after my fav btc USD gave me a loss of 40$ after giving me 45$ profit I wondered what gold would have done too me so I avoided it
    SlowBear ⛅ flag
    sanjeev
    @SlowBear ⛅ yeh bro, but for me breakdown came at 4324 as also shared in group the breakdown level
    @sanjeevBut, last week you were rather bulish though, however you are a trader who follow the market as it flows so no point in marrying a particular bias
    SlowBear ⛅ flag
    Osaghae Cephas
    @SlowBear ⛅ohh looking forward to NFP
    @Osaghae Cephas Same here bro, i cannot wait for the NFP to come in and we get another round of data
    SlowBear ⛅ flag
    Osaghae Cephas
    @SlowBear ⛅would u be trading gold that day if the data are released early?
    @Osaghae Cephas You know me bro, i rather just wait than get myself into the drama that coems with the data releases
    SlowBear ⛅ flag
    SlowBear ⛅
    @Osaghae Cephas You know me bro, i rather just wait than get myself into the drama that coems with the data releases
    @Osaghae Cephas So i will rather wait till the data is released before i start engaging
    SlowBear ⛅ flag
    Osaghae Cephas
    @SlowBear ⛅haha after my fav btc USD gave me a loss of 40$ after giving me 45$ profit I wondered what gold would have done too me so I avoided it
    @Osaghae Cephas Well i guess we would never kmow but still its is a good decision afterall
    Osaghae Cephas flag
    SlowBear ⛅
    @Osaghae Cephas Same here bro, i cannot wait for the NFP to come in and we get another round of data
    @SlowBear ⛅yh
    Osaghae Cephas flag
    SlowBear ⛅
    @Osaghae Cephas You know me bro, i rather just wait than get myself into the drama that coems with the data releases
    @SlowBear ⛅ohh I understand
    SlowBear ⛅ flag
    Osaghae Cephas
    @SlowBear ⛅yh
    @Osaghae Cephas And how is the GBPUSD playing out now? you see the difference the fx market is pretty slow
    SlowBear ⛅ flag
    Osaghae Cephas
    @SlowBear ⛅ohh I understand
    @Osaghae Cephas Cool, this has really worked for me long term
    sanjeev flag
    Osaghae Cephas flag
    SlowBear ⛅
    @Osaghae Cephas Well i guess we would never kmow but still its is a good decision afterall
    @SlowBear ⛅yh
    Osaghae Cephas flag
    SlowBear ⛅
    @Osaghae Cephas And how is the GBPUSD playing out now? you see the difference the fx market is pretty slow
    @SlowBear ⛅yes
    Type here...
    Add Symbol or Code

      No matching data

      All
      Recommend
      Stocks
      Cryptocurrencies
      Central Banks
      Trump Updates
      Featured News
      • All
      • Russia-Ukraine Conflict
      • Middle East Flashpoint
      • All
      • Russia-Ukraine Conflict
      • Middle East Flashpoint
      Search
      Products

      Charts Free Forever

      Chats Q&A with Experts
      Screeners Economic Calendar Data Tools
      Membership Features
      Data Warehouse Market Trends Institutional Data Policy Rates Macro

      Market Trends

      Market Sentiment Order Book Forex Correlations

      Top Indicators

      Charts Free Forever
      Markets

      News

      24/7 Analysis Education

      Latest Views

      Latest Update

      Signals

      Copy Rankings Latest Signals Become a signal provider AI Rating
      Contests
      Brokers

      Overview Brokers Assessment Rankings Regulators News Claims
      Broker listing Forex Brokers Comparison Tool Live Spread Comparison Scam
      Q&A Complaint Scam Alert Videos Tips to Detect Scam
      More

      Business
      Events
      Careers About Us Advertising Help Center

      White Label

      Broker API

      Data API

      Web Plug-ins

      Affiliate Program

      Awards Institution Evaluation IB Seminar Salon Event Exhibition
      Vietnam Thailand Singapore Dubai
      Fans Party Investment Sharing Session
      FastBull Summit BrokersView Expo
      Recent Searches
        Top Searches
          Markets
          Analysis
          User
          24/7
          Economic Calendar
          Education
          Data
          • Names
          • Latest
          • Prev

          View All

          No data

          Scan to Download

          Faster Charts, Chat Faster!

          Download
          English
          • English
          • Español
          • العربية
          • Bahasa Indonesia
          • Bahasa Melayu
          • Tiếng Việt
          • ภาษาไทย
          • Français
          • Italiano
          • Türkçe
          • Русский язык
          • 简中
          • 繁中
          Open Account
          Search
          Products
          Charts Free Forever
          Markets
          News
          Signals

          Copy Rankings Latest Signals Become a signal provider AI Rating
          Contests
          Brokers

          Overview Brokers Assessment Rankings Regulators News Claims
          Broker listing Forex Brokers Comparison Tool Live Spread Comparison Scam
          Q&A Complaint Scam Alert Videos Tips to Detect Scam
          More

          Business
          Events
          Careers About Us Advertising Help Center

          White Label

          Broker API

          Data API

          Web Plug-ins

          Affiliate Program

          Awards Institution Evaluation IB Seminar Salon Event Exhibition
          Vietnam Thailand Singapore Dubai
          Fans Party Investment Sharing Session
          FastBull Summit BrokersView Expo

          Recent Trends in Indian Stock Market: 2026 Analysis & Outlook

          FastBull
          Summary:

          As domestic liquidity battles global headwinds, we analyze recent trends in indian stock market to map the high-stakes winners and losers of 2026.

          The Indian equity landscape in 2026 presents a complex battleground where unprecedented domestic liquidity squares off against volatile global headwinds. Retail investors and domestic institutions are fundamentally reshaping how capital flows through the country's exchanges, offering a structural buffer against external macroeconomic shocks. This analysis breaks down the sectoral rotations, valuation challenges, and geopolitical risks currently dictating market performance to provide a clear outlook for the remainder of the year.

          Recent Trends in Indian Stock Market: 2026 Analysis & Outlook

          What's Actually Driving the Indian Stock Market in 2026?

          The Indian stock market in 2026 is defined by an ongoing tug-of-war between persistent geopolitical headwinds and unprecedented domestic liquidity. Rising crude oil prices and Middle East instability have capped index-level gains, while aggressive domestic institutional buying has structurally insulated the market from foreign capital flight.

          How Did the Market Perform in the First Half of 2026?

          Indian equities recorded their worst first-half performance since 2022, with the Nifty 50 declining 8.7% between January and June. The drawdown was triggered primarily by war-driven volatility—specifically US-Iran skirmishes—which pushed Brent crude prices near the $100 per barrel mark. This elevated crude pricing raised immediate concerns around imported inflation and widening current account deficits.

          Despite this H1 contraction, the market demonstrated structural resilience rather than a fundamental breakdown. By late July 2026, the Nifty 50 recovered to trade above the 24,300 level, aided by easing tensions in the Strait of Hormuz and strong quarterly corporate earnings. Current dynamics reflect a transition from a sentiment-driven selloff to an earnings-execution phase, where valuations are strictly tied to margin sustainability.

          Which Sectors Are Leading — and Which Are Lagging?

          Capital is rapidly rotating out of consumer-heavy and export-dependent segments into infrastructure, energy, and defensive plays. Evaluating the Recent Trends in Indian Stock Market reveals a stark divergence in sectoral returns driven by input cost fluctuations and global technology shifts.

          Sector StatusIndex / SegmentPrimary Driver of 2026 Performance
          LeadingNifty AutoSustained domestic demand and lower raw material overheads prior to the Q2 oil spike.
          LeadingNifty Oil & GasDirect beneficiaries of elevated crude prices and refining margin expansions.
          LeadingNifty PharmaActing as a classic defensive hedge against broader market volatility and rupee depreciation.
          LaggingNifty ITSevere rout driven by global artificial intelligence disruption concerns and delayed US client spending.
          LaggingCementMargin compression from a ₹200–₹250 per tonne cost increase due to elevated pet-coke prices.
          LaggingFMCGMuted volume growth and shrinking margins amid persistent food inflation and input cost pressures.

          Investors allocating capital based on historical momentum are finding that 2026 requires strict bottom-up stock picking. Sectors relying on discretionary spending remain under pressure, while those tied to hard assets or non-discretionary consumption are absorbing the institutional inflows.

          What Role Are FIIs and DIIs Playing in the Current Rally or Selloff?

          Domestic Institutional Investors (DIIs) are currently single-handedly supporting the Indian stock market, completely offsetting record liquidations by Foreign Institutional Investors (FIIs). As of June 2026, a structural shift in institutional ownership materialized, marking the ninth consecutive quarter of rising domestic dominance.

          • The DII Liquidity Buffer: Sustained retail participation through systematic investment plans (SIPs) pushed DII ownership in Nifty 500 companies to an all-time high of 21%. Over the 22 months leading to mid-2026, domestic funds deployed a record $166 billion into the market. This capital effectively absorbed the foreign selloff without triggering a systemic market crash.
          • The FII Exodus and Return: Foreign ownership in the Nifty 500 dropped to a record low of 17% in H1 2026. Outflows peaked in March 2026 at a staggering ₹1.22 lakh crore, driven by elevated US Treasury yields and geopolitical caution. However, FII selling pressure eased sharply by July, shrinking to just ₹5,780 crore in net outflows, signaling a stabilization in foreign sentiment as global crude prices moderated.

          The primary trade-off in this new dynamic is volatility versus valuation. While DII liquidity has lowered market beta and prevented steep drawdowns, it has also kept valuations artificially elevated in specific mid- and small-cap segments. Foreign investors returning to the market are now largely bypassing expensive large-caps in favor of targeted mid-cap growth opportunities where earnings visibility remains intact.

          What Structural Shifts Are Reshaping Indian Equities Right Now?

          The Indian equity market is fundamentally decoupling from its historical reliance on foreign capital due to three specific forces: the financialization of domestic savings, stretched valuations in lower market-cap tiers, and an accommodative domestic monetary policy. These factors dictate the Recent Trends in Indian Stock Market dynamics and define how capital is currently being allocated across sectors.

          How Is the Retail Investor Boom Changing Market Behavior?

          The influx of domestic retail capital has structurally suppressed market volatility and created a permanent domestic bid for equities. In June 2026, monthly Systematic Investment Plan (SIP) inflows reached a record ₹31,781 crore, marking 63 consecutive months of positive equity fund flows. Concurrently, Central Depository Services Limited (CDSL) alone registered over 18.59 crore demat accounts by mid-2026, reflecting unprecedented direct market participation.

          This retail boom alters market mechanics through two specific channels:

          • Neutralizing Foreign Institutional Investor (FII) Outflows: Historically, when FIIs sold heavily, Indian indices plummeted. Today, as established by the first-half data, retail-backed Domestic Institutional Investors (DIIs) routinely absorb these sell-offs. Monthly domestic inflows of nearly ₹30,000 crore act as a structural shock absorber.
          • Sector Rotation Speed: Retail investors and mutual funds are pivoting capital faster between sectors. Deep domestic liquidity allows for the rapid repricing of underperforming sectors without dragging the broader Nifty 50 down.

          Are Indian Mid-Caps and Small-Caps Still Worth the Risk in 2026?

          Indian mid-caps and small-caps offer localized growth opportunities, but they require investors to accept historically steep valuation premiums. As of July 2026, the Nifty Midcap 150 index trades at a Price-to-Earnings (PE) ratio of 30.41, representing a substantial premium over the Nifty 50's PE of 20.77.

          The rationale for holding these tiers relies on sustained earnings growth in domestic manufacturing, capital goods, and defense. However, any earnings miss at these multiples will trigger severe price corrections.

          Metric (July 2026)Nifty 50 (Large-Cap)Nifty Midcap 150Valuation Implication
          Trailing PE Ratio20.7730.41Mid-caps are priced for flawless earnings execution; large-caps offer a higher margin of safety.
          Dividend Yield~1.2%0.62%Large-caps provide better downside protection through consistent cash payouts.
          Earnings DriversGlobal IT, Mega-Banks, EnergyCapital Goods, Niche ManufacturingMid-caps capture localized capex cycles; large-caps are tied heavily to global macroeconomic trends.

          Investors allocating to this space in 2026 must shift from passive index buying to active stock selection, avoiding companies where the PE expansion has entirely detached from free cash flow growth.

          How Are RBI Policy Moves Feeding Into Stock Market Momentum?

          The Reserve Bank of India’s decision to hold the repo rate steady at 5.25% provides a predictable cost of capital that supports corporate margin expansion. Following rate cuts from the 6.5% peak in 2023, the RBI shifted to a neutral stance in mid-2026, balancing resilient economic growth against retail inflation hovering around 4.4%.

          This monetary environment feeds equity momentum through specific mechanisms:

          1. Debt Servicing Costs: Infrastructure, real estate, and leveraged manufacturing firms are reporting higher net profit margins as their interest coverage ratios improve under the 5.25% regime.
          2. Equity Risk Premium: A stable, lower risk-free rate makes the earnings yield of equities more attractive compared to fixed-income alternatives, driving domestic capital away from traditional bank deposits and into mutual funds.

          Rate Policy Decision Matrix for Equity Portfolios:

          • If inflation breaches 5% (due to crude oil/monsoon shocks): Expect the RBI to delay further rate cuts. Rate-sensitive sectors like auto and real estate will face valuation compression.
          • If inflation stabilizes near 4%: The RBI may introduce another 25 basis point cut by late 2026. This would trigger a rally in capital-heavy sectors and mid-cap industrials.

          How Do Global Pressures Affect Indian Markets Today?

          External macroeconomic shocks dictate the current trajectory of Indian equities more than domestic earnings growth. Despite domestic institutional support pushing the Nifty 50 toward new highs—prompting Goldman Sachs to set a 29,000 target for December 2026—global headwinds remain severe. The Recent Trends in Indian Stock Market are defined by a tug-of-war between strong domestic liquidity and hostile cross-border conditions. Specifically, foreign portfolio investors (FPIs) pulled out $18.4 billion across Indian asset classes in the first half of 2026, driven by geopolitical risk premiums, before stabilizing with a ₹42,000 crore inflow in July as regional volatility in East Asia pushed capital toward relatively safer large-caps.

          Is the India-U.S. Trade Relationship Helping or Hurting Equities?

          The ongoing trade friction is an active drag on specific export-oriented sectors, though strategic exemptions have shielded the broader market from a deep sell-off. On July 24, 2026, the United States imposed an additional 10% Section 301 tariff on roughly 55% of Indian goods over forced labor allegations, replacing an expiring global surcharge. Because the U.S. remains India's largest trading partner, these Recent Trends in Indian Stock Market directly impact corporate margin projections for the latter half of the year.

          2026 U.S. Tariff Impact on Indian Equities

          SectorU.S. Tariff Status (July 2026)Equity Market Implication
          Generic PharmaceuticalsExempt from Section 301 dutiesPreserves operating margins for large-cap pharma stocks heavily exposed to the U.S. healthcare system.
          Textiles & ApparelSubject to 10% additional tariffNegative. Asian peers (e.g., Bangladesh, Cambodia) may receive preferential tariff-rate quotas, undercutting Indian exporters.
          Smartphones & ElectronicsExempt from Section 301 dutiesProtects Electronic Manufacturing Services (EMS) stocks and maintains India's assembly competitiveness.
          Information TechnologyUnaffected (Merchandise focus)Neutral. IT valuations remain dictated by U.S. enterprise tech budgets and AI spending, not trade tariffs.

          While negotiations for a bilateral trade agreement continue, the immediate reality forces fund managers to underweight vulnerable merchandise exporters until quota relief or tariff reductions materialize.

          How Are Dollar Strength and Oil Prices Hitting Indian Stocks?

          A strengthening dollar and elevated Brent crude prices mechanically compress Indian equity valuations by triggering capital flight and inflating import costs. India imports roughly 85% of its crude oil. As noted earlier, when Brent crude breached the $100 per barrel mark in early 2026 due to Red Sea and Strait of Hormuz maritime disruptions, it initiated a direct transmission mechanism that weighed heavily on Recent Trends in Indian Stock Market:

          1. Import Costs Surge: Every $10 rise in oil prices widens India’s Current Account Deficit (CAD) by roughly 0.35% to 0.5% of GDP. Forecasts for the FY27 CAD quickly widened toward 1.7% following the energy shock.
          2. Rupee Depreciation: The higher energy import bill pushed the USD/INR exchange rate past 95 in mid-2026. A weaker rupee erodes the dollar-denominated returns of foreign investors, accelerating sell-offs.
          3. Monetary Policy Stalls: To defend the currency, the Reserve Bank of India (RBI) intervenes in the FX market and delays expected rate cuts, holding benchmark lending rates higher for longer.
          4. Valuation Compression: Elevated domestic interest rates discount future corporate cash flows more aggressively, directly capping the upside for rate-sensitive sectors like auto and real estate.

          These Recent Trends in Indian Stock Market highlight a stark trade-off: while upstream energy companies see earnings upgrades during crude spikes, oil-consuming sectors—such as aviation, paints, and logistics—face immediate margin contraction. Consequently, institutional investors have rotated capital into defensive large-caps to hedge against persistent dollar strength and energy volatility.

          Where Is the Indian Stock Market Headed for the Rest of 2026?

          The Indian equity market is transitioning from a momentum-driven rally into a phase anchored strictly by earnings execution and domestic liquidity. Institutional consensus, including projections from brokerages like Jefferies and Emkay Global, targets the Nifty 50 in the 28,000 to 29,000 range by late 2026, assuming current support levels near 25,000 hold. MSCI India earnings-per-share (EPS) growth is forecasted to accelerate to 13%–14% for the FY26/27 cycle, providing the fundamental baseline required to justify current valuation multiples. The primary tailwind remains relentless domestic capital via SIPs, which are currently absorbing roughly $7 billion to $8 billion in fresh equity supply monthly and effectively cushioning the index against intermittent foreign sell-offs.

          Which Sectors Look Best Positioned for the Second Half?

          Banking, telecommunications, and auto manufacturers are poised to lead the market's next leg up, driven by tangible earnings visibility and expanding margins. Capital rotation is actively moving away from traditional defensive sectors and into domestic cyclical plays that benefit directly from structural government spending and sustained rural volume recoveries.

          Sector ClassificationInstitutional PositioningPrimary Growth MechanismCore Trade-off to Weigh
          Banking & FinancialsOverweightHigh commercial credit demand and stabilizing net interest margins (NIMs) drive predictable loan book growth.High sensitivity to unforeseen Reserve Bank of India (RBI) rate cycle adjustments.
          TelecommunicationsOverweightImminent late-2026 tariff hikes structurally boost Average Revenue Per User (ARPU) across the oligopoly.Elevated legacy debt burdens and ongoing 5G infrastructure amortization costs.
          Autos & AncillariesOverweightTwo-wheeler volume recovery in rural markets pairs with persistent premiumization in urban SUV segments.Heavy capital expenditure requirements to maintain electric vehicle (EV) market share.
          IT ServicesUnderweight / NeutralMid-cap niche providers capture AI-integration deals, while large-caps rely on cost-optimization contracts.Severe margin compression risk if the US macroeconomic environment enters a recession.
          Consumer StaplesUnderweightDefensive earnings floors protect capital during broader market drawdowns.Persistent rural inflation suppresses volume expansion, severely capping upside price action.

          Analyzing the Recent Trends in Indian Stock Market allocations reveals a strict bifurcation within technology. While large-cap IT services face headwinds from delayed US client spending, select mid-cap IT firms and green energy infrastructure companies are capturing disproportionate institutional alpha.

          What Are the Biggest Downside Risks Investors Should Watch?

          Macroeconomic shocks tied to global energy supply and US equity valuations pose the most immediate threat to India's domestic bull run.

          First, imported inflation via crude oil volatility threatens fiscal stability. As previously noted, India imports over 85% of its crude oil requirements. Disruption in global maritime corridors—exacerbated by mid-2026 geopolitical tensions and Caribbean supply shocks—directly threatens Brent crude stability. A sustained spike immediately widens India's current account deficit, compresses operating margins for downstream oil marketing companies (OMCs), and forces the RBI to delay anticipated rate cuts.

          Second, a sharp reversion in US technology equities would trigger global contagion. Because US tech carries outsized weight in global indices, a steep correction damages asset manager balance sheets globally. This mechanical de-risking forces passive foreign institutional outflows from emerging markets, stripping liquidity from Indian equities regardless of how strong domestic corporate earnings remain.

          Finally, persistent currency depreciation limits foreign capital entry. With the Indian Rupee testing historic lows near ₹90 to the US Dollar in 2026, dollar-adjusted returns for foreign investors erode. While central bank interventions smooth daily volatility, a structurally weaker rupee disincentivizes fresh Foreign Institutional Investor (FII) allocations, leaving the market entirely reliant on retail SIPs to absorb new equity issuance.

          FAQs about Recent Trends in Indian Stock Market

          What are the current trends in the Indian stock market?

          In mid-2026, the Indian stock market has shown a robust recovery supported by upbeat Q1 FY27 corporate earnings and easing crude oil prices. Benchmark indices like the Nifty 50 and Sensex have rebounded alongside a return of foreign institutional investor (FII) inflows. Sector-wise, financial and auto stocks have performed strongly, while technology shares have recently faced some profit-booking mirroring global tech corrections.

          Is the Indian stock market expected to rise?

          Yes, financial experts broadly expect the Indian stock market to continue its upward trajectory over the long term. Analysts forecast that strong corporate earnings growth and robust domestic consumption could push indices to new highs by the end of 2026. However, near-term growth may experience volatility due to fluctuating crude oil prices, inflation concerns, and global geopolitical uncertainties.

          What are the recent trends in the Indian capital market?

          The Indian capital market is currently being driven by a massive surge in domestic retail participation, particularly through mutual funds and Systematic Investment Plans (SIPs). There is also robust activity in the IPO market, which is now heavily supported by domestic liquidity rather than relying solely on foreign capital. Additionally, a growing number of recent initial public offerings are utilizing fresh issues to fund business expansion and debt reduction instead of just providing shareholder exits.

          Why is the Indian stock market falling?

          When recent market corrections have occurred, they were primarily triggered by escalating geopolitical tensions in the Middle East and resulting spikes in global crude oil prices. High inflation concerns and rising US bond yields have also prompted heavy selling by Foreign Institutional Investors (FIIs) at various points throughout the year. Furthermore, global sell-offs in AI and technology stocks have occasionally pressured domestic benchmarks that were trading at stretched valuations.

          Conclusion

          The resilience of Indian equities in 2026 underscores a historic maturation of the domestic investor base, which now actively neutralizes foreign capital flight. While global geopolitical tensions and elevated crude oil prices remain persistent threats to corporate margins, robust earnings growth in select sectors offers a clear runway for sustained momentum. Investors navigating this environment must prioritize strict bottom-up stock selection, balancing the structural advantages of domestic liquidity against the valuation premiums inherent in today's market.

          Risk Warnings and Disclaimers
          You understand and acknowledge that there is a high degree of risk involved in trading. Following any strategies or investment methods may lead to potential losses. The content on the site is provided by our contributors and analysts for information purposes only. You are solely responsible for determining whether any trading assets, securities, strategy, or any other product is suitable for investing based on your own investment objectives and financial situation.
          Add to Favorites
          Share
          FastBull
          Copyright © 2026 FastBull Ltd

          728 RM B 7/F GEE LOK IND BLDG NO 34 HUNG TO RD KWUN TONG KLN HONG KONG

          TelegramInstagramTwitterfacebooklinkedin
          App Store Google Play Android Windows
          Products
          Charts

          Chats

          Q&A with Experts
          Screeners
          Economic Calendar
          Data
          Tools
          Membership
          Features
          Function
          Markets
          Copy Trading
          Latest Signals
          Contests
          24/7
          Analysis
          Education
          Company
          Careers
          About Us
          Contact Us
          Advertising
          Download FastBull
          Help Center
          Feedback
          User Agreement
          Privacy Policy
          Personal Information Protection Statement
          Business

          White Label

          Broker API

          Data API

          Web Plug-ins

          Poster Maker

          Affiliate Program

          Risk Disclosure

          The risk of loss in trading financial instruments such as stocks, FX, commodities, futures, bonds, ETFs and crypto can be substantial. You may sustain a total loss of the funds that you deposit with your broker. Therefore, you should carefully consider whether such trading is suitable for you in light of your circumstances and financial resources.

          No decision to invest should be made without thoroughly conducting due diligence by yourself or consulting with your financial advisors. Our web content might not suit you since we don't know your financial conditions and investment needs. Our financial information might have latency or contain inaccuracy, so you should be fully responsible for any of your trading and investment decisions. The company will not be responsible for your capital loss.

          Without getting permission from the website, you are not allowed to copy the website's graphics, texts, or trademarks. Intellectual property rights in the content or data incorporated into this website belong to its providers and exchange merchants.

          Not Logged In

          Log in to access more features

          Connect Broker
          Become a signal provider
          Help Center
          Customer Service
          Dark Mode
          Price Up/Down Colors

          Log In

          Sign Up

          Position
          Layout
          Fullscreen
          Default to Chart
          The chart page opens by default when you visit fastbull.com