- USDX
- XAUUSD
- XAGUSD
- WTI


Markets
Analysis
User
24/7
Economic Calendar
Education
Data
- Names
- Latest
- Prev







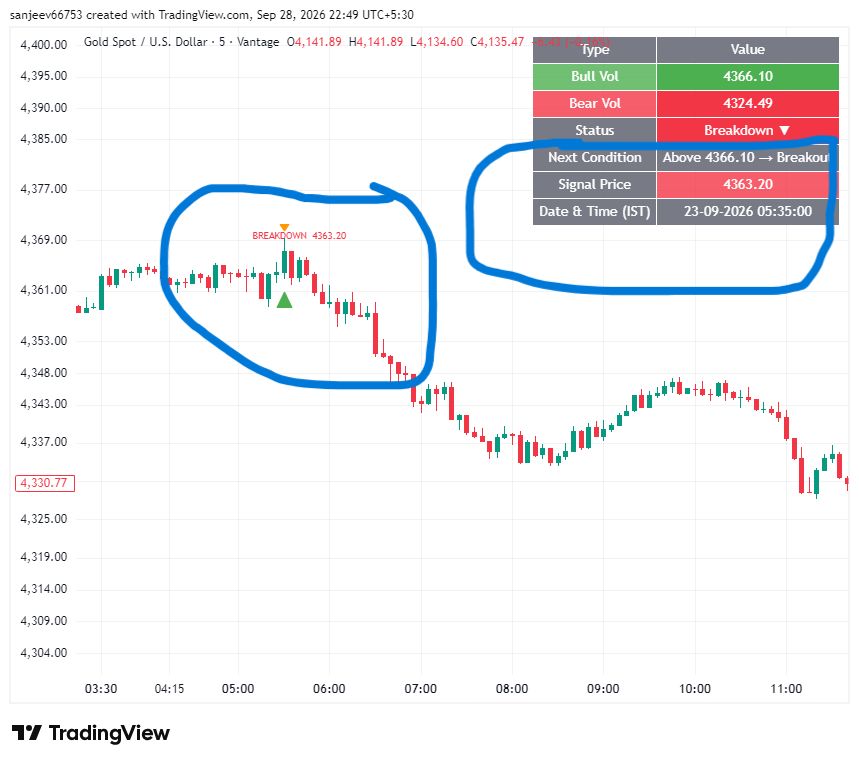
As central bank demand clashes with high interest rates, track gold futures live to see if the safe-haven asset is poised for a breakout or a retreat.
Tracking the continuous fluctuations of gold futures provides investors with a direct window into global economic sentiment, inflation expectations, and geopolitical stability. As macroeconomic pressures and central bank policies collide, understanding how to read these real-time price charts becomes critical for executing precise trades. This guide breaks down the underlying mechanics of current market valuations, explores the primary catalysts driving intraday volatility, and outlines actionable forecasts to help navigate the active trading environment.

Active month COMEX gold futures are currently trading at approximately $4,107.00 per troy ounce as of early August 2026. This valuation reflects a market digesting cooling inflation data alongside sustained central bank purchasing, which provides a rigid floor against further price erosion.
The front-month gold contract trades continuously on the CME Globex electronic exchange, hovering near the $4,107.00 level. Traders monitoring gold futures live track these real-time fluctuations to gauge macroeconomic sentiment, as the contract prices in global interest rate expectations tick-by-tick.
To pull the correct data feed, investors must use the exact gold futures symbol designated by their brokerage or charting platform. The standard CME Globex ticker is GC, though platforms like Yahoo Finance use GC=F, and TradingView aggregates the active front month under GC1!. Unlike a gold futures stock—such as a mining ETF or company equity, which carries operational and management risks—this contract represents a direct, leveraged claim on the physical metal.
Understanding the live quote requires knowing the exact contract parameters, as the nominal price only tells part of the story:
Current prices sit roughly 27% below the January 2026 all-time high of $5,608.35, actively consolidating just above the psychological $4,000 support level. This represents a violent mean reversion after a historic early-year rally driven by geopolitical risk premiums.
Pulling up a long-term gold futures price chart reveals extreme volatility over the past 52 weeks. The rapid expansion and subsequent contraction of the price was mechanically driven by shifting real yields and U.S. Federal Reserve monetary policy maneuvers.
| Metric | Price Level | Timeframe | Primary Market Driver |
|---|---|---|---|
| All-Time High | $5,608.35 | January 2026 | Severe geopolitical risk premiums and elevated options activity temporarily breaking the inverse correlation to real yields. |
| Current Active Month | $4,107.00 | August 2026 | Diminishing inflation fears and a stronger U.S. dollar forcing long liquidations. |
| 52-Week Low | $3,353.40 | Q3 2025 | Restrictive central bank policies pushing investors toward higher-yielding cash equivalents. |
The massive Q1 run-up occurred because institutional investors aggressively bought call options to hedge against a potential Middle Eastern conflict, forcing dealers to buy underlying futures to remain delta-neutral. Once ceasefire memorandums materialized and energy prices cooled, this geopolitical premium unwound rapidly.
Simultaneously, stronger-than-expected U.S. labor data in mid-2026 shifted the CME FedWatch Tool probabilities away from immediate rate cuts. Because gold yields no interest, higher sustained interest rates increase the opportunity cost of holding the metal. Any credible gold futures market forecast for the remainder of the year hinges on whether the Federal Reserve holds rates steady or resumes cuts, which would reduce real yields, weaken the dollar, and potentially drive the contract back toward the $4,500 threshold.
Tracking gold futures live reveals that contracts currently trade near the $4,107 per ounce level (consolidating within the broader $4,040 to $4,100 range based on the active GCQ26 and GCZ26 contracts), pinned between aggressive safe-haven buying and the heavy headwind of restrictive monetary policy. The primary catalysts dictating the intraday tape are fluctuations in the U.S. Dollar Index (DXY), the Federal Reserve's response to energy-driven inflation, and escalating military conflicts in the Middle East altering global energy shipments.
A rebounding U.S. dollar is currently applying downward pressure on gold futures by making dollar-denominated contracts more expensive for international buyers. Because the standard gold futures symbol (GC) is priced in USD, the two assets share a strict inverse relationship; when the DXY strengthens, foreign purchasing power drops, and physical demand for gold naturally contracts.
Recently, the dollar experienced severe volatility—including a sharp 2.4% single-day plunge—which temporarily pushed gold futures upward before institutional profit-taking set in. Right now, algorithmic trading desks are highly sensitive to the DXY's intraday movements. Every significant basis-point rally in the dollar typically shaves immediate premium off the active month gold contract, overriding broader structural demand. For analysts building a reliable gold futures market forecast, a sustained dollar recovery remains the single largest barrier to the asset testing the $4,200 resistance level.
Interest rate expectations are functioning as an absolute ceiling on gold prices, severely limiting upside breakouts. Because gold yields no interest or dividend, it must compete directly with the risk-free return of U.S. Treasuries. Following the Federal Reserve's recent 9-3 vote to hold the benchmark rate at 3.50%–3.75% under Chair Kevin Warsh, futures markets immediately began pricing in higher borrowing costs for longer.
Traders are currently managing their gold futures exposure based on the following rate-driven framework:
Geopolitical instability is creating a complex, dual-sided impact on gold futures, simultaneously providing a hard floor for prices while capping breakout rallies. Rather than acting as a simple upward catalyst, the ongoing US-Iran conflict in the Persian Gulf is moving gold through two competing mechanisms:
Reading a live gold futures price chart requires isolating the active front-month COMEX contract—typically denoted by the root gold futures symbol GC followed by the month and year codes (e.g., GCZ4 for December). Given the leverage inherent in the standard gold futures contract size, every tick movement magnifies the importance of precise technical levels and strict timeframe selection when analyzing price action.
Key levels on a gold chart represent specific price zones where institutional liquidity clusters, dictating where massive buy or sell orders will likely trigger. Identifying these zones shifts analysis from subjective pattern drawing to objective order flow tracking.
The optimal timeframe depends on whether a trader is capitalizing on immediate order flow or tracking swing setups driven by macroeconomic data releases. Gold futures trade nearly 24 hours a day on the CME Globex system, creating distinct liquidity and volatility profiles across different charting intervals.
| Trading Style | Chart Timeframe | Primary Use Case for Gold Futures | Session Focus |
|---|---|---|---|
| Scalping / Order Flow | 1-minute to 5-minute | Executing entries around macro data prints (e.g., CPI, Non-Farm Payrolls) or capturing sudden momentum shifts. | New York Regular Trading Hours (RTH) open (8:20 AM ET). |
| Day Trading | 15-minute to 1-hour | Identifying the session's prevailing direction, confirming VWAP adherence, and plotting daily support/resistance levels. | Peak liquidity overlap of London and New York sessions. |
| Swing Trading | 4-hour to Daily | Spotting structural breakouts, forecasting moving average crossovers, and setting multi-day gold futures market forecast targets. | Continuous Globex Electronic Trading Hours (ETH). |
A standard institutional approach utilizes multiple timeframe analysis: consulting the 4-hour chart to establish the dominant trend, the 15-minute chart to identify structural pullbacks, and the 5-minute chart to execute the entry. Short-term traders must also adjust their timeframe focus based on regional liquidity, relying heavily on lower intervals (1m-5m) during the high-volume US morning session while defaulting to hourly charts during the lighter volume of the Asian trading hours.
Applying these technical frameworks to the broader macro picture, investors tracking gold futures live can see the contract is currently consolidating in the $4,000 to $4,100 per ounce range, pinned between softening U.S. macroeconomic data and heavy technical resistance. Following a steep pullback from January 2026 record highs, the market's trajectory for the remainder of the year depends entirely on whether weakening economic growth forces the Federal Reserve into an accelerated rate-cutting cycle.
Institutional analysts maintain a structurally bullish gold futures market forecast into 2027, though many have aggressively revised their late-2026 targets downward to reflect persistent high interest rates. The consensus divergence centers on a core trade-off: the ongoing accumulation of physical bullion by central banks versus the opportunity cost of holding non-yielding futures while Treasury yields remain elevated.
| Financial Institution | Year-End 2026 Price Target | Primary Rationale |
|---|---|---|
| Bank of America | $6,000 / oz | Historically low investor allocations to gold ETFs and leadership uncertainty at the Federal Reserve. |
| J.P. Morgan | $6,300 / oz | Sustained central bank demand, anticipated ETF inflows, and a projected weaker U.S. dollar. |
| Morgan Stanley | $5,200 / oz | Target cut by 10% from $5,700, reflecting immediate macroeconomic headwinds and rate recalibrations. |
| HSBC | $4,750 / oz | Hawkish tilt in monetary policy suppressing near-term upside, with gold remaining highly sensitive to inflation prints. |
Despite near-term downgrades across major banks, 89% of central banks report plans to increase aggregate gold holdings over the next 12 months. This sovereign demand provides a firm fundamental floor against deeper institutional sell-offs in the derivatives market.
A current gold futures price chart reveals a classic volatility squeeze, with spot prices compressing significantly below long-term moving averages. The market is currently trapped in a narrow technical apex, characterized by three primary developments:
A decisive breakout from the current $200 trading range requires a shift in real yields or a structural shock to COMEX speculative positioning. Traders are weighing two specific macroeconomic catalysts that would trigger an expansion.
If macroeconomic data accelerates rate cuts, gold targets $4,400. Weaker-than-expected Q2 2026 GDP growth (1.5%) and softening Core PCE inflation (0.1% month-over-month) have already begun weakening the U.S. Dollar Index (DXY). If the Federal Reserve executes aggressive rate cuts in response, real yields will drop, neutralizing the penalty for holding zero-yield gold. A daily close above the $4,200 resistance invalidates the current bearish chart structure, exposing the next resistance band between $4,300 and $4,400.
If inflation proves sticky and yields spike, gold risks $3,500. If inflation re-accelerates and forces the Fed to hold rates higher for longer, capital will rapidly rotate out of precious metals and back into yield-bearing assets. Should COMEX futures register a daily close below the critical $3,900 floor, algorithmic selling is highly likely to trigger. The next major downside target rests at the 0.618 golden pocket near $3,550, a move that would effectively unwind the bulk of the early 2026 rally.
Trading gold futures requires translating real-time price action into calculated entries using COMEX contracts. Execution relies on matching the correct contract specifications to your capital constraints and aligning technical setups with macroeconomic drivers, specifically real interest rates and dollar strength.
The choice between the standard gold futures symbol (GC) and the Micro Gold contract (MGC) dictates your initial capital requirement and position-sizing flexibility. Both contracts track the same underlying physical gold on the COMEX exchange and expire on the same months, but their leverage profiles differ by a factor of ten.
| Specification | Standard Gold (GC) | Micro Gold (MGC) |
|---|---|---|
| Gold Futures Contract Size | 100 troy ounces | 10 troy ounces |
| Minimum Price Fluctuation (Tick) | $0.10 per ounce | $0.10 per ounce |
| Tick Value | $10.00 | $1.00 |
| 10-Point Move P&L ($10/oz) | $1,000 | $100 |
| Approx. Maintenance Margin | ~$9,000 | ~$900 |
Traders with account balances under $100,000 or those employing scale-in strategies should default to MGC. The $1 per tick value allows for wider stop placements and multi-contract scaling without breaching a strict 1% to 2% portfolio risk limit.
Conversely, institutional players and high-volume day traders use the GC contract. While GC requires significantly more margin, it offers unmatched top-of-book liquidity. This density ensures tighter bid-ask spreads and minimizes slippage on market orders during high-velocity price action, a trade-off retail traders miss when prioritizing the lower capital requirements of MGC.
A high-probability entry requires cross-referencing the gold futures live chart with macroeconomic indicators and real-time order flow. Do not execute a trade without evaluating these four variables:
Daily movements in the gold market are highly unpredictable, so whether the price will go up or down tomorrow cannot be verified. Short-term price changes depend on real-time factors such as geopolitical events, economic data releases, and shifting interest rate expectations.
Gold prices actually already tested the $5,000 per ounce threshold in early 2026 before experiencing a market pullback. Several major financial institutions maintain forecasts that gold could return to or exceed this level in the coming years, though future market prices cannot be guaranteed.
Institutional futures predictions for gold vary for the remainder of 2026 and into 2027. Some firms like J.P. Morgan have projected targets up to $6,300, while others like HSBC and Commerzbank recently revised their late-2026 targets down to the $4,500 to $4,800 range. These forecasts heavily depend on central bank buying habits, inflation metrics, and Federal Reserve interest rate decisions.
Spot gold is traded at the current market price for immediate settlement and delivery. In contrast, gold futures are standardized, exchange-traded contracts that obligate the parties to buy or sell a specific amount of gold at a predetermined price on a set future expiration date. Gold futures rates are also typically priced differently than spot gold to account for built-in financing and storage costs.
Navigating the gold futures market requires a strategic balance of technical chart analysis and macroeconomic awareness. By actively monitoring real yields, dollar strength, and geopolitical developments, traders can better anticipate the intricate pricing dynamics of COMEX contracts. Whether utilizing the standard or micro contract, maintaining strict risk management against these volatile catalysts remains essential for capitalizing on gold's long-term market forecasts.

728 RM B 7/F GEE LOK IND BLDG NO 34 HUNG TO RD KWUN TONG KLN HONG KONG





The risk of loss in trading financial instruments such as stocks, FX, commodities, futures, bonds, ETFs and crypto can be substantial. You may sustain a total loss of the funds that you deposit with your broker. Therefore, you should carefully consider whether such trading is suitable for you in light of your circumstances and financial resources.
No decision to invest should be made without thoroughly conducting due diligence by yourself or consulting with your financial advisors. Our web content might not suit you since we don't know your financial conditions and investment needs. Our financial information might have latency or contain inaccuracy, so you should be fully responsible for any of your trading and investment decisions. The company will not be responsible for your capital loss.
Without getting permission from the website, you are not allowed to copy the website's graphics, texts, or trademarks. Intellectual property rights in the content or data incorporated into this website belong to its providers and exchange merchants.
Not Logged In
Log in to access more features


Log In
Sign Up