• Trade
  • Markets
  • Copy
  • Contests
  • 24/7
  • Calendar
  • Q&A
  • Chats
Screeners
SYMBOL
LAST
BID
ASK
HIGH
LOW
NET CHG.
%CHG.
SPREAD
SOURCE
SPX
S&P 500 Index
7701.51
7701.51
7701.51
7724.16
7666.59
-41.90
-0.54%
--
--
DJI
Dow Jones Industrial Average
51612.92
51612.92
51612.92
51780.51
51409.66
-215.70
-0.42%
--
--
IXIC
NASDAQ Composite Index
26898.82
26898.82
26898.82
26990.02
26709.69
-169.89
-0.63%
--
--
USDX
US Dollar Index
100.810
100.810
100.890
101.000
100.670
+0.070
+ 0.07%
--
--
EURUSD
Euro / US Dollar
1.13763
1.13763
1.13772
1.13908
1.13520
-0.00128
-0.11%
--
--
GBPUSD
Pound Sterling / US Dollar
1.32669
1.32669
1.32682
1.32798
1.32202
+0.00250
+ 0.19%
--
--
XAUUSD
Gold / US Dollar
4136.99
4136.99
4137.42
4276.07
4110.71
-147.86
-3.45%
--
--
WTI
Light Sweet Crude Oil
91.434
91.434
91.464
94.999
89.991
+0.115
+ 0.13%
--
--

Community Accounts

Signal Accounts
--
Profit Accounts
--
Loss Accounts
--
View More

Become a signal provider

Sell trading signals to earn additional income

View More

Guide to Copy Trading

Get started with ease and confidence

View More

Signal Accounts for Members

All Signal Accounts

Best Return
  • Best Return
  • Best P/L
  • Best MDD
Past 1W
  • Past 1W
  • Past 1M
  • Past 1Y

All Contests

  • All
  • Recommend
  • Stocks
  • Cryptocurrencies
  • Central Banks
  • Trump Updates
  • Featured News
Top News Only
Share

Federal Reserve Governor Cook: The Number And Magnitude Of Future Interest Rate Adjustments Will Be Influenced By Inflation And Labor Market Data, As Well As The Economy’s Response To The Actions The Fed Has Taken So Far

Share

Federal Reserve Governor Cook: The Labor Market Is Ready For Interest Rate Hikes

Share

Federal Reserve Governor Cook: We Expect To Continue To Face Inflationary Pressures From Artificial Intelligence And The Middle East Conflict In The Coming Months

Share

Putin Signs A Presidential Decree; The Russian Military Is Being Expanded Once Again

Share

Russian President Vladimir Putin Met With Alexei Likhachev, CEO Of Rosatom

Share

Yemeni Military: Over The Past 24 Hours, We Conducted 356 Precision Strikes Against Legitimate Military Targets Of The Houthi Armed Group Across Various Fronts And Directions. According To Field Assessments, These Operations Resulted In The Elimination Of 476 Houthi Militants

Share

The Federal Reserve Accepted A Total Of $851 Million From Three Counterparties In Its Fixed-rate Reverse Repurchase Operations

Share

According To Saudi Media Outlet Alhadath, Sources Say That Mediators Are Pressuring Iran To Make Concessions On The Nuclear Issue

Share

According To Saudi Media Outlet Alhadath, Sources Say Iran Has Agreed To Halt Uranium Enrichment In Exchange For The Easing Of US Sanctions

Share

Both WTI And Brent Crude Oil Prices Fell By 1.00% During The Day, Currently Trading At $96.32 Per Barrel And $90.40 Per Barrel Respectively

Share

Houthi Rebels: In The Past 24 Hours, Saudi Warplanes Launched 38 Airstrikes And Missile Attacks, Using F-15 And Typhoon Fighter Jets That Took Off From Khamis Mushait And Taif Air Bases. Since The Escalation Of The Situation, The Total Number Of Saudi Airstrikes And Missile Attacks Has Reached 1,123

Share

The Mayor Of Kyiv Reported That A Non-residential Building In The Oblonsky District Was Attacked, And A Warehouse Building At Another Location Caught Fire

Share

According To Relevant Budget Documents, Russia Expects To Receive 200 Billion Rubles Annually From Windfall Profits Taxes Levied On Mining And Metal Companies Between 2027 And 2029

Share

Turkish President Erdogan: Measures Are Being Taken To Ensure That Similar Problems Do Not Happen Again

Share

Turkish President Erdogan: We Are Acting Very Cautiously, And The Fund Clearing Work Is Proceeding Seriously

Share

The European Union Failed To Reach An Agreement On Providing Ukraine With Additional Patriot Missiles

Share

Israeli Military Claims Strikes On Hezbollah Infrastructure In Southern Lebanon

Share

Turkish President Erdogan: We Are Taking All Necessary Measures Quickly

Share

Turkish President Erdogan: We Are Closely Monitoring The Dynamics Of The Capital Markets

Share

Turkish President Recep Tayyip Erdoğan: Anyone Who Tries To Harm The Rights Of The People Through Market Manipulation And Stock Market Games Will Find Themselves In Opposition To US

TIME
ACT
FCST
PREV
IMPACT
U.S. Weekly Treasuries Held by Foreign Central Banks

A:--

F: --

P: --

USDX
  • USDX
  • XAUUSD
  • XAGUSD
  • WTI
U.K. GfK Consumer Confidence Index (Sept)

A:--

F: --

P: --

GBPUSD
  • GBPUSD
  • XAUUSD
  • XAGUSD
  • WTI
Germany GfK Consumer Confidence Index (SA) (Oct)

A:--

F: --

P: --
EURUSD
  • EURUSD
  • XAUUSD
  • XAGUSD
  • WTI
  • USDX
Euro Zone 3-Month M3 Money Supply YoY (Aug)

A:--

F: --

P: --

EURUSD
  • EURUSD
  • XAUUSD
  • XAGUSD
  • WTI
  • USDX
Euro Zone M3 Money Supply YoY (Aug)

A:--

F: --

P: --

EURUSD
  • EURUSD
  • XAUUSD
  • XAGUSD
  • WTI
  • USDX
Euro Zone Private Sector Credit YoY (Aug)

A:--

F: --

P: --

EURUSD
  • EURUSD
  • XAUUSD
  • XAGUSD
  • WTI
  • USDX
New York Federal Reserve President Williams delivered a speech.
India Deposit Gowth YoY

A:--

F: --

P: --

XAUUSD
  • XAUUSD
  • XAGUSD
  • WTI
  • USDX
Mexico Unemployment Rate (Not SA) (Aug)

A:--

F: --

P: --

XAUUSD
  • XAUUSD
  • XAGUSD
  • WTI
  • USDX
U.S. Durable Goods Orders MoM (Aug)

A:--

F: --

P: --
USDX
  • USDX
  • XAUUSD
  • XAGUSD
  • WTI
U.S. Durable Goods Orders MoM (Excl.Transport) (Aug)

A:--

F: --

P: --
USDX
  • USDX
  • XAUUSD
  • XAGUSD
  • WTI
U.S. Non-Defense Capital Durable Goods Orders MoM (Excl. Aircraft) (Aug)

A:--

F: --

P: --
USDX
  • USDX
  • XAUUSD
  • XAGUSD
  • WTI
U.S. Durable Goods Orders MoM (Excl. Defense) (SA) (Aug)

A:--

F: --

P: --
USDX
  • USDX
  • XAUUSD
  • XAGUSD
  • WTI
U.S. UMich Current Economic Conditions Index Final (Sept)

A:--

F: --

P: --

USDX
  • USDX
  • XAUUSD
  • XAGUSD
  • WTI
U.S. UMich Consumer Expectations Index Final (Sept)

A:--

F: --

P: --

USDX
  • USDX
  • XAUUSD
  • XAGUSD
  • WTI
U.S. UMich Consumer Sentiment Index Final (Sept)

A:--

F: --

P: --

USDX
  • USDX
  • XAUUSD
  • XAGUSD
  • WTI
U.S. UMich 1-Year-Ahead Inflation Expectations Final (Sept)

A:--

F: --

P: --

USDX
  • USDX
  • XAUUSD
  • XAGUSD
  • WTI
Canada Federal Government Budget Balance (Jul)

A:--

F: --

P: --

USDCAD
  • USDCAD
  • XAUUSD
  • XAGUSD
  • WTI
  • USDX
U.S. Weekly Total Oil Rig Count

A:--

F: --

P: --

WTI
  • WTI
  • XAUUSD
  • XAGUSD
  • USDX
U.S. Weekly Total Rig Count

A:--

F: --

P: --

WTI
  • WTI
  • XAUUSD
  • XAGUSD
  • USDX
FOMC Member Hammack Speaks
China, Mainland Industrial Profit YoY (YTD) (Aug)

A:--

F: --

P: --

XAUUSD
  • XAUUSD
  • XAGUSD
  • WTI
  • USDX
India Manufacturing Output MoM (Aug)

A:--

F: --

P: --

XAUUSD
  • XAUUSD
  • XAGUSD
  • WTI
  • USDX
India Industrial Production Index YoY (Aug)

A:--

F: --

P: --

XAUUSD
  • XAUUSD
  • XAGUSD
  • WTI
  • USDX
Brazil Current Account (Aug)

A:--

F: --

P: --

XAUUSD
  • XAUUSD
  • XAGUSD
  • WTI
  • USDX
Mexico Trade Balance (Aug)

A:--

F: --

P: --

XAUUSD
  • XAUUSD
  • XAGUSD
  • WTI
  • USDX
Canada National Economic Confidence Index

A:--

F: --

P: --

USDCAD
  • USDCAD
  • XAUUSD
  • XAGUSD
  • WTI
  • USDX
ECB President Lagarde Speaks
U.S. Dallas Fed General Business Activity Index (Sept)

A:--

F: --

P: --

USDX
  • USDX
  • XAUUSD
  • XAGUSD
  • WTI
U.S. Dallas Fed New Orders Index (Sept)

A:--

F: --

P: --

USDX
  • USDX
  • XAUUSD
  • XAGUSD
  • WTI
Richmond Federal Reserve President Barkin delivered a speech.
U.K. BRC Shop Price Index YoY (Sept)

--

F: --

P: --

Australia Overnight (Borrowing) Key Rate

--

F: --

P: --

RBA Rate Statement
RBA Press Conference
Turkey Economic Sentiment Indicator (Sept)

--

F: --

P: --

U.K. M4 Money Supply YoY (Aug)

--

F: --

P: --

U.K. Mortgage Lending (Aug)

--

F: --

P: --

U.K. M4 Money Supply MoM (Aug)

--

F: --

P: --

U.K. Mortgage Approvals (Aug)

--

F: --

P: --

Euro Zone Consumer Confidence Index Final (Sept)

--

F: --

P: --

Euro Zone Services Sentiment Index (Sept)

--

F: --

P: --

Euro Zone Economic Sentiment Indicator (Sept)

--

F: --

P: --

Euro Zone Industrial Climate Index (Sept)

--

F: --

P: --

Italy PPI YoY (Aug)

--

F: --

P: --

Euro Zone Consumer Inflation Expectations (Sept)

--

F: --

P: --

Euro Zone Selling Price Expectations (Sept)

--

F: --

P: --

Italy 10-Year BTP Bond Auction Avg. Yield

--

F: --

P: --

Italy 5-Year BTP Bond Auction Avg. Yield

--

F: --

P: --

France Unemployment Class-A (Aug)

--

F: --

P: --

Brazil Unemployment Rate (Aug)

--

F: --

P: --

Canada GDP YoY (Jul)

--

F: --

P: --

Canada GDP MoM (SA) (Jul)

--

F: --

P: --

U.S. Weekly Redbook Index YoY

--

F: --

P: --

U.S. S&P/CS 20-City Home Price Index MoM (SA) (Jul)

--

F: --

P: --

U.S. S&P/CS 10-City Home Price Index MoM (Not SA) (Jul)

--

F: --

P: --

U.S. S&P/CS 10-City Home Price Index YoY (Jul)

--

F: --

P: --

U.S. FHFA House Price Index YoY (Jul)

--

F: --

P: --

U.S. FHFA House Price Index (Jul)

--

F: --

P: --

U.S. S&P/CS 20-City Home Price Index YoY (Not SA) (Jul)

--

F: --

P: --

U.S. FHFA House Price Index MoM (Jul)

--

F: --

P: --

Q&A with Experts
    • All
    • Chatrooms
    • Groups
    • Friends
    SlowBear ⛅ flag
    SlowBear ⛅
    @zenko Alright bro, i will soon go and eat too, did you see Nawhdir today?
    @zenko if you see Nawhdir in mosque tell him, SlowBear ask after him!
    Osaghae Cephas flag
    SlowBear ⛅
    @sanjeevThis is why anyone that rushed into buying gold always become a liquidity
    @SlowBear ⛅I know right😆
    sanjeev flag
    SlowBear ⛅
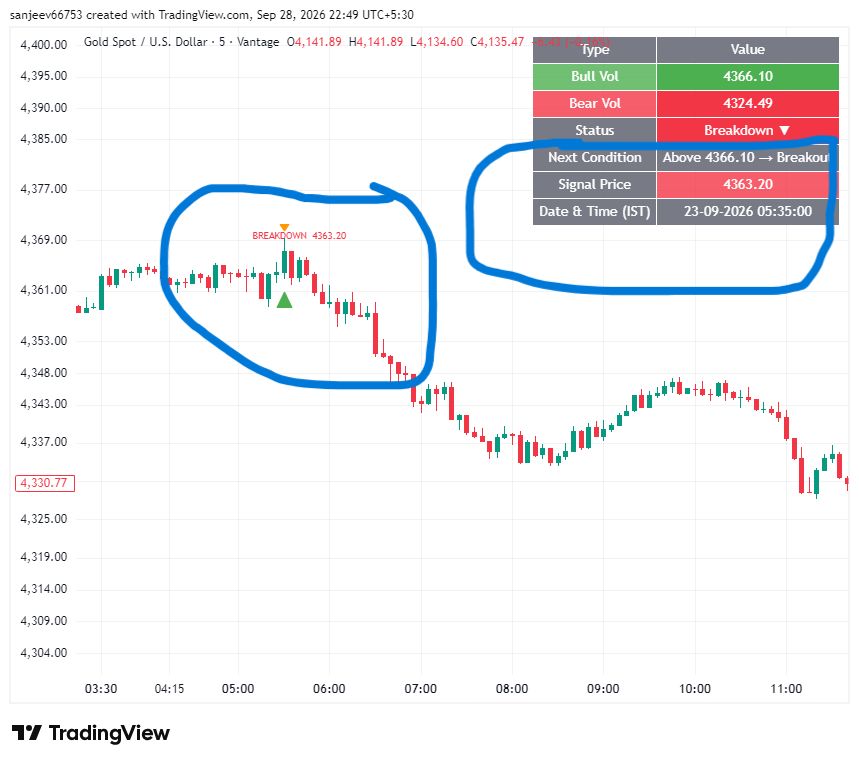
    @sanjeev i mean it has never been more clear, since gold broke below 4220 it is strait sell, simple as that
    @SlowBear ⛅ yeh bro, but for me breakdown came at 4324 as also shared in group the breakdown level
    Osaghae Cephas flag
    SlowBear ⛅
    @zenko NFP would be the right catalyst to drive gold higher and that will be if the data came unfavorable to the US dollar
    @SlowBear ⛅ohh looking forward to NFP
    Osaghae Cephas flag
    SlowBear ⛅
    @zenko if you see Nawhdir in mosque tell him, SlowBear ask after him!
    @SlowBear ⛅would u be trading gold that day if the data are released early?
    SlowBear ⛅ flag
    Osaghae Cephas
    @SlowBear ⛅I know right😆
    @Osaghae CephasLol, i see this is why you stepped away from gold buy early if you gad not, you would have become the market meal
    SlowBear ⛅ flag
    sanjeev
    @SlowBear ⛅ yeh bro, but for me breakdown came at 4324 as also shared in group the breakdown level
    @sanjeevOh for sure, the structre started at 4324 - 4330 then it proceeds, i have been folowing your calls
    Osaghae Cephas flag
    SlowBear ⛅
    @Osaghae CephasLol, i see this is why you stepped away from gold buy early if you gad not, you would have become the market meal
    @SlowBear ⛅haha after my fav btc USD gave me a loss of 40$ after giving me 45$ profit I wondered what gold would have done too me so I avoided it
    SlowBear ⛅ flag
    sanjeev
    @SlowBear ⛅ yeh bro, but for me breakdown came at 4324 as also shared in group the breakdown level
    @sanjeevBut, last week you were rather bulish though, however you are a trader who follow the market as it flows so no point in marrying a particular bias
    SlowBear ⛅ flag
    Osaghae Cephas
    @SlowBear ⛅ohh looking forward to NFP
    @Osaghae Cephas Same here bro, i cannot wait for the NFP to come in and we get another round of data
    SlowBear ⛅ flag
    Osaghae Cephas
    @SlowBear ⛅would u be trading gold that day if the data are released early?
    @Osaghae Cephas You know me bro, i rather just wait than get myself into the drama that coems with the data releases
    SlowBear ⛅ flag
    SlowBear ⛅
    @Osaghae Cephas You know me bro, i rather just wait than get myself into the drama that coems with the data releases
    @Osaghae Cephas So i will rather wait till the data is released before i start engaging
    SlowBear ⛅ flag
    Osaghae Cephas
    @SlowBear ⛅haha after my fav btc USD gave me a loss of 40$ after giving me 45$ profit I wondered what gold would have done too me so I avoided it
    @Osaghae Cephas Well i guess we would never kmow but still its is a good decision afterall
    Osaghae Cephas flag
    SlowBear ⛅
    @Osaghae Cephas Same here bro, i cannot wait for the NFP to come in and we get another round of data
    @SlowBear ⛅yh
    Osaghae Cephas flag
    SlowBear ⛅
    @Osaghae Cephas You know me bro, i rather just wait than get myself into the drama that coems with the data releases
    @SlowBear ⛅ohh I understand
    SlowBear ⛅ flag
    Osaghae Cephas
    @SlowBear ⛅yh
    @Osaghae Cephas And how is the GBPUSD playing out now? you see the difference the fx market is pretty slow
    SlowBear ⛅ flag
    Osaghae Cephas
    @SlowBear ⛅ohh I understand
    @Osaghae Cephas Cool, this has really worked for me long term
    sanjeev flag
    Osaghae Cephas flag
    SlowBear ⛅
    @Osaghae Cephas Well i guess we would never kmow but still its is a good decision afterall
    @SlowBear ⛅yh
    Osaghae Cephas flag
    SlowBear ⛅
    @Osaghae Cephas And how is the GBPUSD playing out now? you see the difference the fx market is pretty slow
    @SlowBear ⛅yes
    Type here...
    Add Symbol or Code

      No matching data

      All
      Recommend
      Stocks
      Cryptocurrencies
      Central Banks
      Trump Updates
      Featured News
      • All
      • Russia-Ukraine Conflict
      • Middle East Flashpoint
      • All
      • Russia-Ukraine Conflict
      • Middle East Flashpoint
      Search
      Products

      Charts Free Forever

      Chats Q&A with Experts
      Screeners Economic Calendar Data Tools
      Membership Features
      Data Warehouse Market Trends Institutional Data Policy Rates Macro

      Market Trends

      Market Sentiment Order Book Forex Correlations

      Top Indicators

      Charts Free Forever
      Markets

      News

      24/7 Analysis Education

      Latest Views

      Latest Update

      Signals

      Copy Rankings Latest Signals Become a signal provider AI Rating
      Contests
      Brokers

      Overview Brokers Assessment Rankings Regulators News Claims
      Broker listing Forex Brokers Comparison Tool Live Spread Comparison Scam
      Q&A Complaint Scam Alert Videos Tips to Detect Scam
      More

      Business
      Events
      Careers About Us Advertising Help Center

      White Label

      Broker API

      Data API

      Web Plug-ins

      Affiliate Program

      Awards Institution Evaluation IB Seminar Salon Event Exhibition
      Vietnam Thailand Singapore Dubai
      Fans Party Investment Sharing Session
      FastBull Summit BrokersView Expo
      Recent Searches
        Top Searches
          Markets
          Analysis
          User
          24/7
          Economic Calendar
          Education
          Data
          • Names
          • Latest
          • Prev

          View All

          No data

          Scan to Download

          Faster Charts, Chat Faster!

          Download
          English
          • English
          • Español
          • العربية
          • Bahasa Indonesia
          • Bahasa Melayu
          • Tiếng Việt
          • ภาษาไทย
          • Français
          • Italiano
          • Türkçe
          • Русский язык
          • 简中
          • 繁中
          Open Account
          Search
          Products
          Charts Free Forever
          Markets
          News
          Signals

          Copy Rankings Latest Signals Become a signal provider AI Rating
          Contests
          Brokers

          Overview Brokers Assessment Rankings Regulators News Claims
          Broker listing Forex Brokers Comparison Tool Live Spread Comparison Scam
          Q&A Complaint Scam Alert Videos Tips to Detect Scam
          More

          Business
          Events
          Careers About Us Advertising Help Center

          White Label

          Broker API

          Data API

          Web Plug-ins

          Affiliate Program

          Awards Institution Evaluation IB Seminar Salon Event Exhibition
          Vietnam Thailand Singapore Dubai
          Fans Party Investment Sharing Session
          FastBull Summit BrokersView Expo

          Best Treasury Bond ETFs for 2026: Highest Yields & Lowest Fees

          FastBull
          Summary:

          With yields near 4.75%, the right treasury bond etf offers lucrative tax-exempt income. But navigating the shifted yield curve requires balancing key risks.

          As benchmark 10-year yields float near 4.75% in mid-2026, Treasury bond ETFs offer an exceptionally attractive blend of liquid income and state-tax-exempt returns. While locking in these multi-year highs is a priority for many income-focused investors, navigating the dramatically shifted yield curve requires matching specific fund durations to exact time horizons. From ultra-short cash alternatives to long-dated macroeconomic plays, identifying the right fund involves balancing interest rate sensitivity against structural management fees. This guide breaks down the highest-yielding and lowest-cost government bond funds available, providing a clear roadmap to optimize your fixed-income portfolio for current Federal Reserve policy.
          Best Treasury Bond ETFs for 2026: Highest Yields & Lowest Fees

          What Makes a Treasury Bond ETF Worth Buying in 2026?

          Treasury bond ETFs provide liquid, state-tax-exempt exposure to a yield curve that has shifted dramatically, with benchmark 10-year yields floating near 4.75% in mid-2026. Unlike locking up capital in direct Treasury purchases or brokered CDs, an ETF allows investors to instantly trade in and out of specific maturity targets without minimum holding periods as Federal Reserve policy evolves.

          How Rising or Falling Rates Are Affecting Treasury ETF Returns Right Now

          Bond prices move inversely to interest rates, and the exact price impact on a specific fund is dictated by its effective duration. With the Federal Reserve holding the federal funds rate near 3.6% throughout the summer of 2026, short-duration funds act strictly as stable yield vehicles, while longer-duration funds function as high-stakes bets on future rate adjustments.

          The mechanism is mathematical: a bond fund’s duration roughly equals the percentage its price will fall if interest rates rise by 1%, or rise if rates fall by 1%. If inflation surprises to the upside and forces rates higher, long-dated funds will suffer immediate principal losses that wipe out months of coupon payments. Conversely, if economic stagnation forces rate cuts, those same long-duration funds will see aggressive price appreciation.

          Strategy GoalExample FundAverage DurationExpected Price Impact per 1% Rate Move
          Cash AlternativeiShares 0-3 Month Treasury Bond ETF SGOV~0.1 years±0.1%
          Short-Term IncomeiShares 1-3 Year Treasury Bond ETF SHY~1.9 years±1.9%
          Intermediate BalanceiShares 7-10 Year Treasury Bond ETF (IEF)~7.5 years±7.5%
          Rate-Cut SpeculationVanguard Long-Term Treasury ETF (VGLT)~15.2 years±15.2%

          Investors seeking to completely isolate their returns from interest rate volatility use ultra-short funds, tracking the overnight rate with virtually zero price fluctuation. Those trying to lock in current multi-year yields must accept the interim capital volatility of a 7-to-10 year or 20+ year ETF.

          Why Yield and Fee Together Determine Your Real Return

          Because U.S. government debt is a homogenous asset class, a fund's expense ratio is the single biggest performance differentiator among ETFs targeting the same maturity band. A Treasury bill held by Vanguard is identical to a Treasury bill held by State Street; therefore, any difference in management cost directly reduces the investor's net payout.

          To compare funds accurately, rely on the SEC 30-Day Yield, a standardized metric that deducts the fund's expense ratio from the income generated over the past month. A fund advertising a higher gross distribution but charging a 0.15% management fee will systematically underperform a peer charging 0.03% if they hold the exact same bonds.

          • Expense Ratios: The most cost-efficient options, such as the widely held Vanguard Treasury ETF list of products and Schwab’s SCHR, charge just 0.03%. Niche or actively managed fixed-income products often charge 0.15% to 0.35%, creating a yield drag that compounding makes mathematically difficult to overcome.
          • Tax Treatment: The interest paid by Treasury bond ETFs is exempt from state and local income taxes, unlike corporate bond ETFs or most high-yield bank accounts. For an investor in high-tax jurisdictions, a 4.78% net yield on a Treasury ETF often generates more take-home income than a 5.2% yield on a fully taxable instrument.
          • Yield Curve Reality: In 2026, the specific maturity determines the baseline yield. Searching for the "highest yield" without checking duration forces you to take on unintended risk. Selecting the best Vanguard Treasury ETF or iShares equivalent requires matching your exact time horizon to the fund's maturity, then finding the cheapest provider in that specific bracket.

          Which Treasury Bond ETFs Have the Highest Yields in 2026?

          When scanning the market for maximum income, long-term funds like the iShares 20+ Year Treasury Bond ETF (TLT) currently deliver the highest absolute yields at over 5.1%, driven by a normalized 2026 yield curve where investors are compensated with a higher term premium for holding longer-dated debt. However, yield cannot be evaluated in a vacuum; it must be weighed against duration, the key measure of a bond fund's sensitivity to interest rate changes. Chasing the highest payout without checking the fund's duration exposes your principal to severe interest rate risk.

          ETF NameTicker30-Day SEC YieldEffective DurationExpense Ratio
          iShares 20+ Year Treasury BondTLT~5.14%16.0 years0.15%
          iShares 7-10 Year Treasury BondIEF~4.43%7.5 years0.15%
          Vanguard Intermediate-Term TreasuryVGIT~4.38%5.2 years0.03%
          iShares 1-3 Year Treasury BondSHY~3.66%1.9 years0.15%
          iShares 0-3 Month Treasury BondSGOV~3.57%0.1 years0.09%

          Note: 30-Day SEC Yields reflect mid-2026 market data and fluctuate based on daily bond pricing.

          Short-Term Treasury ETFs: High Yields With Less Rate Risk

          The iShares 0-3 Month Treasury Bond ETF (SGOV) and the iShares 1-3 Year Treasury Bond ETF (SHY) offer 2026 yields between 3.5% and 3.7% with near-zero interest rate risk. These funds operate at the safest end of the yield curve and are designed strictly for capital preservation and liquidity.

          The mechanism protecting your capital is ultra-low duration. SGOV carries an effective duration of just 0.1 years, while SHY sits at 1.9 years. This means if interest rates suddenly jump by 100 basis points (1%), SGOV's share price will drop by a mathematically negligible 0.1%, keeping your principal fully intact.

          The primary trade-off at the short end of the curve is reinvestment risk. Because these ETFs constantly roll over maturing cash-equivalent bills, their yields are directly tethered to the federal funds rate. If the Federal Reserve cuts rates further, the dividend yield on these funds will drop almost instantly. Investors looking to minimize costs can also utilize the Vanguard Short-Term Treasury ETF (VGSH), which provides comparable 1-3 year exposure with a category-low 0.04% expense ratio.

          Intermediate-Term Treasury ETFs: Balancing Yield and Stability

          The Vanguard Intermediate-Term Treasury ETF (VGIT) and the iShares 7-10 Year Treasury Bond ETF (IEF) deliver yields around 4.3% to 4.4%, successfully balancing income generation with moderate price stability. These funds capture the middle of the yield curve, offering higher payouts than cash equivalents without the aggressive volatility of long bonds.

          This category is built for core portfolio allocation rather than tactical macroeconomic bets. VGIT holds Treasuries maturing in 3 to 10 years, resulting in a duration of roughly 5.2 years. IEF pushes slightly further out on the curve with a 7.5-year duration. The risk math here is straightforward: a 1% rise in prevailing interest rates will knock roughly 7.5% off IEF's share price. You accept these moderate price fluctuations to lock in a yield that will not instantly evaporate when the Fed adjusts overnight lending rates.

          Cost drag is a critical factor in intermediate bonds. VGIT’s 0.03% expense ratio significantly undercuts IEF’s 0.15% fee, allowing Vanguard investors to keep an extra 12 basis points of yield annually for nearly identical structural exposure.

          Long-Term Treasury ETFs: Maximum Yield but Higher Volatility

          The iShares 20+ Year Treasury Bond ETF (TLT) and the Vanguard Long-Term Treasury ETF (VGLT) provide the maximum available Treasury yields at 5.1% or higher, but they embed aggressive interest rate risk that behaves more like equity volatility.

          TLT holds long-dated government debt maturing beyond 20 years, creating an effective duration of approximately 15.5 to 16.5 years. If long-term Treasury yields rise by a single percentage point, TLT's net asset value will plummet by roughly 15% to 16%. This is an instant capital loss that wipes out three full years of the fund's dividend income. Conversely, if economic growth stalls and long-term rates drop, these ETFs will post double-digit capital gains on top of their high base yields.

          Buyers of long-term Treasury bond ETFs must recognize a hard reality: you are executing a macroeconomic trade on future rate expectations. Pure income investors who mistakenly treat TLT as a high-yield savings vehicle routinely suffer severe principal losses when the term premium expands.

          Which Treasury Bond ETFs Charge the Lowest Fees?

          While navigating interest rate risk is crucial for protecting your principal, minimizing expense ratios is equally vital for maximizing your actual take-home yield. The lowest fee Treasury bond ETFs currently charge an expense ratio of 0.03% (or 3 basis points) annually. For investors seeking a Treasury bond ETF with the lowest expense ratio, this rock-bottom pricing tier is heavily dominated by Vanguard, Schwab, and State Street's SPDR Portfolio lineup, which collectively set the standard for cost-efficient government debt exposure.

          How Much Does an Expense Ratio Actually Cost You Over Time?

          A 0.03% expense ratio costs exactly $3 annually per $10,000 invested, which compounds to just over $350 in total drag on a $100,000 portfolio over a ten-year horizon. Because Treasury bonds offer identical underlying yields across providers, management fees act as a direct, one-to-one reduction of your total return.

          Consider a $100,000 portfolio yielding a steady 4.5% before fees over 10 years. If you hold a competitively priced fund at 0.03%, your net yield is 4.47%, and the balance grows to $154,851. If you instead opt for a legacy fund charging 0.15%—such as the iShares 1-3 Year Treasury Bond ETF (SHY)—your net yield drops to 4.35%, leaving you with $153,086. The $1,765 difference is the literal cost of ignoring a 12-basis-point gap over a decade.

          While institutional investors negotiate over single basis points, retail investors should apply a simple threshold rule: any core Treasury ETF charging above 0.05% must justify its premium through superior liquidity, a highly specific duration target, or reduced bid-ask spreads. If it cannot, you are simply subsidizing the fund issuer.

          The Cheapest Treasury ETFs and What You Give Up for the Low Price

          The absolute cheapest Treasury ETFs are priced at 0.03%, but hunting exclusively for the lowest expense ratio occasionally means giving up razor-thin bid-ask spreads or highly targeted maturity exposures. When choosing an ultra-low-cost fund, you are generally trading away the sheer daily trading volume found in slightly more expensive, heavily institutional legacy funds.

          ETF TickerFund NameExpense RatioSegment Focus
          VGLTVanguard Long-Term Treasury ETF0.03%10+ Years
          VGSHVanguard Short-Term Treasury ETF0.03%1–3 Years
          SCHOSchwab Short-Term U.S. Treasury ETF0.03%1–3 Years
          GOVTiShares U.S. Treasury Bond ETF0.05%Broad Market (All Maturities)
          SGOViShares 0-3 Month Treasury Bond ETF0.09%0–3 Months
          IEFiShares 7-10 Year Treasury Bond ETF0.15%7–10 Years

          When analyzing any Vanguard Treasury ETF list, you will find uniformly low 0.03% fees, making funds like the Vanguard Long-Term Treasury ETF (VGLT) a highly efficient choice for long-duration exposure. Many analysts consider VGLT the best Vanguard Treasury ETF for capturing price appreciation during rate-cutting cycles.

          However, price is not the only cost. Investors opting for the cheapest funds must weigh three specific trade-offs:

          • Execution Costs (Bid-Ask Spreads): While the iShares 0-3 Month Treasury Bond ETF (SGOV) charges 0.09%—triple the cost of Vanguard equivalents—it trades tens of millions of shares daily with a median spread of exactly 0.01%. If you are a tactical trader moving in and out of cash positions, the lower spread on a higher-fee fund often overrides the expense ratio savings.
          • Targeted vs. Broad Exposure: To get rock-bottom fees, you often have to accept broad maturity bands. If you require pinpoint exposure to the belly of the yield curve for a specific liability matching strategy, you might have to pay 0.15% for the iShares 7-10 Year Treasury Bond ETF (IEF), which isolates a tighter maturity window than cheaper intermediate alternatives.
          • Securities Lending Risk: To offset low fees and boost yield, some ETF providers lend out underlying bonds to short sellers. While Treasury collateral is inherently safe, this mechanism introduces a fractional degree of counterparty risk that purists seeking absolute risk-free returns may prefer to avoid.

          How Do the Best Treasury Bond ETFs Stack Up Against Each Other?

          The choice between top Treasury bond ETFs comes down to where you want to position yourself on the yield curve and whether you prioritize rock-bottom expense ratios or institutional-grade trading liquidity. Vanguard dominates on cost, while iShares offers the deepest options markets and tightest bid-ask spreads for active traders.

          Head-to-Head: Yield, Duration, Expense Ratio, and Liquidity

          As of August 2026, the Treasury bond ETFs with the highest yields sit at the long end of the maturity curve paying over 5.1%, but they carry immense interest rate sensitivity, whereas ultrashort funds sit in the mid-to-upper 3% range with virtually zero price volatility.

          TickerMaturity SegmentTarget Duration30-Day SEC YieldExpense RatioAUM
          SGOVUltrashort (0-3 Mos)0.1 years3.57%0.09%~$100B
          VGSHShort (1-3 Years)1.9 years4.23%0.03%~$30B
          SHYShort (1-3 Years)1.9 years4.10%0.15%~$25B
          VGITIntermediate (3-10 Yrs)4.9 years4.35%0.03%~$42B
          IEFIntermediate (7-10 Yrs)7.4 years4.43%0.15%~$47B
          VGLTLong-Term (10+ Yrs)13.5 years5.11%0.03%~$10B
          TLTLong-Term (20+ Yrs)15.4 years5.14%0.15%~$41B

          (Note: Yields and AUM reflect August 2026 market conditions and will fluctuate based on Federal Reserve policy.)

          For buy-and-hold retail investors, the Vanguard Treasury ETF list (VGSH, VGIT, VGLT) holds a distinct structural advantage. Vanguard charges just 3 basis points across the curve, saving 12 basis points annually compared to the equivalent iShares funds like the iShares 1-3 Year Treasury Bond ETF (SHY) or IEF.

          However, institutional scale and trading volume heavily favor iShares. TLT, for instance, trades tens of millions of shares daily with a robust options market, making it the default vehicle for macro traders betting on long-end rate shifts. The yield premium on these long-duration funds currently looks attractive at >5.1%, but duration mechanics demand strict risk management. As previously noted, with TLT's duration near 15.4 years, a 100-basis-point increase in long-term rates will erase roughly 15% of the fund's capital value, instantly neutralizing three years of yield.

          Conversely, the iShares 0-3 Month Treasury Bond ETF (SGOV) functions as a highly liquid cash equivalent. It holds Treasury bills to maturity, rolling them over constantly. The ~3.57% SEC yield carries practically zero duration risk, making it the purest capital preservation tool among nominal Treasury ETFs.

          Are Niche Treasury ETFs Like TIPS or Floating Rate Worth Considering?

          Treasury Inflation-Protected Securities (TIPS) and floating-rate notes serve entirely different macroeconomic functions than standard fixed-coupon bonds, acting as targeted hedges against unexpected inflation and volatile short-term rates.

          If you are stepping outside standard nominal Treasuries, the decision rests on which specific risk you want to eliminate:

          • Floating Rate ETFs (e.g., USFR, TFLO): The WisdomTree Floating Rate Treasury Fund (USFR) tracks notes whose coupons reset weekly based on the most recent 13-week Treasury Bill auction. Because the rate adjusts constantly, USFR carries an effective duration of just 0.02 years. It currently generates an embedded income yield around 3.9%. The trade-off: While you eliminate price sensitivity to rising rates, you forfeit reinvestment protection. If the Federal Reserve cuts rates, USFR's yield will drop almost immediately, whereas intermediate nominal bonds would lock in the higher rate.
          • TIPS ETFs (e.g., VTIP, TIP): Funds like the Vanguard Short-Term Inflation-Protected Securities ETF (VTIP) adjust their underlying principal value based on changes in the Consumer Price Index (CPI). The stated 30-day SEC yield for VTIP often appears artificially low (frequently between 1% and 2%) because it represents the "real" yield before the inflation adjustment is applied. The trade-off: TIPS only outperform nominal Treasuries if actual inflation exceeds the bond market's embedded "breakeven" expectation. Furthermore, long-duration TIPS funds still carry heavy interest rate risk. If rates rise without a proportional jump in inflation, long TIPS will lose capital value. For this reason, short-term TIPS funds (like VTIP, with a 2.3-year duration) are generally superior to long-term TIPS for pure inflation hedging.

          Which Treasury Bond ETF Should You Choose for Your Situation?

          Selecting a Treasury bond ETF requires matching the fund's duration to your time horizon and aligning its tax characteristics with your account type. Because all pure U.S. Treasury funds carry zero default risk, interest rate sensitivity and asset location are the primary drivers of your net return.

          Short-Term Holding vs. Long-Term Income: Does Your Timeline Change the Pick?

          Your investment timeline dictates the maximum duration you should accept, as longer-duration ETFs experience severe price swings when interest rates change. As established, duration dictates your price sensitivity to interest rate movements—meaning for every 1% increase in prevailing rates, a fund loses approximately its duration in percentage terms.

          If you are parking cash for a down payment over six months, a long-term fund exposing your principal to double-digit price declines is the wrong tool. Conversely, if you are hedging against an equity market crash or locking in yields for a 20-year retirement horizon, short-term funds will expose you to reinvestment risk when rates eventually fall.

          When reviewing a Vanguard Treasury ETF list—or offerings from iShares and State Street—the "best" Vanguard Treasury ETF or BlackRock equivalent depends entirely on matching these duration brackets to your exit date:

          Maturity BracketTarget DurationCommon TickersRate Sensitivity (Per 1% Rate Move)Primary Strategy & Use Case
          Ultra-Short (0-1 Yr)< 0.5 YearsSGOV (iShares 0-3 Month Treasury Bond ETF SGOV)Minimal (< 0.5% price change)Cash equivalent. Principal protection for funds needed within 12 months.
          Short (1-3 Yrs)1.5 - 2 YearsSHY (iShares 1-3 Year Treasury Bond ETF SHY)Low (~1.8% price change)Slightly higher historical yield curve capture for 1-3 year holding periods.
          Intermediate (7-10 Yrs)7 - 8 YearsIEF (iShares 7-10 Year Treasury Bond ETF)Moderate (~7.5% price change)Core portfolio holding. Balances yield generation with moderate equity hedging.
          Long-Term (10-30 Yrs)15 - 17 YearsVGLT (Vanguard Long-Term Treasury ETF), TLTHigh (~16% price change)Aggressive equity hedging, speculation on rate cuts, or matching distant liabilities.

          Taxable Account vs. IRA: Does Where You Hold It Affect the Best Choice?

          Holding Treasury ETFs in a taxable account rather than an IRA maximizes their primary structural advantage: exemption from state and local income taxes.

          The monthly dividends paid by Treasury bond ETFs are classified as U.S. government interest. Under federal tax treatment, this income is taxed at your ordinary federal income rate but is completely exempt from state and local taxes. Most states require a fund to hold at least 50% of its assets in U.S. government obligations at the end of each quarter to pass through this exemption—a threshold pure Treasury funds easily clear.

          This creates a sharp divergence in optimal asset location:

          • In a Taxable Account: Treasury ETFs offer a distinct after-tax yield advantage over corporate bonds, particularly for investors residing in high-tax states like California, New York, or New Jersey. The higher your state income tax bracket, the more valuable the Treasury ETF tax treatment becomes.
          • In a Traditional or Roth IRA: All distributions are already tax-deferred or tax-free. Placing a Treasury ETF inside an IRA wastes its state-level tax shield. Investors optimizing their portfolios typically place fully taxable, higher-yielding assets—such as corporate bond ETFs or broad aggregate funds—inside their IRAs, reserving Treasury ETFs for their taxable brokerage accounts.

          Note that this state tax exemption applies only to the monthly interest distributions. If you sell a Treasury ETF for a profit, the resulting capital gains are fully taxable at both the federal and state levels, regardless of account type.

          FAQs About Treasury Bond ETFs

          What is the best US treasury bond ETF?

          Because the "best" fund depends on an investor's specific financial goals and risk tolerance, there is no single best US Treasury bond ETF. However, the iShares 0-3 Month Treasury Bond ETF (SGOV) is currently the largest on the market, managing approximately $96 billion in assets. Another popular choice is the iShares 20+ Year Treasury Bond ETF (TLT), which holds nearly $50 billion in assets under management and focuses on longer-term government debt.

          Do Treasury bond ETFs pay dividends?

          Yes, Treasury bond ETFs pay dividends to their investors. These dividend distributions are funded by the regular interest payments collected from the underlying government bonds held by the fund. Most Treasury bond ETFs pay these dividends out to shareholders on a monthly schedule.

          Does Vanguard have a treasury bond ETF?

          Yes, Vanguard offers several Treasury bond ETFs that target different maturity lengths. Options include the Vanguard Short-Term Treasury ETF (VGSH), the Vanguard Intermediate-Term Treasury ETF (VGIT), and the Vanguard Long-Term Treasury ETF (VGLT). These passively managed index funds allow investors to easily gain exposure to US government debt at varying points on the yield curve.

          What is a treasury bond ETF?

          A Treasury bond ETF is an exchange-traded fund that invests exclusively in government-issued debt securities. These funds allow investors to gain diversified exposure to the government bond market without having to purchase and manage individual bonds themselves. Like regular stocks, Treasury bond ETFs can be easily bought and sold on standard stock exchanges during normal trading hours.

          Conclusion

          Treasury bond ETFs offer an efficient way to capture the elevated yields of the 2026 macroeconomic environment while maintaining deep liquidity and state tax advantages. Maximizing return in this space requires more than just chasing the highest advertised distribution; it demands a precise alignment of fund duration with an exact investment timeline to mitigate interest rate volatility. By selecting ultra-low-cost providers and housing these assets strategically in taxable brokerage accounts, investors can successfully optimize their net, after-tax income. A properly positioned government debt allocation effectively balances competitive yield generation with strict principal protection.

          Risk Warnings and Disclaimers
          You understand and acknowledge that there is a high degree of risk involved in trading. Following any strategies or investment methods may lead to potential losses. The content on the site is provided by our contributors and analysts for information purposes only. You are solely responsible for determining whether any trading assets, securities, strategy, or any other product is suitable for investing based on your own investment objectives and financial situation.
          Add to Favorites
          Share
          FastBull
          Copyright © 2026 FastBull Ltd

          728 RM B 7/F GEE LOK IND BLDG NO 34 HUNG TO RD KWUN TONG KLN HONG KONG

          TelegramInstagramTwitterfacebooklinkedin
          App Store Google Play Android Windows
          Products
          Charts

          Chats

          Q&A with Experts
          Screeners
          Economic Calendar
          Data
          Tools
          Membership
          Features
          Function
          Markets
          Copy Trading
          Latest Signals
          Contests
          24/7
          Analysis
          Education
          Company
          Careers
          About Us
          Contact Us
          Advertising
          Download FastBull
          Help Center
          Feedback
          User Agreement
          Privacy Policy
          Personal Information Protection Statement
          Business

          White Label

          Broker API

          Data API

          Web Plug-ins

          Poster Maker

          Affiliate Program

          Risk Disclosure

          The risk of loss in trading financial instruments such as stocks, FX, commodities, futures, bonds, ETFs and crypto can be substantial. You may sustain a total loss of the funds that you deposit with your broker. Therefore, you should carefully consider whether such trading is suitable for you in light of your circumstances and financial resources.

          No decision to invest should be made without thoroughly conducting due diligence by yourself or consulting with your financial advisors. Our web content might not suit you since we don't know your financial conditions and investment needs. Our financial information might have latency or contain inaccuracy, so you should be fully responsible for any of your trading and investment decisions. The company will not be responsible for your capital loss.

          Without getting permission from the website, you are not allowed to copy the website's graphics, texts, or trademarks. Intellectual property rights in the content or data incorporated into this website belong to its providers and exchange merchants.

          Not Logged In

          Log in to access more features

          Connect Broker
          Become a signal provider
          Help Center
          Customer Service
          Dark Mode
          Price Up/Down Colors

          Log In

          Sign Up

          Position
          Layout
          Fullscreen
          Default to Chart
          The chart page opens by default when you visit fastbull.com