


Daily Technical Analysis: [04 JUNE]
1. EUR/USD Analysis:
News Summary:
Markets are increasingly convinced that a June interest rate hike from the European Central Bank is virtually certain. Eurozone inflation accelerated from 3.0% in April to 3.2% in May, while services inflation rose to 3.5%, reinforcing concerns that underlying price pressures remain persistent. The ECB's Chief Economist has indicated that the latest data support further monetary tightening. The more challenging question for policymakers lies beyond June, as the debate shifts to inflation versus economic growth. If higher energy prices continue to feed through into services costs and wage growth, the ECB could be compelled to deliver another rate hike in September. Conversely, if economic activity weakens more rapidly than expected, market expectations for additional tightening may begin to fade.
Trend Analysis:
We can see EUR/USD has staged a rebound following its recent decline on the H4 chart but remains below the 48 hours moving average. On the other hand, the MACD double line and energy bars are converging below the zero axis. The buy limit could be set, stop loss is necessary.
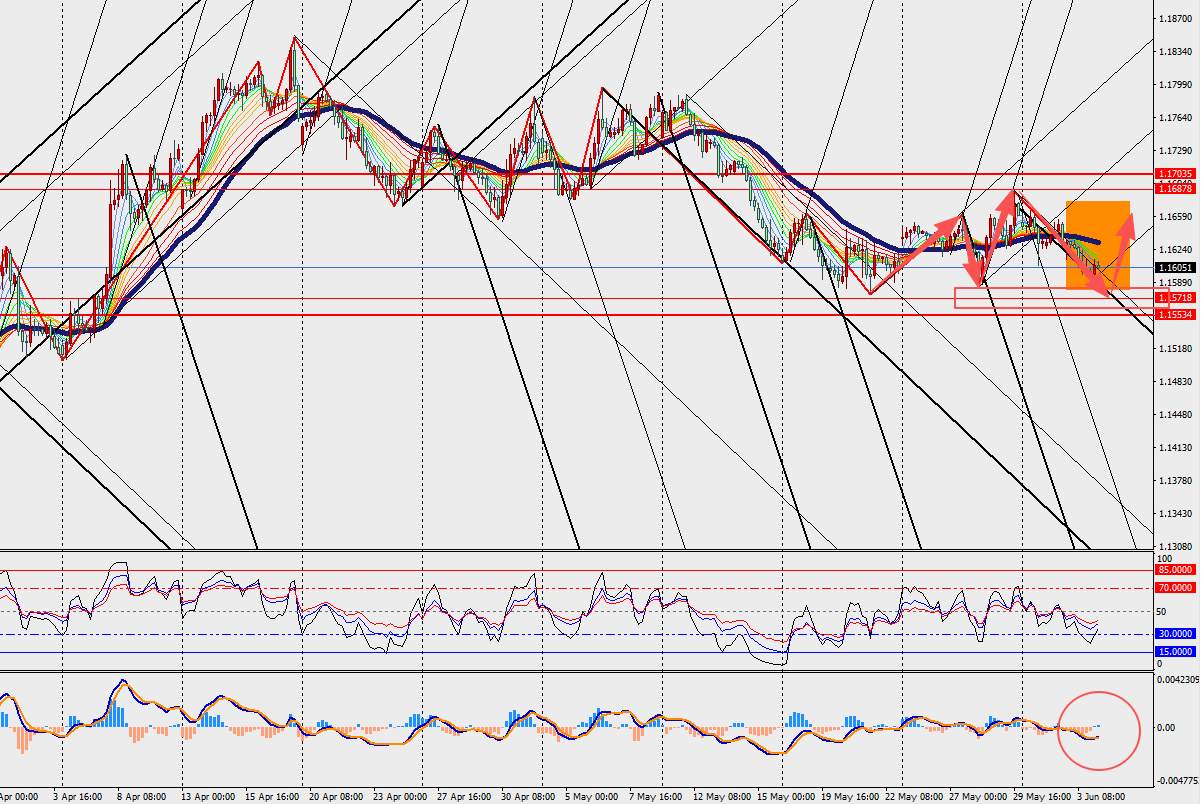
Today's Key Price Levels:
Key Support Levels: [1.1550]
Key Resistance Levels: [1.1700]
Pivot Points [1.1570]
2. Crude Oil Analysis:
News Summary:
The head of the International Energy Agency's (IEA) oil markets division has warned that if the current pace of global inventory drawdowns continues, crude oil stockpiles could fall to critical levels before the Northern Hemisphere's peak summer driving season begins. The summer months typically represent the strongest period of the year for fuel consumption, as increased road travel and air traffic boost demand for gasoline, diesel, and jet fuel. With inventory declines already well underway, the market appears increasingly likely to enter the seasonal demand peak with exceptionally tight supply conditions. Should the drawdown trend persist, global crude inventories could approach critical thresholds or even reach historically low levels, potentially providing further support for oil prices.
Trend Analysis:
On the H4 chart, we can see crude oil prices are undergoing a corrective pullback within a broader upward trend and continue to trade above the 48 hours moving average. Meanwhile, the MACD double line and histogram bars are expanding above the zero axis. The sell limit could be employed, stop loss is mandatory.
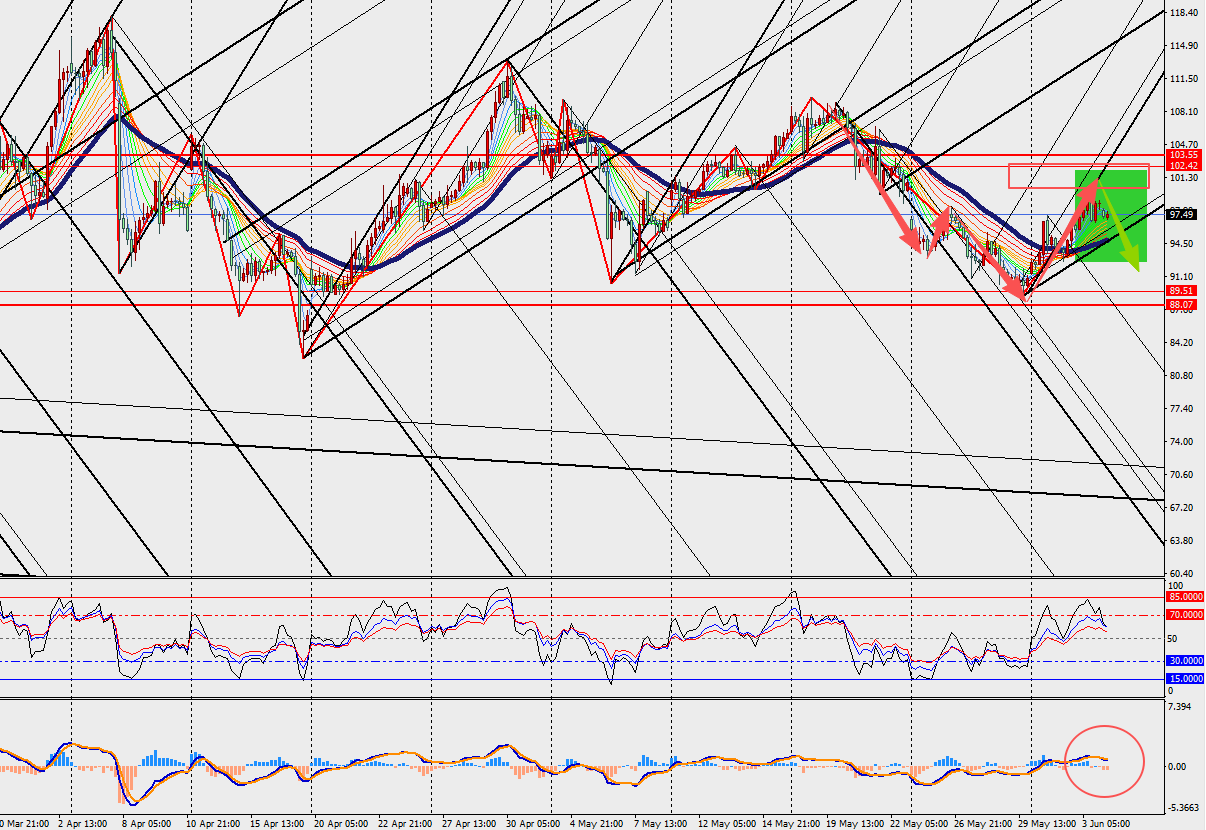
Today's Key Price Levels:
Key Support Levels: [90.00]
Key Resistance Levels: [102.00]
Pivot Points [100.00]


저작권 © 2026 FastBull Ltd


위험 경고
FX 거래는 위험도가 높으며 모든 투자자에게 적합하지 않을 수 있습니다. 레버리지는 추가적인 위험과 손실을 초래합니다. 거래하기 전에 투자 목표, 경험 수준 및 위험 허용 범위를 신중하게 고려하십시오. 초기 투자금의 일부 또는 전부를 잃을 수도 있습니다. 감당할 수 없는 돈을 투자하지 마십시오. FX 거래와 관련된 위험에 대해 스스로 교육하십시오. 질문이 있는 경우 독립적인 재무 또는 세무 자문가에게 문의하시기 바랍니다. 모든 데이터와 정보는 "있는 그대로" 제공되며 정보 제공 목적으로만 제공되며 거래나 추천 목적으로 제공되지 않습니다. 과거 성과는 미래 결과를 예측하지 않습니다.
부인 성명
본 웹사이트에 포함된 데이터는 실시간으로 정확하지 않을 수 있습니다. 본 사이트의 데이터 및 가격은 반드시 마켓이나 거래소에서 제공하는 것은 아니며, 마켓 메이커에 의해 제공될 수 있으므로 가격이 정확하지 않을 수 있으며 실제 시장 가격과 다를 수 있습니다. 즉, 해당 가격은 단지 시장 동향을 반영하기 위한 지표 가격으로 매매 목적으로는 불리합니다. 웹사이트에 포함된 데이터 제공자는 귀하의 거래 활동이나 웹사이트에 포함된 정보에 대한 의존으로 인해 귀하에게 발생한 손실에 대해 책임을 지지 않습니다.