• Trade
  • Markets
  • Copy
  • Contests
  • 24/7
  • Calendar
  • Q&A
  • Chats
Screeners
SYMBOL
LAST
BID
ASK
HIGH
LOW
NET CHG.
%CHG.
SPREAD
SOURCE
SPX
S&P 500 Index
7316.16
7316.16
7316.16
7450.84
7313.92
-112.61
-1.52%
--
--
DJI
Dow Jones Industrial Average
51594.44
51594.44
51594.44
52674.21
51551.18
-1152.88
-2.19%
--
--
IXIC
NASDAQ Composite Index
24442.95
24442.95
24442.95
25054.53
24425.34
-433.95
-1.74%
--
--
USDX
US Dollar Index
100.820
100.820
100.900
100.830
100.610
+0.200
+ 0.20%
--
--
EURUSD
Euro / US Dollar
1.14438
1.14438
1.14445
1.14746
1.14436
-0.00214
-0.19%
--
--
GBPUSD
Pound Sterling / US Dollar
1.33350
1.33350
1.33359
1.33751
1.33339
-0.00315
-0.24%
--
--
XAUUSD
Gold / US Dollar
4035.94
4035.94
4036.35
4100.26
4028.33
-31.41
-0.77%
--
--
WTI
Light Sweet Crude Oil
84.281
84.281
84.311
84.435
82.122
+0.718
+ 0.86%
--
--

Community Accounts

Signal Accounts
--
Profit Accounts
--
Loss Accounts
--
View More

Become a signal provider

Sell trading signals to earn additional income

View More

Guide to Copy Trading

Get started with ease and confidence

View More

Signal Accounts for Members

All Signal Accounts

Best Return
  • Best Return
  • Best P/L
  • Best MDD
Past 1W
  • Past 1W
  • Past 1M
  • Past 1Y

All Contests

  • All
  • Recommend
  • Stocks
  • Cryptocurrencies
  • Central Banks
  • Trump Updates
  • Featured News
Top News Only
Share

World Gold Council: Gold Prices' Rally In The Second Quarter Has Temporarily Paused, With The Gold Market Demonstrating Resilience

Share

World Gold Council: In The Second Quarter, Global Central Banks And Other Official Institutions Collectively Increased Their Gold Reserves By A Net Amount That Was 62% Higher Year Over Year

Share

The Main Styrene (EB) Futures Contract Rose By 2.00% During The Day, Currently Trading At 8631.00 Yuan/ton

Share

Institution: The Fed's Communication Is Proving Challenging For Markets, Potentially Weighing On Long-term Bonds And Equities

Share

The US Dollar Index (DXY) Rose Above 101, Up 0.18% On The Day

Share

Royal Bank Of Canada: Lowered Its Price Target For Boston Scientific From $85 To $70

Share

World Gold Council: In The Second Quarter, Gold Demand In The Chinese Market Fell 41% Year-on-Year

Share

The Main Fuel Oil Contract Surged 4.00% Intraday, Currently Trading At 3715.00 Yuan/ton

Share

Tokyo Gas Executive: If The Conflict In The Middle East Continues, The Pressure On Spot Liquefied Natural Gas Prices May Persist

Share

Caspian Pipeline Alliance: Oil Loading Operations Suspended After Tanker Was Attacked By Drone

Share

Authorities Say A Fire Broke Out At A Business In Russia’s Krasnodar Region Following A Drone Attack

Share

Saudi Arabia's GDP Is Projected To Decline By 4.8% Year-on-Year In The Second Quarter Of 2026. Non-oil Activity Is Expected To Fall By 24.7% Year-on-Year In The Second Quarter

Share

The Main Polysilicon Futures Contract Fell 2.00% During The Day, Currently Trading At 32,210 Yuan/ton

Share

Soda Ash Futures Contract 2609 Weakened During The Session, With The Decline Widening To 3.00%, And The Latest Price Was 938 Yuan/ton; The Trading Volume Was Approximately 17.296 Billion Yuan, With A Decrease Of Nearly 3,600 Lots In Open Interest During The Day, And Open Interest Slightly Declined

Share

The World Gold Council Reported That Indian Gold Demand Fell 6% Year-on-Year In The June Quarter, Primarily Due To Weak Jewelry Purchases. Indian Gold Demand Is Expected To Recover In The Second Half Of 2026, Provided Prices Remain Stable. India's Increased Tariffs On Gold Imports Have Fueled Smuggling And Squeezed Legitimate Market Participants

Share

Strategists: The Fed's Decision And Dissenting Votes Confirm The Market's Finely Balanced Pre-meeting Expectations

Share

Analyst: The Fed's Decision Is Being Described As A "disconcerting Pause."

Share

Ukrainian President Volodymyr Zelenskyy: Kyiv And Its Surrounding Areas, As Well As The Dnipropetrovsk, Lviv, Poltava, Kharkiv, Mykolaiv, Sumy, Vinnytsia, Cherkasy, And Ivano-Frankivsk Regions, Were Attacked Overnight. Russia Used More Than 70 Missiles In The Attack, A Significant Portion Of Which Were Ballistic Missiles. More Than 280 Attack Drones Were Also Involved. More Than 260 Drones Were Intercepted

Share

Aviva Investors: Under Chair Waller’s Leadership At The Federal Reserve, Investors Must Learn To Live With Uncertainty

Share

The Main Lithium Carbonate Futures Contract Fell By More Than 2.00% During The Day, Currently Trading At 143,620 Yuan/ton

TIME
ACT
FCST
PREV
IMPACT
Australia Weighted CPI YoY (SA) (Jun)

A:--

F: --

P: --

Australia RBA Trimmed Mean CPI YoY (Q2)

A:--

F: --

P: --

AUDUSD
  • AUDUSD
  • XAUUSD
  • XAGUSD
  • WTI
Australia CPI YoY (Q2)

A:--

F: --

P: --

AUDUSD
  • AUDUSD
  • XAUUSD
  • XAGUSD
  • WTI
Australia Weighted CPI YoY (Jun)

A:--

F: --

P: --

U.K. M4 Money Supply YoY (Jun)

A:--

F: --

P: --

GBPUSD
  • GBPUSD
  • XAUUSD
  • XAGUSD
  • WTI
  • USDX
U.K. Mortgage Approvals (Jun)

A:--

F: --

P: --
GBPUSD
  • GBPUSD
  • XAUUSD
  • XAGUSD
  • WTI
  • USDX
U.K. M4 Money Supply MoM (Jun)

A:--

F: --

P: --

GBPUSD
  • GBPUSD
  • XAUUSD
  • XAGUSD
  • WTI
  • USDX
U.K. Mortgage Lending (Jun)

A:--

F: --

P: --
GBPUSD
  • GBPUSD
  • XAUUSD
  • XAGUSD
  • WTI
  • USDX
Italy Average Hourly Wage MoM (Jun)

A:--

F: --

P: --

EURUSD
  • EURUSD
  • XAUUSD
  • XAGUSD
  • WTI
  • USDX
Germany 10-Year Bund Auction Avg. Yield

A:--

F: --

P: --

EURUSD
  • EURUSD
  • XAUUSD
  • XAGUSD
  • WTI
  • USDX
U.S. MBA Mortgage Application Activity Index WoW

A:--

F: --

P: --

USDX
  • USDX
  • XAUUSD
  • XAGUSD
  • WTI
U.S. EIA Weekly Heating Oil Stock Changes

A:--

F: --

P: --

WTI
  • WTI
  • XAUUSD
  • XAGUSD
  • USDX
U.S. EIA Weekly Crude Oil Imports Changes

A:--

F: --

P: --

WTI
  • WTI
  • XAUUSD
  • XAGUSD
  • USDX
U.S. EIA Weekly Crude Stocks Change

A:--

F: --

P: --

WTI
  • WTI
  • XAUUSD
  • XAGUSD
  • USDX
U.S. EIA Weekly Cushing, Oklahoma Crude Oil Stocks Change

A:--

F: --

P: --

WTI
  • WTI
  • XAUUSD
  • XAGUSD
  • USDX
U.S. EIA Weekly Crude Demand Projected by Production

A:--

F: --

P: --

WTI
  • WTI
  • XAUUSD
  • XAGUSD
  • USDX
U.S. EIA Weekly Gasoline Stocks Change

A:--

F: --

P: --

WTI
  • WTI
  • XAUUSD
  • XAGUSD
  • USDX
Russia Retail Sales YoY (Jun)

A:--

F: --

P: --

WTI
  • WTI
  • XAUUSD
  • XAGUSD
  • USDX
Russia Unemployment Rate (Jun)

A:--

F: --

P: --

WTI
  • WTI
  • XAUUSD
  • XAGUSD
  • USDX
Brazil CAGED Net Payroll Jobs (Jun)

A:--

F: --

P: --

XAUUSD
  • XAUUSD
  • XAGUSD
  • WTI
  • USDX
U.S. Target Federal Funds Rate Lower Limit (Overnight Reverse Repo Rate)

A:--

F: --

P: --

XAUUSD
  • XAUUSD
  • XAGUSD
  • WTI
  • USDX
U.S. Target Federal Funds Rate Upper Limit (Excess Reserves Ratio)

A:--

F: --

P: --

XAUUSD
  • XAUUSD
  • XAGUSD
  • WTI
  • USDX
FOMC Statement
FOMC Press Conference
Australia Building Permits MoM (SA) (Jun)

A:--

F: --

P: --
AUDUSD
  • AUDUSD
  • XAUUSD
  • XAGUSD
  • WTI
  • USDX
Australia Import Price Index YoY (Q2)

A:--

F: --

P: --

Australia Building Permits YoY (SA) (Jun)

A:--

F: --

P: --

AUDUSD
  • AUDUSD
  • XAUUSD
  • XAGUSD
  • WTI
  • USDX
Australia Private Building Permits MoM (SA) (Jun)

A:--

F: --

P: --

AUDUSD
  • AUDUSD
  • XAUUSD
  • XAGUSD
  • WTI
  • USDX
Japan Household Consumer Confidence Index (Jul)

A:--

F: --

P: --

USDJPY
  • USDJPY
  • XAUUSD
  • XAGUSD
  • WTI
  • USDX
France GDP Prelim YoY (SA) (Q2)

A:--

F: --

P: --

Turkey Economic Sentiment Indicator (Jul)

--

F: --

P: --

Germany GDP Prelim YoY (Working-day Adjusted) (Q2)

--

F: --

P: --

Italy GDP Prelim YoY (SA) (Q2)

--

F: --

P: --

Germany GDP Prelim YoY (Not SA) (Q2)

--

F: --

P: --

Germany GDP Prelim QoQ (SA) (Q2)

--

F: --

P: --

Euro Zone GDP Prelim QoQ (SA) (Q2)

--

F: --

P: --
Euro Zone Consumer Confidence Index Final (Jul)

--

F: --

P: --

Euro Zone Services Sentiment Index (Jul)

--

F: --

P: --

Euro Zone GDP Prelim YoY (SA) (Q2)

--

F: --

P: --

Euro Zone Economic Sentiment Indicator (Jul)

--

F: --

P: --

Italy Quarterly Unemployment Rate (SA) (Jun)

--

F: --

P: --

Euro Zone Industrial Climate Index (Jul)

--

F: --

P: --

Euro Zone Unemployment Rate (Jun)

--

F: --

P: --

Italy Unemployment Rate (SA) (Jun)

--

F: --

P: --

Euro Zone Selling Price Expectations (Jul)

--

F: --

P: --

Euro Zone Consumer Inflation Expectations (Jul)

--

F: --

P: --

Italy 10-Year BTP Bond Auction Avg. Yield

--

F: --

P: --

Italy 5-Year BTP Bond Auction Avg. Yield

--

F: --

P: --

South Africa PPI YoY (Jun)

--

F: --

P: --

Italy PPI YoY (Jun)

--

F: --

P: --

U.K. BOE MPC Vote Cut

--

F: --

P: --

U.K. BOE MPC Vote Hike

--

F: --

P: --

U.K. BOE MPC Vote Unchanged

--

F: --

P: --

U.K. Benchmark Interest Rate

--

F: --

P: --

MPC Rate Statement
Bank of England Governor Bailey held a press conference on monetary policy.
Germany GDP Final QoQ (SA) (Jul)

--

F: --

P: --

Germany HICP Prelim MoM (Jul)

--

F: --

P: --

Germany CPI Final MoM (Jul)

--

F: --

P: --

Germany HICP Prelim YoY (Jul)

--

F: --

P: --

Brazil Unemployment Rate (Jun)

--

F: --

P: --

Q&A with Experts
    • All
    • Chatrooms
    • Groups
    • Friends
    Galileo flag
    Every move starts with a good setup
    john flag
    Galileo
    Every move starts with a good setup
    @GalileoThis why they saw that we should focus more on quality than quantity
    SlowBear ⛅ flag
    PA!N ✖️
    @SlowBear ⛅next buying jone 3995
    @PA!N ✖️That is claen region to enter for sure
    Galileo flag
    john
    @GalileoThis why they saw that we should focus more on quality than quantity
    @johntrue
    SlowBear ⛅ flag
    Eylül Must
    gold is on buy now
    @Eylül MustGold is on buy? if you are buying then what about your target?
    john flag
    Galileo
    @johntrue
    @Galileothey say that Consistency beats one lucky trade every time
    Galileo flag
    The move looked smooth once momentum kicked in.
    john flag
    Galileo
    The move looked smooth once momentum kicked in.
    @Galileosometimes Staying with the trend is often the hardest part,,But the right thing
    Galileo flag
    A great example of letting the market do the work
    john flag
    Galileo
    A great example of letting the market do the work
    @GalileoWe just need to wait for the right opportunity instead of forcing trades.
    HMD-XAU ! flag
    HMD-XAU ! flag
    SlowBear ⛅ flag
    HMD-XAU !
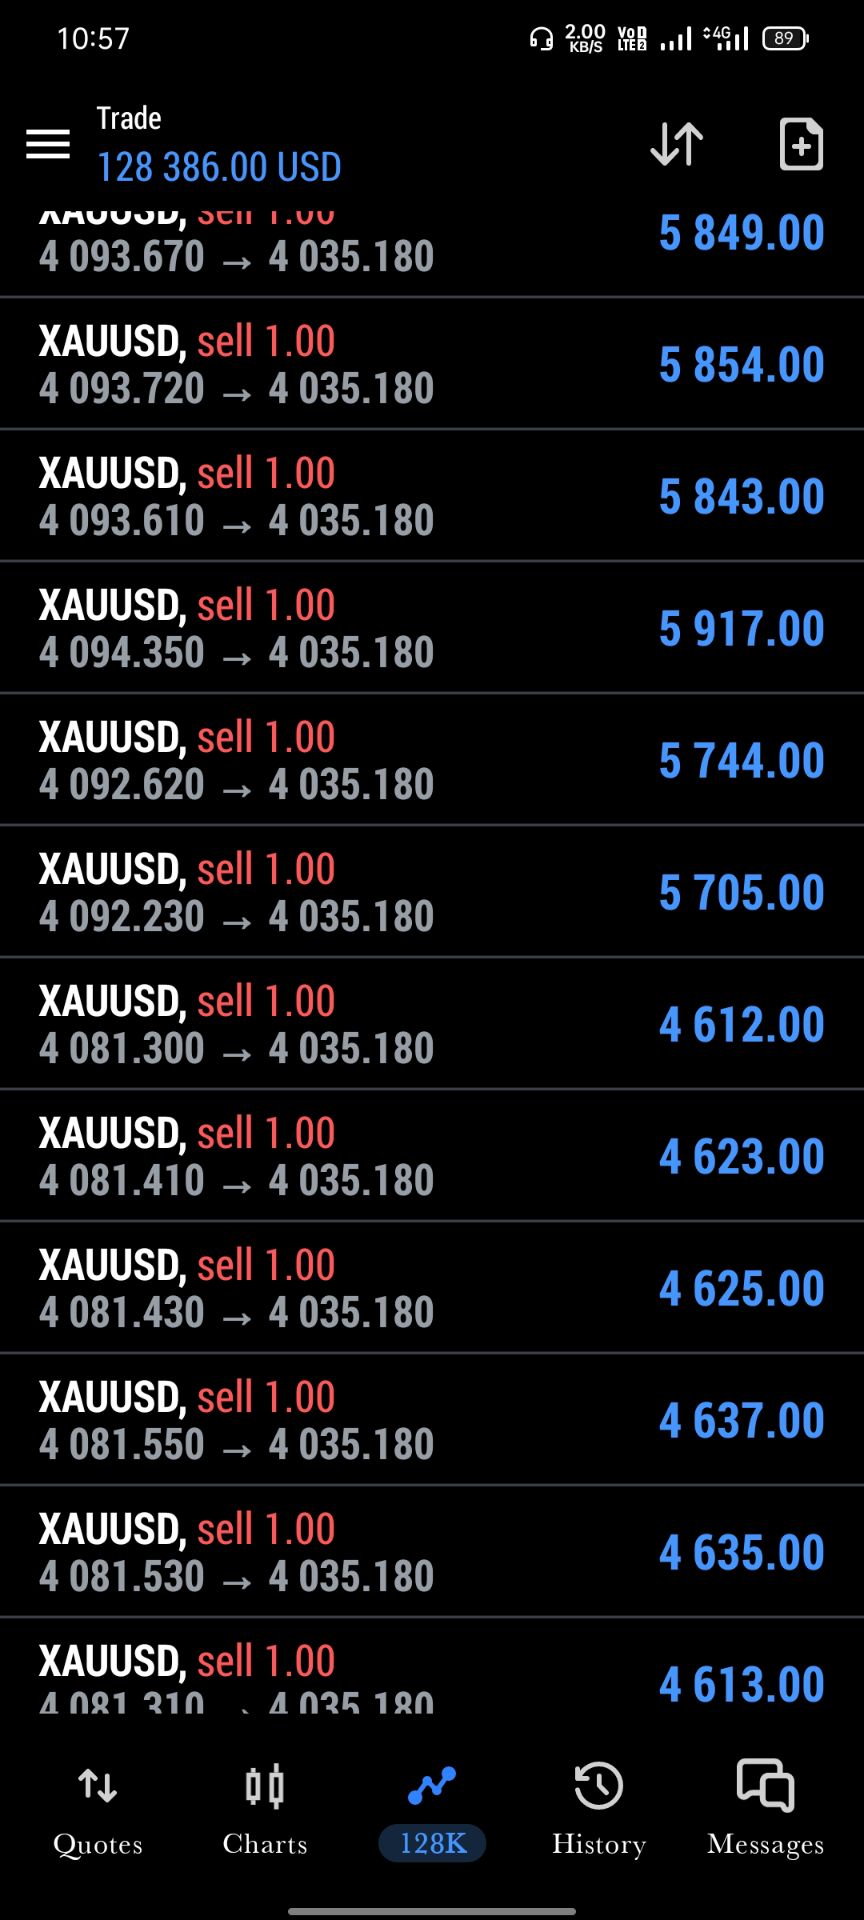
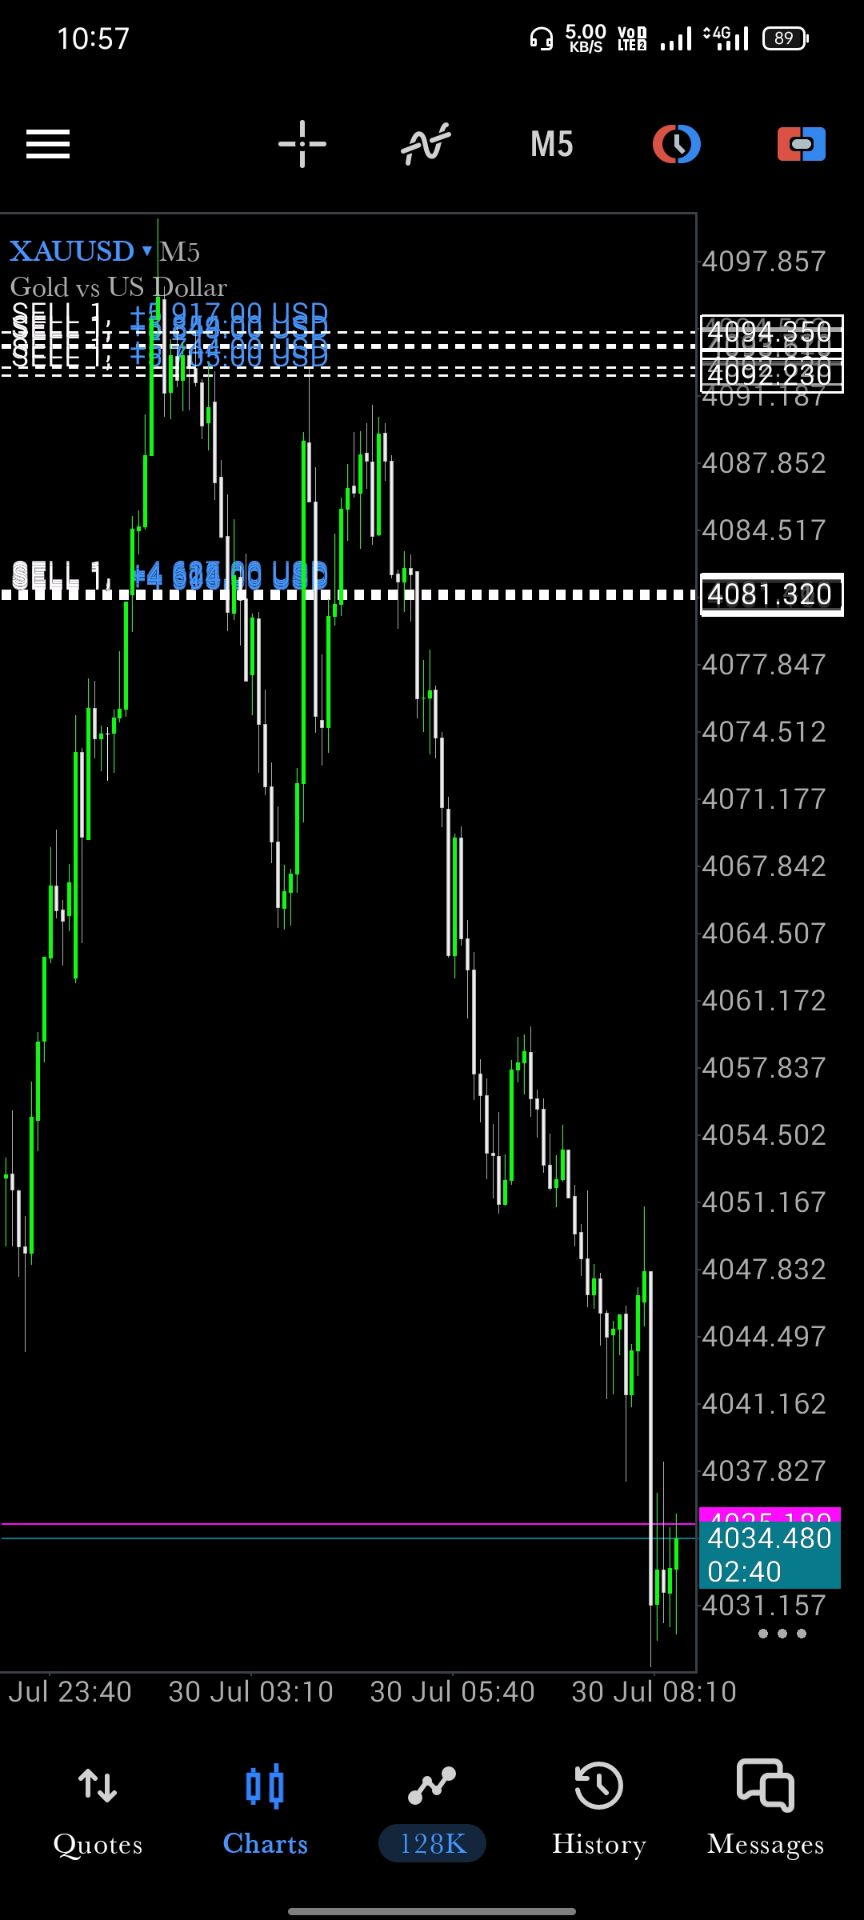
    @HMD-XAU ! Oh wowk so you are caught up in a Gold short as well, this is nice
    SlowBear ⛅ flag
    HMD-XAU !
    @HMD-XAU ! Good blues bro well done
    HMD-XAU ! flag
    SlowBear ⛅
    @HMD-XAU ! Oh wowk so you are caught up in a Gold short as well, this is nice
    @SlowBear ⛅
    HMD-XAU ! flag
    SlowBear ⛅
    @HMD-XAU ! Good blues bro well done
    @SlowBear ⛅Thank you so much dear friend
    GOLD TRADER flag
    HELLO GUYS
    HMD-XAU ! flag
    HMD-XAU ! flag
    GOLD TRADER flag
    GOLD BUY NOW 4031+ 4029 TP ¹ •  4034 TP ² •  4037 TP ³ •  4040 TP ⁴ •  4044    SL • 4022
    Type here...
    Add Symbol or Code

      No matching data

      All
      Recommend
      Stocks
      Cryptocurrencies
      Central Banks
      Trump Updates
      Featured News
      • All
      • Russia-Ukraine Conflict
      • Middle East Flashpoint
      • All
      • Russia-Ukraine Conflict
      • Middle East Flashpoint
      Search
      Products

      Charts Free Forever

      Chats Q&A with Experts
      Screeners Economic Calendar Data Tools
      Membership Features
      Data Warehouse Market Trends Institutional Data Policy Rates Macro

      Market Trends

      Market Sentiment Order Book Forex Correlations

      Top Indicators

      Charts Free Forever
      Markets

      News

      24/7 Analysis Education

      Latest Views

      Latest Update

      Signals

      Copy Rankings Latest Signals Become a signal provider AI Rating
      Contests
      Brokers

      Overview Brokers Assessment Rankings Regulators News Claims
      Broker listing Forex Brokers Comparison Tool Live Spread Comparison Scam
      Q&A Complaint Scam Alert Videos Tips to Detect Scam
      More

      Business
      Events
      Careers About Us Advertising Help Center

      White Label

      Broker API

      Data API

      Web Plug-ins

      Affiliate Program

      Awards Institution Evaluation IB Seminar Salon Event Exhibition
      Vietnam Thailand Singapore Dubai
      Fans Party Investment Sharing Session
      FastBull Summit BrokersView Expo
      Recent Searches
        Top Searches
          Markets
          Analysis
          User
          24/7
          Economic Calendar
          Education
          Data
          • Names
          • Latest
          • Prev

          View All

          No data

          Scan to Download

          Faster Charts, Chat Faster!

          Download
          English
          • English
          • Español
          • العربية
          • Bahasa Indonesia
          • Bahasa Melayu
          • Tiếng Việt
          • ภาษาไทย
          • Français
          • Italiano
          • Türkçe
          • Русский язык
          • 简中
          • 繁中
          Open Account
          Search
          Products
          Charts Free Forever
          Markets
          News
          Signals

          Copy Rankings Latest Signals Become a signal provider AI Rating
          Contests
          Brokers

          Overview Brokers Assessment Rankings Regulators News Claims
          Broker listing Forex Brokers Comparison Tool Live Spread Comparison Scam
          Q&A Complaint Scam Alert Videos Tips to Detect Scam
          More

          Business
          Events
          Careers About Us Advertising Help Center

          White Label

          Broker API

          Data API

          Web Plug-ins

          Affiliate Program

          Awards Institution Evaluation IB Seminar Salon Event Exhibition
          Vietnam Thailand Singapore Dubai
          Fans Party Investment Sharing Session
          FastBull Summit BrokersView Expo

          Calculating a Home Loan: Formula & Monthly Payment Calculator

          FastBull
          Summary:

          When calculating a home loan, a monthly payment is only half the story. Uncover the raw math of amortization that dictates the true lifetime cost of debt.

          Securing a mortgage involves more than just borrowing a lump sum to purchase a property. Calculating a home loan accurately requires mapping out the interplay between your principal balance, the interest rate, the loan term, and ongoing carrying costs. Understanding this underlying math empowers buyers to project exact monthly cash flow requirements and minimize the lifetime cost of their debt. This guide breaks down the standard mortgage formula, examines the hidden costs bundled into your monthly payment, and provides strategies for stress-testing your true borrowing capacity.

          Calculating a Home Loan: Formula & Monthly Payment Calculator

          What Goes Into a Home Loan Calculation?

          Calculating a home loan requires isolating three core mathematical variables—principal, interest rate, and term—and combining them with localized carrying costs like taxes and insurance. The resulting figure dictates both your monthly cash flow requirement and the total lifetime cost of the debt.

          Why the Same Loan Amount Can Give You Very Different Monthly Payments

          A $300,000 mortgage does not guarantee a specific monthly payment; the obligation shifts drastically based on the amortization schedule and the interest rate environment. Altering the loan term or the interest rate changes the velocity at which you pay down the principal, completely reshaping the math behind the loan.

          Shortening the loan tenure compresses the repayment window, which spikes the monthly cash requirement but slashes the total lifetime interest. Conversely, stretching the loan to 30 years lowers the monthly payment but exponentially increases the interest burden. Furthermore, a rate shift of just 200 basis points (2.00%) on a standard 30-year fixed mortgage alters the payment by nearly $400 a month.

          The table below demonstrates how a static $300,000 principal behaves under three distinct scenarios:

          Loan AmountTermInterest RateMonthly Principal & InterestTotal Lifetime Interest Paid
          $300,00030-Year5.0%$1,610$279,765
          $300,00030-Year7.0%$1,996$418,527
          $300,00015-Year5.0%$2,372$127,028

          Beyond the core principal and interest (P&I), structural loan types also introduce payment variance. For example, calculating a home equity loan payment relies on a fixed amortization schedule similar to a standard mortgage, whereas a Home Equity Line of Credit (HELOC) generally requires interest-only payments during the draw period, making the initial payments artificially low before they reset higher.

          Which Numbers Do You Actually Need Before You Start?

          To accurately calculate your home loan monthly payment or assess home loan eligibility, you must gather exact figures for both the debt structure and the property's carrying costs. Relying on estimates for these inputs yields an inaccurate amortization schedule and renders the calculation useless for actual financial planning.

          Gather the following exact figures before running a calculation:

          • Principal Loan Amount (P): The final purchase price minus your down payment. Do not use the home's total sticker price as the principal unless you are utilizing a 100% financing option, such as a VA home loan or a USDA loan.
          • Nominal Annual Interest Rate (r): The exact rate applied to your principal by the lender. Do not use the Annual Percentage Rate (APR) for this calculation. While APR is useful for comparing the total cost of borrowing (as it includes origination fees and points), the nominal interest rate is the mathematical input that dictates the actual monthly P&I payment.
          • Total Loan Tenure (n): The total number of monthly payments required to retire the debt. A standard 30-year mortgage requires 360 payments; a 15-year term requires 180.
          • Annual Property Taxes: The municipal tax assessment on the property. Because lenders typically require you to escrow taxes, you must divide the annual tax bill by 12 and add it to your P&I payment to find your true monthly obligation.
          • Homeowners Insurance and HOA Fees: The annual premium for hazard insurance divided by 12, plus any monthly homeowners association dues. Lenders factor these exact carrying costs into your debt-to-income (DTI) ratio when calculating home loan eligibility.

          How to Calculate Your Monthly Home Loan Payment Manually

          Once you have gathered these exact figures, you can plug them into the mathematical model. Calculating a home loan requires a standard amortization formula that factors in your principal balance, the periodic interest rate, and the total number of payments. This mathematical model determines the exact fixed monthly payment required to reduce the loan balance to zero by the end of the term.

          The Standard Mortgage Formula Explained in Plain Math

          The universal equation lenders use to calculate a mortgage loan payment isolates the monthly obligation based on compounding interest. The home loan interest calculation formula is:

          M = P × [ r(1 + r)^n ] / [ (1 + r)^n - 1 ]

          • M (Monthly Payment): The total principal and interest due each month. This excludes escrow requirements like property taxes and homeowners insurance.
          • P (Principal): The total loan amount borrowed (the purchase price minus your down payment).
          • r (Monthly Interest Rate): The annual interest rate divided by 12. An annual rate of 6% translates to a monthly rate of 0.005 (0.06 / 12).
          • n (Number of Payments): The total loan tenure expressed in months. A standard 30-year mortgage equals 360 payments (30 × 12).

          How to Work Through the Formula Step by Step With a Real Example

          To calculate a home loan manually without formula errors, you must execute the exact order of operations. Consider a buyer financing a $300,000 principal at a 6.0% annual interest rate over a 30-year term.

          The baseline inputs are:

          • P: $300,000
          • r: 0.005 (6.0% / 12 months)
          • n: 360 (30 years × 12 months)

          The step-by-step calculation:

          1. Calculate (1 + r): Add 1 to the monthly rate. (1 + 0.005 = 1.005).
          2. Calculate (1 + r)^n: Raise the result to the power of 360. (1.005^360 ≈ 6.022575).
          3. Solve the numerator [ r(1 + r)^n ]: Multiply the monthly rate by step 2's result. (0.005 × 6.022575 = 0.0301128).
          4. Solve the denominator [ (1 + r)^n - 1 ]: Subtract 1 from step 2's result. (6.022575 - 1 = 5.022575).
          5. Divide the numerator by the denominator: (0.0301128 / 5.022575 ≈ 0.0059955).
          6. Multiply by the Principal (P): ($300,000 × 0.0059955 = $1,798.65).

          The baseline monthly payment for principal and interest is exactly $1,798.65.

          How Interest Rate and Loan Term Affect What You Owe Each Month

          Adjusting your loan tenure or securing a different interest rate dramatically alters your immediate cash flow and the total cost of borrowing. A longer term reduces the monthly burden but substantially increases the lifetime interest paid, while a higher rate exponentially drives up both metrics.

          The table below illustrates the mechanical trade-offs of altering terms and rates on a baseline $300,000 mortgage.

          Loan ScenarioMonthly Payment (P&I)Total Interest Paid Over Life of LoanTotal Cost (Principal + Interest)
          30-Year at 5.0%$1,610$279,767$579,767
          30-Year at 7.0%$1,996$418,527$718,527
          15-Year at 5.0%$2,372$127,028$427,028
          15-Year at 7.0%$2,696$185,366$485,366

          Securing a 15-year term rather than a 30-year term at a 7% rate increases the monthly payment by $700, but saves $233,161 in total interest. The accelerated amortization schedule forces a higher percentage of early payments toward principal reduction rather than interest service.

          Conversely, a 200 basis point rate increase (from 5% to 7%) on a 30-year term adds nearly $139,000 in raw interest costs without building any additional home equity. When calculating home loan eligibility, underwriters stress-test these exact variables against your debt-to-income (DTI) ratio to determine maximum borrowing limits. If the rate pushes the resulting monthly payment beyond 28% to 36% of your gross monthly income, you will likely need to adjust the principal downward.

          What Does the Monthly Payment Actually Cover?

          Even after you pin down the principal and interest, your total out-of-pocket obligation involves more than just servicing the debt. A standard home loan payment consists of four distinct components, collectively known as PITI: Principal, Interest, Taxes, and Insurance. While calculating a home loan using standard amortization formulas yields only the principal and interest, the actual amount debited from your bank account includes estimated monthly costs for property taxes and required insurance coverages.

          How Principal and Interest Split Changes Over the Life of Your Loan

          The ratio of principal to interest in your monthly payment shifts continuously over the term through a process called amortization, heavily front-loading the interest costs in the early years. Because mortgage interest is calculated by multiplying the remaining principal balance by the monthly interest rate (the annual rate divided by 12), your initial payments go primarily toward the lender’s yield rather than debt reduction.

          For a $300,000, 30-year fixed-rate mortgage at a 6.5% interest rate, the standard monthly principal and interest (P&I) payment is $1,896. In month one, $1,625 (85% of the payment) goes directly to interest, while only $271 pays down the principal balance. By year 15, the outstanding principal has decreased enough that the interest and principal split is roughly equal. By year 29, the math reverses entirely, and nearly the entire $1,896 payment is applied to the principal.

          This front-loaded interest structure creates a significant trade-off for short-term homeowners. Selling or refinancing the property within the first five years yields minimal equity buildup from the payments alone. Making additional principal payments early in the loan term artificially accelerates this amortization schedule, reducing the principal balance used for the next month's interest calculation.

          What Extra Costs (Taxes, Insurance, PMI) Are Usually Added On Top

          Lenders typically bundle property taxes and mandatory insurance premiums into your monthly payment, holding these funds in an escrow account until the annual bills are due. When calculating a home loan payment to determine true affordability, these holding costs must be added to your baseline P&I figure.

          • Property Taxes: Local governments assess taxes based on the property's value to fund civic services. While rates vary drastically by municipality, the national average is roughly 1.1% of the assessed value annually. On a $400,000 home, this adds approximately $366 to the monthly mortgage payment.
          • Homeowners Insurance: Lenders require hazard insurance to protect their collateral against fire, weather, and catastrophic damage. Premiums generally range from $1,200 to $2,500 annually, adding $100 to $200 per month depending on the location's risk profile and the property's replacement cost.
          • Private Mortgage Insurance (PMI): If your initial down payment is less than 20% (creating a Loan-to-Value ratio above 80%), conventional lenders mandate PMI to protect themselves against default. PMI typically costs between 0.5% and 2% of the total loan amount annually, depending heavily on your credit score. For a $300,000 loan at a 1% PMI rate, expect an additional $250 per month. This cost can be removed once you reach 20% equity.
          • Homeowners Association (HOA) Fees: While usually paid directly to the association rather than bundled into the lender's escrow account, HOA dues are factored into your debt-to-income (DTI) ratio when calculating home loan eligibility. These range from $50 a month for basic neighborhood upkeep to over $1,000 for buildings with extensive amenities.

          How to Use a Home Loan Calculator to Check Your Numbers

          Rather than crunching all these PITI components by hand, digital tools can automate the complex math. A reliable home loan calculator converts the raw variables of your mortgage into a precise payment schedule. By isolating individual factors like interest rates or term lengths, you can test affordability limits and total borrowing costs before initiating a hard credit pull with a lender.

          What to Enter and What the Results Mean

          Accurate monthly payment projections require six specific data points. Missing or estimating the property taxes and insurance components will drastically understate your actual housing costs.

          To generate a precise calculation, input the following:

          • Home Price & Down Payment: The calculator subtracts your down payment cash from the total purchase price to determine the principal loan amount.
          • Interest Rate: The annual percentage rate (APR) charged by the lender for borrowing the funds.
          • Loan Term: The repayment duration, typically 15 or 30 years.
          • Property Taxes: Annual municipal taxes, usually divided by 12 and held in escrow.
          • Homeowners Insurance: Required hazard coverage to protect the lender's collateral against damage.
          • HOA Fees & PMI: Homeowners Association dues or Private Mortgage Insurance (typically triggered if the down payment is under 20%).

          The primary result generated is your monthly payment (often referred to as an EMI, or Equated Monthly Installment, in international markets). Basic calculators output P&I (Principal and Interest only), which covers just the debt service. Comprehensive calculators output PITI (Principal, Interest, Taxes, and Insurance), which reflects the true monthly cash outflow required.

          Beyond the monthly figure, the calculator will display the Total Interest Paid over the life of the loan and an Amortization Schedule. This schedule details exactly how each payment splits between interest charges and principal reduction month by month.

          How to Use the Calculator to Compare Loan Scenarios

          To effectively compare mortgage options, lock all variables in the calculator except the one you are actively testing. This A/B testing approach isolates the financial impact of specific decisions, such as shortening a term or adjusting cash down.

          Testing Loan Terms: 15-Year vs. 30-Year A shorter loan term reduces the lender's risk, usually securing a lower interest rate, but condenses the repayment window. The trade-off is a heavy hit to monthly liquidity in exchange for massive long-term interest savings.

          Loan Scenario ($300,000 Principal)Monthly P&ITotal Lifetime InterestThe Trade-off
          30-Year at 6.5%$1,896$382,633Lower monthly burden; total interest exceeds the original principal.
          15-Year at 6.0%$2,531$155,683Tightens monthly cash flow by $635; saves $226,950 in lifetime interest.

          Testing Prepayment Impact You can calculate a home loan payment schedule based on aggressive repayment by utilizing the "extra payment" field found in advanced calculators. Adding just $200 extra per month to the principal of the 30-year scenario above bypasses tens of thousands of dollars in scheduled interest and accelerates the payoff date by several years.

          Testing Rate Sensitivity and Affordability Stress-test your household budget by increasing the calculator's interest rate by 100 to 200 basis points. If you are calculating a home equity loan (HELOC) or an adjustable-rate mortgage (ARM), this exercise reveals exactly how much your required monthly payment will jump when variable rates adjust upward. This ensures your home loan eligibility translates into real-world affordability, even in a rising rate environment.

          How Much Home Loan Can You Realistically Afford?

          While calculators help test these variables, your true borrowing limit depends on strict lender guidelines. Your maximum home loan affordability is mathematically constrained by your gross monthly income, prevailing interest rates, and lender-mandated debt-to-income ceilings. While calculators can output the maximum principal a bank will legally lend you, realistic affordability requires stress-testing that figure against net income and non-debt living expenses.

          What Your Monthly Payment Tells You About Total Loan Cost

          As demonstrated earlier, a fixed monthly payment masks a shifting ratio of principal to interest, directly dictating the total lifetime cost of the debt. When calculating a home loan, borrowers often focus strictly on the monthly outflow, ignoring the underlying amortization schedule. In the early years of a standard 30-year fixed mortgage, the vast majority of every payment services interest rather than building equity.

          The home loan interest calculation formula for a single month is straightforward: (Outstanding Principal Balance × Annual Interest Rate) / 12. Because the principal balance is highest at origination, the initial interest burden is disproportionately large.

          Consider a $300,000 mortgage at a 6.5% fixed interest rate over 30 years. The equated monthly installment (EMI) is $1,896. Here is how that fixed payment behaves over time:

          Loan MilestonePrincipal Portion of PaymentInterest Portion of PaymentTotal Equity Built
          Month 1$271$1,625$271
          Year 10 (Month 120)$519$1,377$44,815
          Year 20 (Month 240)$991$905$136,547
          Year 29 (Month 348)$1,778$118$281,424

          Understanding how to calculate home loan monthly payment dynamics reveals a harsh reality: extending the loan tenure shrinks the monthly obligation but exponentially inflates the total cost. In the scenario above, the borrower repays the $300,000 principal plus $382,633 in interest, bringing the total cost of the loan to $682,633. A lower monthly payment often signals a higher lifetime interest penalty.

          What Debt-to-Income Ratio Do Lenders Use to Approve Your Loan?

          Underwriters primarily evaluate conventional loan applications against a 28% front-end and 36% back-end DTI standard. Figuring out how to calculate home loan eligibility requires separating your liabilities into these two distinct buckets, measured against your gross (pre-tax) monthly income.

          • Front-end DTI (Housing Ratio): The percentage of gross income consumed by your total housing payment. This includes Principal, Interest, Taxes, and Insurance (PITI), plus any Homeowners Association (HOA) fees.
          • Back-end DTI (Total Debt Ratio): The percentage of gross income consumed by PITI plus all other recurring debt obligations, such as auto loans, student loans, and minimum credit card payments.

          Lending standards vary strictly by the underlying mortgage product. While the 28/36 rule is the benchmark for conventional lending, government-backed products operate on different mathematical models.

          Mortgage TypeStandard Front-End DTI LimitStandard Back-End DTI LimitAbsolute Maximum DTI (with compensating factors)
          Conventional (Fannie/Freddie)28%36%Up to 45–50% (requires high credit score/reserves)
          FHA Loan31%43%Up to 50% (requires automated underwriting approval)
          VA LoanNot strictly enforced41%Varies (VA relies heavily on a residual income calculation)

          A critical trade-off exists between lender approval limits and actual financial solvency. Lenders assess eligibility using gross income, but borrowers pay mortgages with net (after-tax) income. Maxing out a back-end DTI at 45% for a conventional loan leaves only 55% of gross income to cover taxes, retirement contributions, utilities, groceries, and childcare. Consequently, calculating home loan maximums based purely on automated underwriting limits routinely overestimates what a borrower can comfortably absorb.

          FAQs about calculating a home loan

          How much is a $350,000 mortgage at 6% for 30 years?

          For a $350,000 mortgage with a 6% fixed annual interest rate over a 30-year term, the monthly principal and interest payment is $2,098.43. This baseline calculation does not include additional homeownership costs, such as property taxes, home insurance, or homeowners association (HOA) fees. Factoring in those extra expenses will increase your total monthly housing payment.

          What is the formula for calculating home loan?

          The standard formula used to calculate a fixed-rate monthly mortgage payment is M = P[r(1 + r)^n] / [(1 + r)^n - 1]. In this equation, M represents the total monthly payment, P is the principal loan amount, r is your monthly interest rate (the annual rate divided by 12), and n is the total number of monthly payments over the life of the loan.

          What is the 3 3 3 rule for mortgages?

          The 3-3-3 rule is a real estate guideline used to assess a homebuyer's financial readiness and stability. It suggests that borrowers should aim for a 3% down payment, keep their total debt-to-income ratio below 36%, and maintain at least 3 months of mortgage payments in savings as cash reserves. Some real estate professionals also use a variation of this rule that advises buyers to evaluate at least 3 similar properties before committing to a purchase.

          How do I calculate how much home loan I can afford?

          You can easily estimate your home loan affordability using the 28/36 rule, a standard benchmark used by many mortgage lenders. According to this guideline, your total housing costs—including the loan principal, interest, property taxes, and insurance—should not exceed 28% of your gross monthly income. Additionally, your back-end ratio or total monthly debt obligations, which combines your housing costs with other debts like car loans and credit cards, should remain under 36% of your gross income.

          Conclusion

          Mastering the math behind a mortgage transforms an overwhelming debt obligation into a manageable financial plan. By isolating variables like the loan term and interest rate, buyers can accurately project both their immediate monthly cash flow and their long-term borrowing costs. Moving beyond basic principal and interest to account for taxes, insurance, and debt-to-income limits ensures that lender approval aligns with true household affordability. Armed with these precise calculations, borrowers can confidently secure a loan structure that serves their broader financial goals.

          Risk Warnings and Disclaimers
          You understand and acknowledge that there is a high degree of risk involved in trading. Following any strategies or investment methods may lead to potential losses. The content on the site is provided by our contributors and analysts for information purposes only. You are solely responsible for determining whether any trading assets, securities, strategy, or any other product is suitable for investing based on your own investment objectives and financial situation.
          Add to Favorites
          Share
          FastBull
          Copyright © 2026 FastBull Ltd

          728 RM B 7/F GEE LOK IND BLDG NO 34 HUNG TO RD KWUN TONG KLN HONG KONG

          TelegramInstagramTwitterfacebooklinkedin
          App Store Google Play Android Windows
          Products
          Charts

          Chats

          Q&A with Experts
          Screeners
          Economic Calendar
          Data
          Tools
          Membership
          Features
          Function
          Markets
          Copy Trading
          Latest Signals
          Contests
          24/7
          Analysis
          Education
          Company
          Careers
          About Us
          Contact Us
          Advertising
          Download FastBull
          Help Center
          Feedback
          User Agreement
          Privacy Policy
          Personal Information Protection Statement
          Business

          White Label

          Broker API

          Data API

          Web Plug-ins

          Poster Maker

          Affiliate Program

          Risk Disclosure

          The risk of loss in trading financial instruments such as stocks, FX, commodities, futures, bonds, ETFs and crypto can be substantial. You may sustain a total loss of the funds that you deposit with your broker. Therefore, you should carefully consider whether such trading is suitable for you in light of your circumstances and financial resources.

          No decision to invest should be made without thoroughly conducting due diligence by yourself or consulting with your financial advisors. Our web content might not suit you since we don't know your financial conditions and investment needs. Our financial information might have latency or contain inaccuracy, so you should be fully responsible for any of your trading and investment decisions. The company will not be responsible for your capital loss.

          Without getting permission from the website, you are not allowed to copy the website's graphics, texts, or trademarks. Intellectual property rights in the content or data incorporated into this website belong to its providers and exchange merchants.

          Not Logged In

          Log in to access more features

          Connect Broker
          Become a signal provider
          Help Center
          Customer Service
          Dark Mode
          Price Up/Down Colors

          Log In

          Sign Up

          Position
          Layout
          Fullscreen
          Default to Chart
          The chart page opens by default when you visit fastbull.com