
What Is FastBull Chart?
FastBull Chart is a free professional financial charting platform that provides powerful market analysis tools for global financial markets, including forex, gold, commodities, indices, stocks, cryptocurrencies, and futures.
Unlike traditional trading platforms, FastBull does not require you to open a broker account. You can access the charts instantly — even without signing in — to view real-time market data, perform technical analysis, and learn trading.
FastBull is available on Web, Windows PC, iOS, and Android, with cross-platform synchronization that lets you monitor markets and analyze price movements anytime, anywhere. Whether you're a beginner taking your first steps in trading or an experienced professional, FastBull Chart provides everything you need to complete your entire trading analysis workflow — from market monitoring and technical analysis to trade review with Bar Replay.
Why Choose FastBull Chart?
FastBull is committed to providing traders worldwide with a free, all-in-one charting and market analysis platform. Compared with traditional charting and trading platforms, FastBull offers several key advantages:
Enjoy free access to core features, including professional charts, technical indicators, drawing tools, Bar Replay, the Economic Calendar, and more.
Unlike traditional trading software, you don't need to open a broker account to access real-time market data or perform technical analysis.
Your watchlists, layouts, and analysis are synchronized across Web, Windows PC, iOS, and Android.
Analyze forex, gold, commodities, indices, stocks, cryptocurrencies, and futures from a single platform.
Hundreds of technical indicators, Order Flow Analysis, Footprint Charts, Volume Profile, Anchored VWAP, Elliott Wave, Fibonacci and Gann tools, and more.
Display and analyze up to 100 charts simultaneously, making it easy to monitor multiple markets and timeframes in one workspace.
Easy to Use: a clean and intuitive interface helps beginners get started quickly while providing the advanced functionality professional traders expect.
Before You Get Started
If you're using FastBull Chart for the first time, we recommend exploring its core features in the following order:
- Search for a trading instrument
- Switch between chart types and timeframes
- Add commonly used technical indicators
- Analyze the market using drawing tools
- Save your chart layout or set price alerts
Once you've completed these five steps, you'll be able to perform a basic chart analysis with confidence. In the following sections, this guide will walk you through each feature step by step, following the actual layout of the FastBull Chart interface, so you can quickly master the platform's full functionality.
FastBull Chart Interface Overview
The FastBull Chart interface can be divided into six main sections:
Gives you access to Market Quotes, News, the Economic Calendar, and the Community, allowing you to analyze the markets without leaving the chart.
Used to search trading instruments, switch timeframes, add technical indicators, and manage price alerts.
Provides drawing and annotation tools for technical analysis.
Includes multi-chart layout options and chart display controls.
Manage watchlists, connected trading accounts, and trading-related functions.
View real-time quotes and key market data for the selected trading instrument.
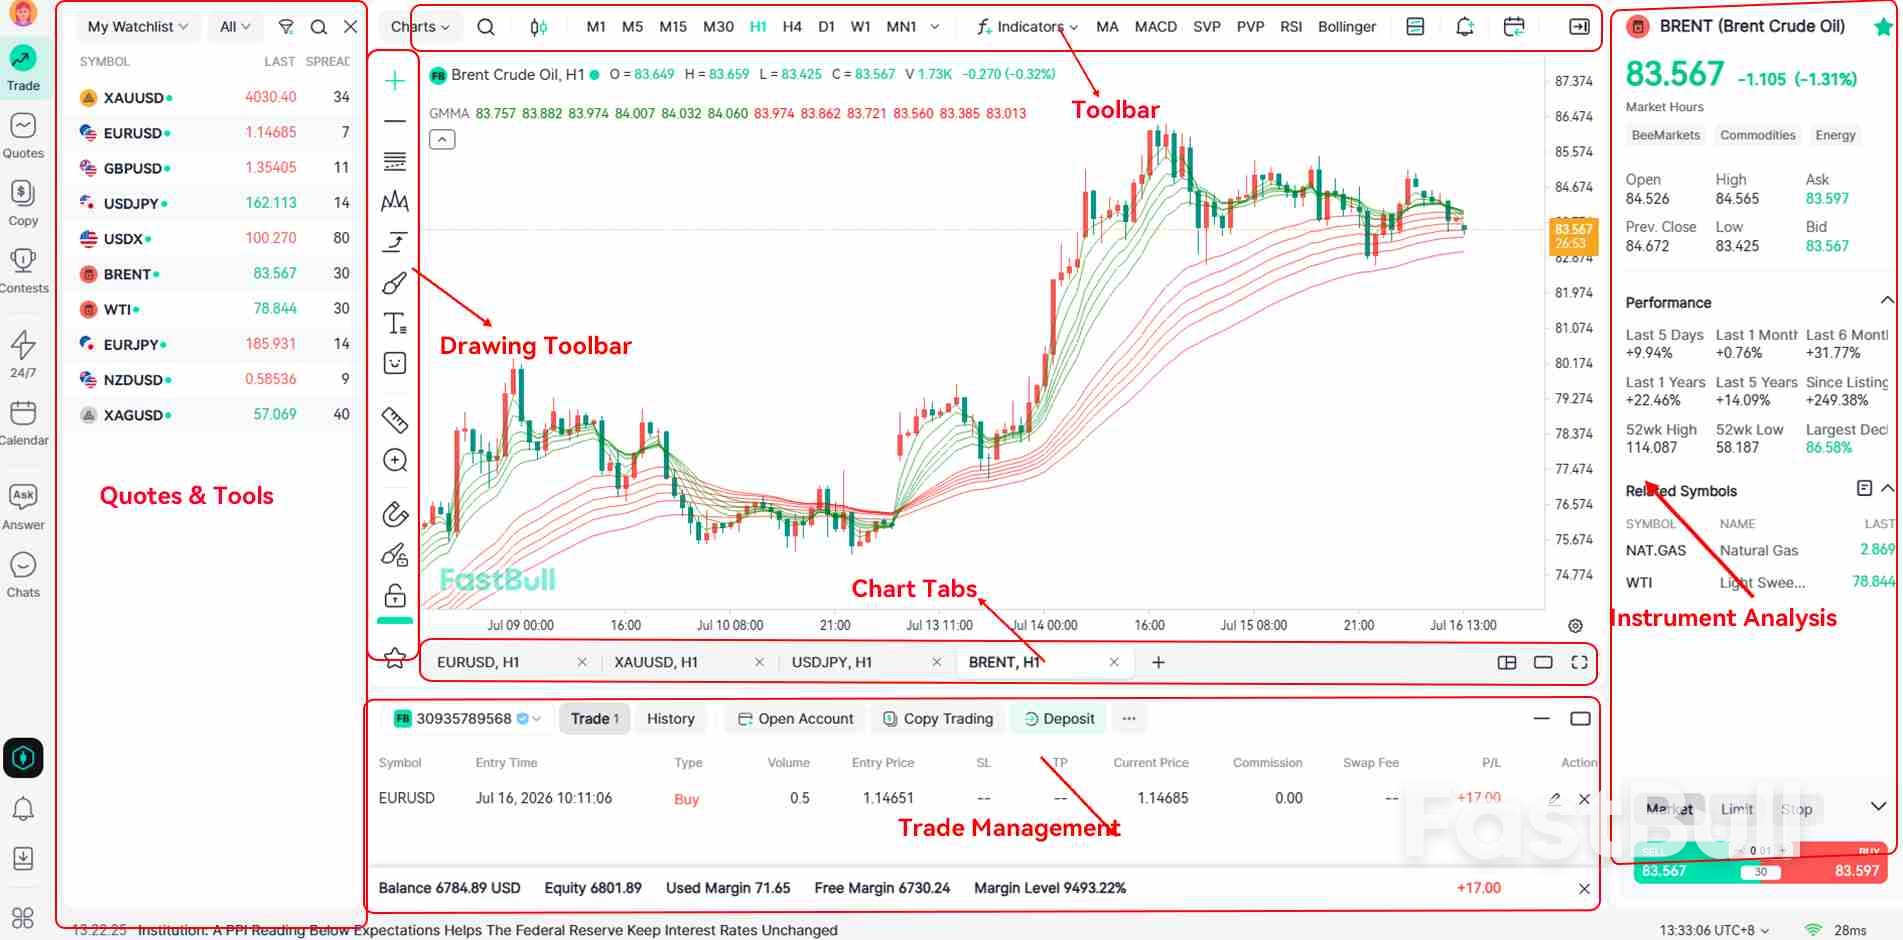
| Sections | Core Functions | Common Use Cases |
|---|---|---|
| Top Toolbar | Search Trading Instruments, Switch Chart Types, Change Timeframes, Add Technical Indicators, Save Chart Templates, Set Price Alerts, Bar Replay, Paper Trading | Which market should I analyze? Which timeframe and indicators should I use? |
| Left Drawing Toolbar | Trend Lines, Horizontal Lines, Channels, Fibonacci Tools, Gann Tools, Elliott Wave, Risk/Reward Ratio, Text Annotations, Chart Sync, Favorite Tools | How can I visualize my trading analysis on the chart? |
| Chart Tabs | Chart Tabs, Multi-Chart Layouts, Full Screen, Recently Closed Charts, Go to Date, Bar Countdown, Time Zone, Auto Scale, Create a Paper Trading Account | How can I monitor multiple instruments or timeframes at the same time, or restore previously opened charts? |
| Quotes & Tools | Market Quotes, News, Economic Calendar, Q&A, Chat, Trading Contests, Copy Trading Entrance | How can I stay updated with market news and events while analyzing charts? |
Top Toolbar: Trading Instruments, Chart Types, Timeframes, Indicators & Alerts, Bar Replay, and Paper Trading
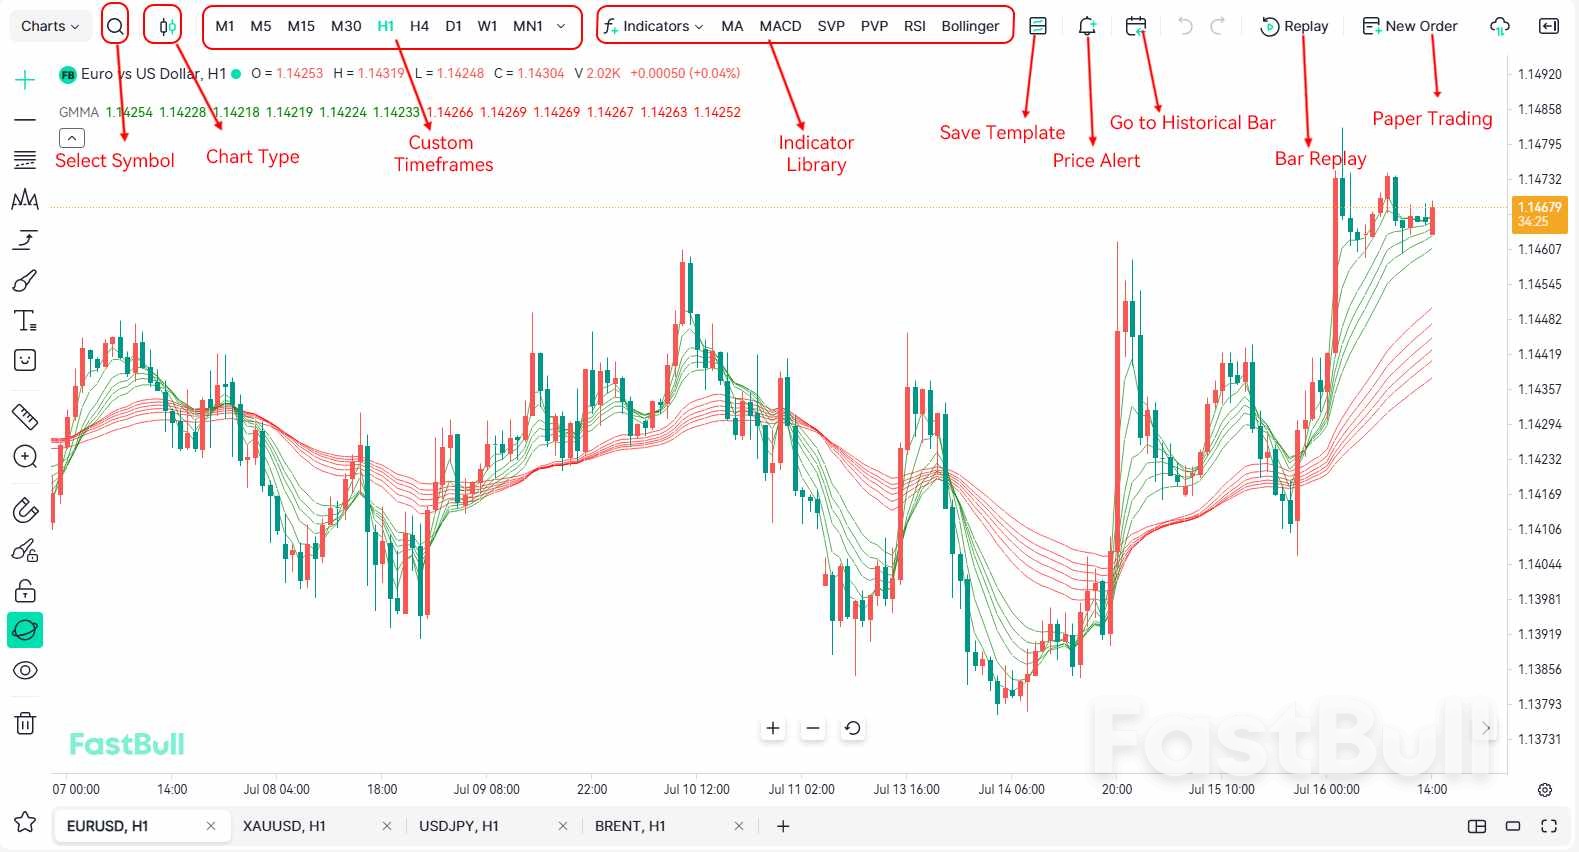
4.1 Search Trading Instruments
Searching for a trading instrument is the first step when using FastBull Chart. Click the 🔎 Instrument Search box in the upper-left corner of the chart, then enter a symbol, name, code, or keyword to quickly find the instrument you want to analyze.
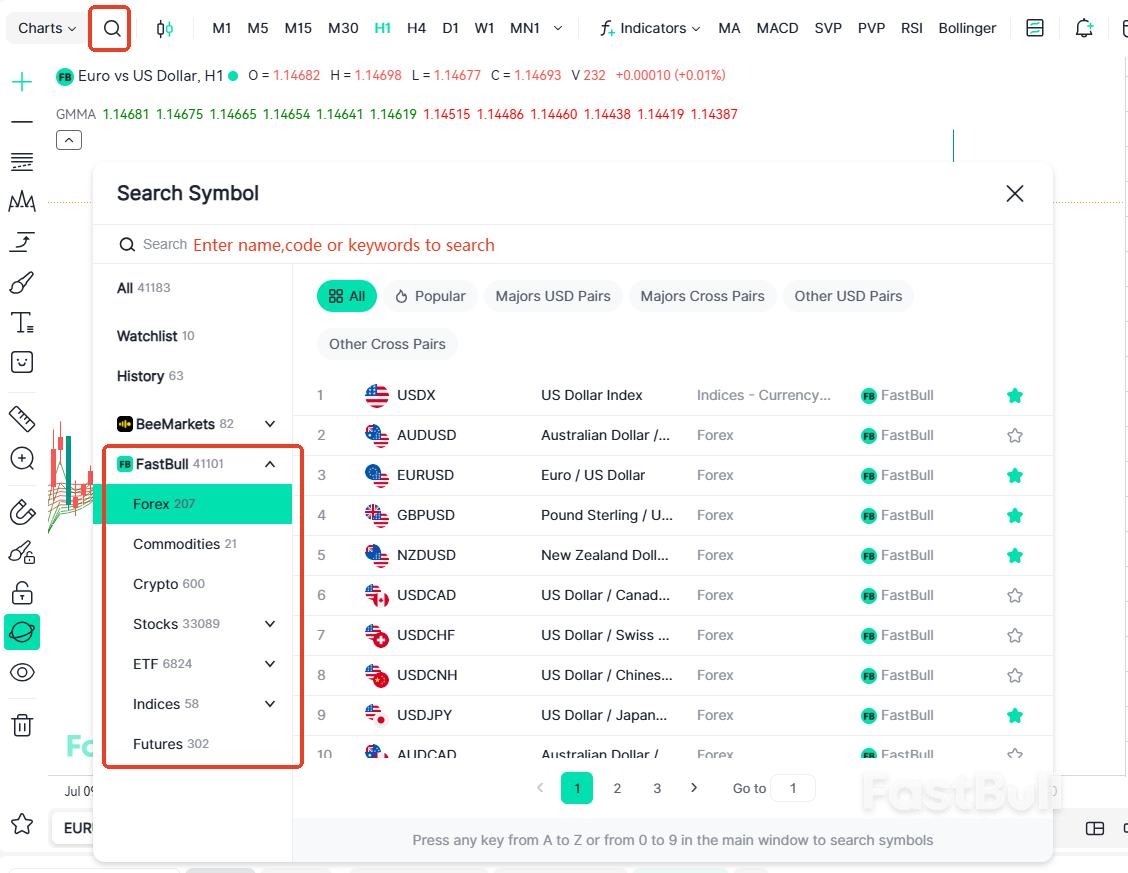
- Common Search Methods: Enter a trading symbol such as EURUSD, XAUUSD, or BTCUSDT, or search by stock ticker to quickly find an instrument.
- Productivity Tip: Click the ⭐ Favorite icon to add frequently used instruments to your Watchlist for faster access and switching.
- For Multi-Market Traders: Open multiple chart tabs to keep markets such as Gold, the U.S. Dollar Index (DXY), Crude Oil, and major forex pairs available at the same time.
4.2 Switch Chart Types
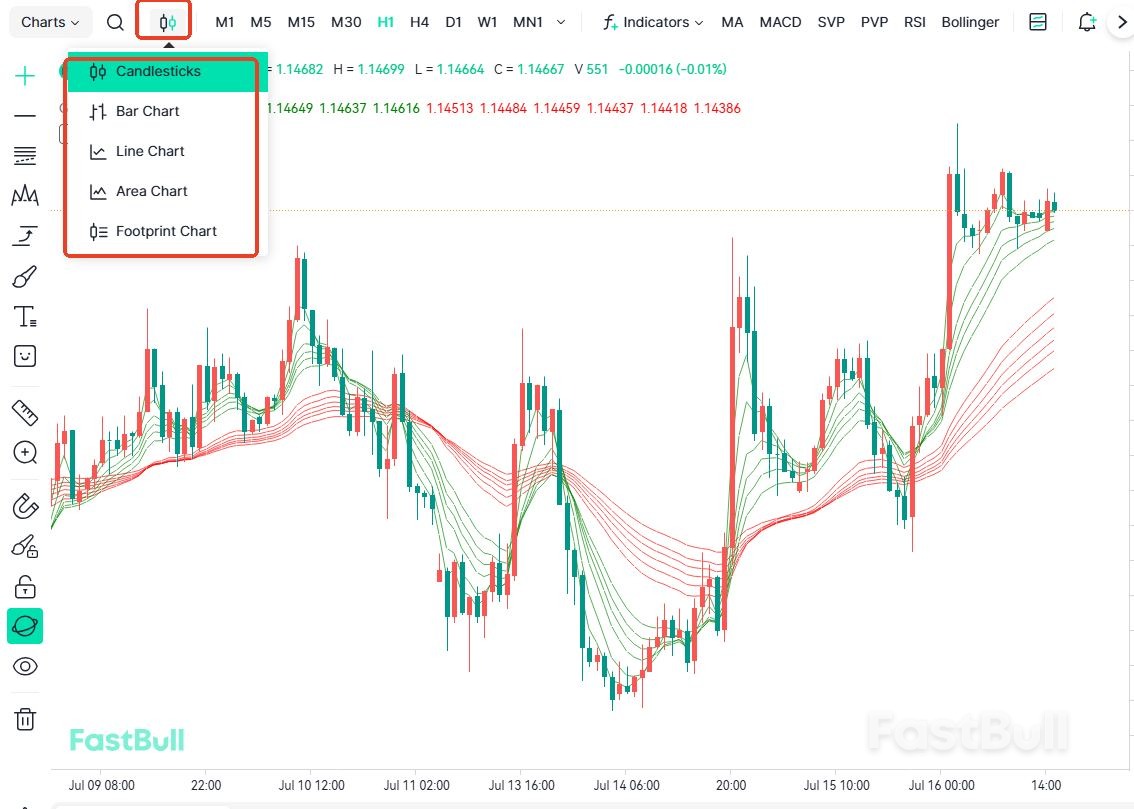
The chart type determines how price data is displayed and analyzed. For most beginners, Candlestick Charts are the best choice because they show the open, high, low, and close (OHLC) prices of each bar, making them ideal for learning price action and market structure.
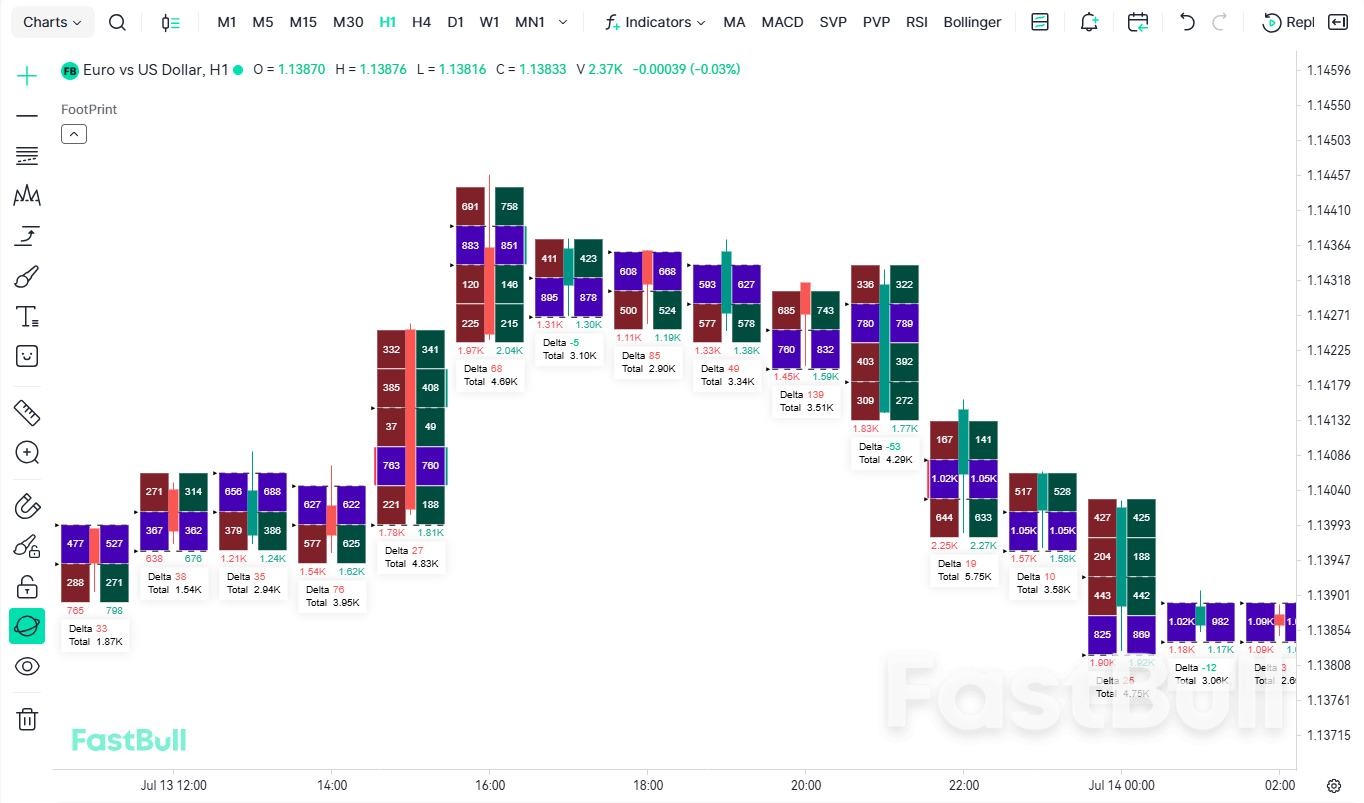
In addition to Candlestick Charts, FastBull also supports four other chart types - Bar Chart, Line Chart, Area Chart and Footprint Chart, allowing you to choose the visualization that best fits your trading style.
| Chart Type | Best For | Primary Use |
|---|---|---|
| Candlestick | Most beginners and technical analysts | Analyze trends, reversals, support and resistance, and candlestick patterns. |
| Line Chart | Traders who want a quick view of the market direction | Filter out some price noise and focus on the overall trend. |
| Bar Chart | Traditional technical analysts | Analyze the OHLC (Open, High, Low, Close) price structure. |
| Area Chart | Market overview and presentation scenarios | Provides a cleaner visual view for quickly understanding market trends. |
| Footprint Chart | Order flow traders and advanced traders | Analyze buy/sell volume, Delta, Imbalances, and liquidity changes, revealing market information that traditional candlestick charts cannot display. |
4.3 Switch and Customize Timeframes
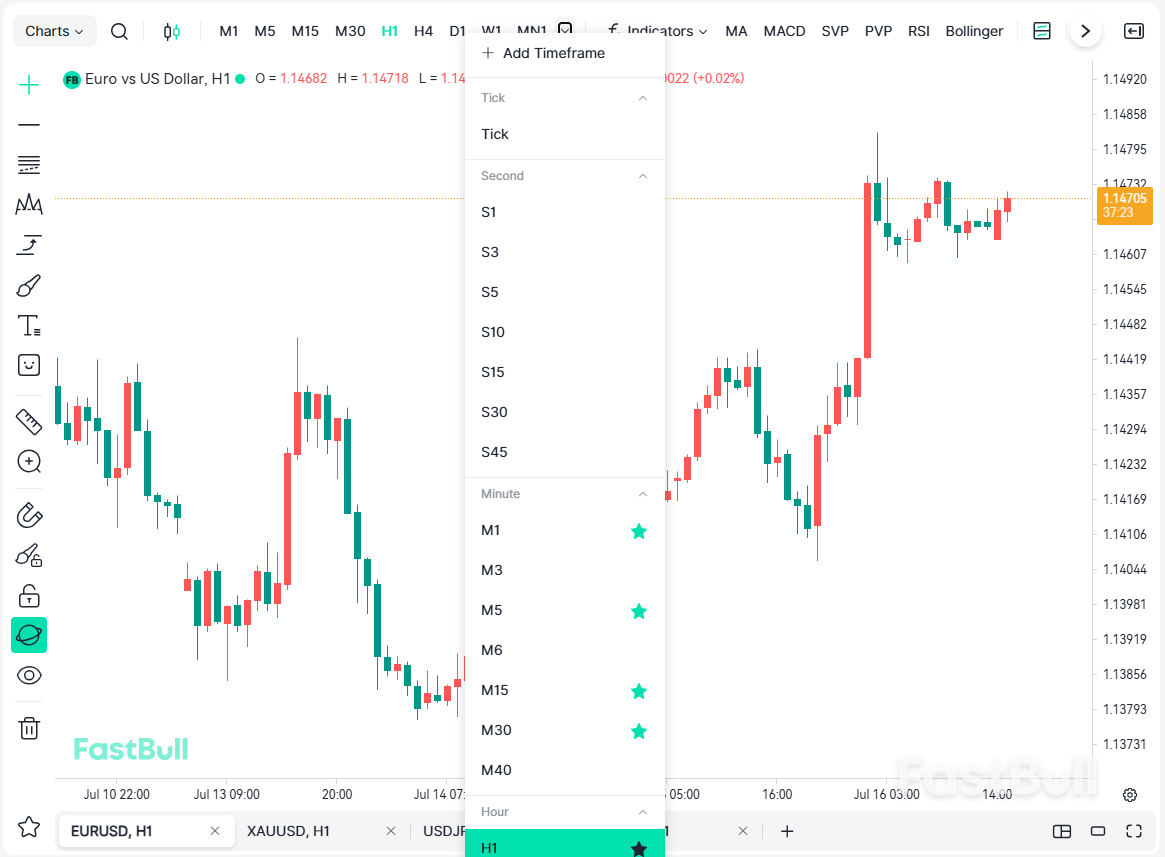
Choosing the right timeframe is essential for your trading strategy. Short-term traders typically focus on minute-based charts, while swing traders and long-term investors often analyze the 4-hour, daily, weekly, or monthly timeframes.
FastBull supports both preset and custom timeframes, giving you the flexibility to analyze the market exactly the way you want. You can also click the ⭐ Favorite icon to pin your most frequently used timeframes to the Top Toolbar for quick access.
Unlike many charting platforms, custom timeframes are available to all FastBull users at no cost—no subscription or membership is required.
Recommended Timeframes for Different Trading Styles
| Trading Style | Recommended Timeframes | Best Practices |
|---|---|---|
| Scalping | Tick, 1M, 3M, 5M | Use stop-loss orders, the Bar Countdown, and Price Alerts to help avoid overtrading. |
| Intraday Trading | 15M, 30M, 1H | Start with the 1H chart to identify the overall trend, then switch to the 15M chart to look for trade entry opportunities. |
| Swing Trading | 4H, Daily | Focus on the trend structure, pullback zones, and key support and resistance levels. |
| Medium- to Long-Term Trading | Weekly, Monthly | Use higher timeframes to identify major trends and important price zones. |
Tip — Multi-Timeframe Analysis: A common approach is to identify the trend on a higher timeframe and look for entry opportunities on a lower timeframe. For example, start with the Daily or 4H chart to confirm the overall market trend, then switch to the 15M or 1H chart to find more precise trade entry opportunities.
4.4 Add Technical Indicators and Save Templates
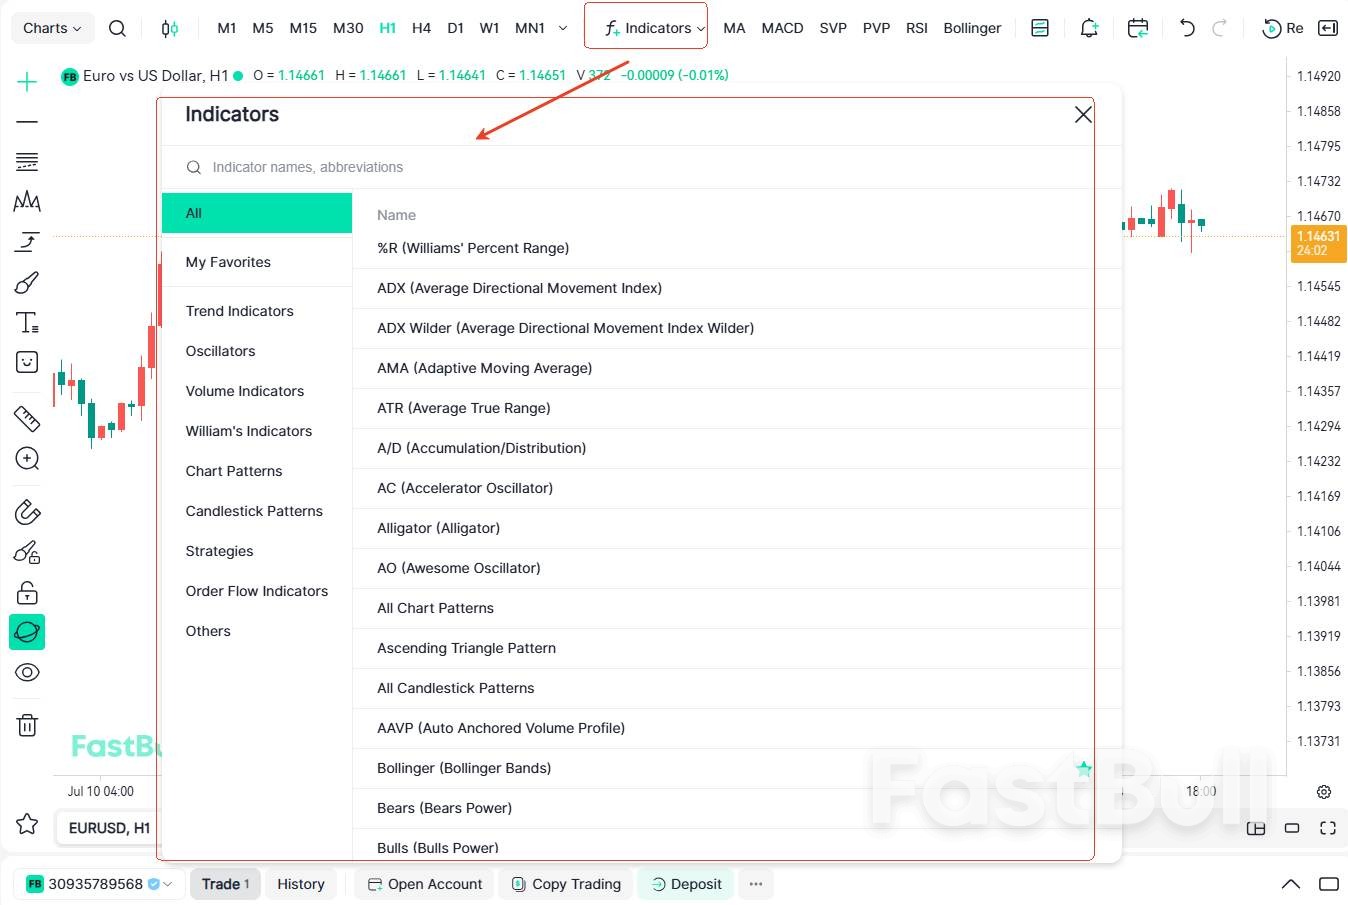
Technical indicators help traders analyze market trends, momentum, volatility, volume, and other key market conditions. Click Indicators on the Top Toolbar to search for and add popular indicators such as Moving Average (MA), MACD, RSI, Bollinger Bands, and VWAP. FastBull also offers hundreds of professional indicators, covering categories including trend, oscillator, volume, and order flow analysis.
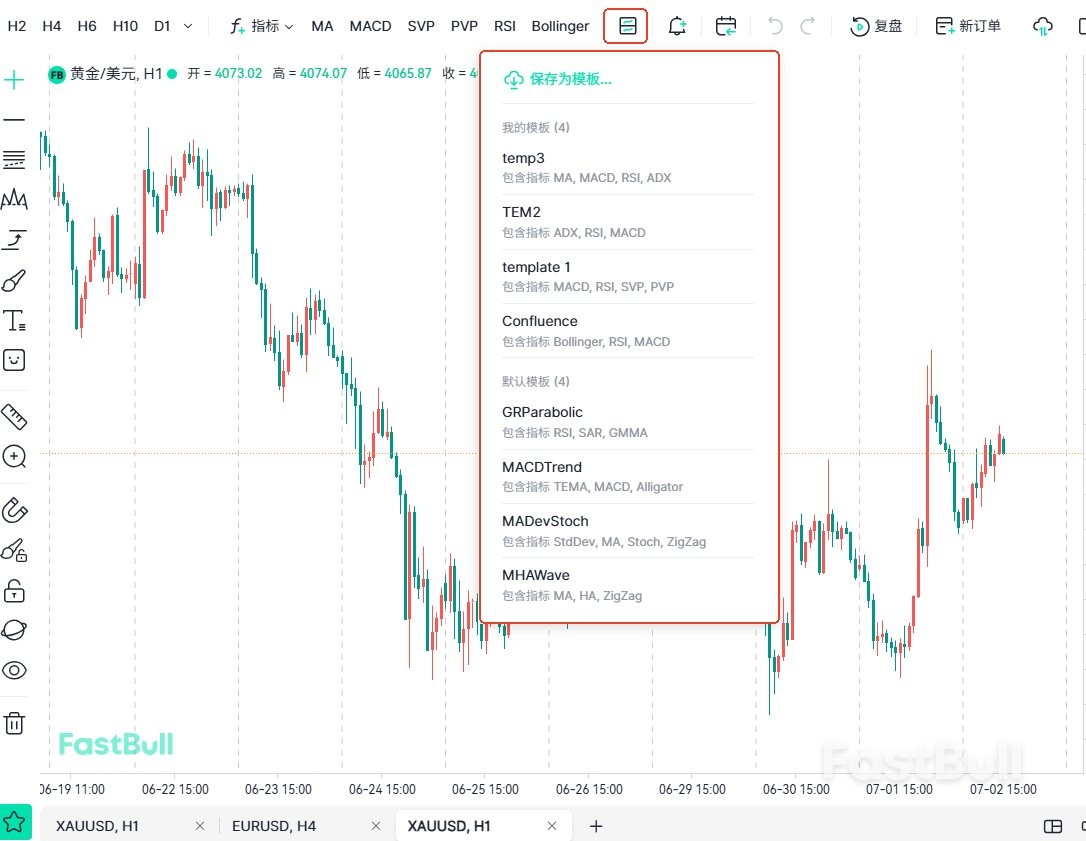
Once you've configured your preferred indicator setup, you can save it as a chart template and restore it with a single click the next time you open a chart — no need to add each indicator again. FastBull places no limit on the number of templates you can save, and custom indicators will be supported in future updates.
4.5 Set Price Alerts
Price Alerts are ideal for traders who can't monitor the markets continuously. You can set alerts at key support and resistance levels, or breakout points. When the alert is triggered, simply return to the chart and decide whether to take action.
Common use cases include:
- Monitoring potential breakout opportunities
- Tracking price levels before placing pending orders
- Receiving alerts at key levels for long-term positions
- Monitoring market movements during the night or outside working hours
4.6 Go to Historical Data
Click Jump to on the Top Toolbar, then select a specific date to instantly jump to the corresponding historical market data—without manually scrolling through the chart.
This feature is useful for reviewing major market events, analyzing historical price action, studying classic market setups, or replaying past trades.
The same Jump to function is also available on the Time Axis, allowing you to quickly navigate to any point in history using the method that best fits your workflow.
4.7 Bar Replay
Bar Replay lets you replay historical market data one candlestick at a time, hiding future price action so you can analyze and practice trading in a realistic market environment.
Click Bar Replay on the Top Toolbar, choose a starting date and playback speed, then begin the replay session. FastBull supports single-bar stepping, continuous playback, pause, fast-forward, and adjustable playback speeds, giving you full control over your review.
Bar Replay is commonly used for strategy backtesting, historical market analysis, and trading practice. Unlike many charting platforms, FastBull provides Bar Replay completely free of charge—no paid subscription or membership is required.
For detailed instructions, see the Bar Replay User Guide.
4.8 Paper Trading
FastBull includes a built-in Paper Trading feature that lets you practice trading in live market conditions without risking real money. Click New Order on the Top Toolbar to open the trading panel, where you can buy, sell, and set take-profit and stop-loss orders. Before using Paper Trading for the first time, you'll need to create a Paper Trading account. The setup process is covered later in the Bottom Toolbar section of this guide.
4.9 Instrument Analysis
Click Instrument Analysis on the Top Toolbar to view real-time quotes and key market data for the selected trading instrument, including the latest price, percentage change, daily high, and daily low. You can also view the performance of related instruments, making it easier to analyze correlations and market relationships across different assets. The panel also provides a quick access entry to Paper Trading, allowing you to place simulated buy or sell orders immediately after reviewing the instrument's key market information.
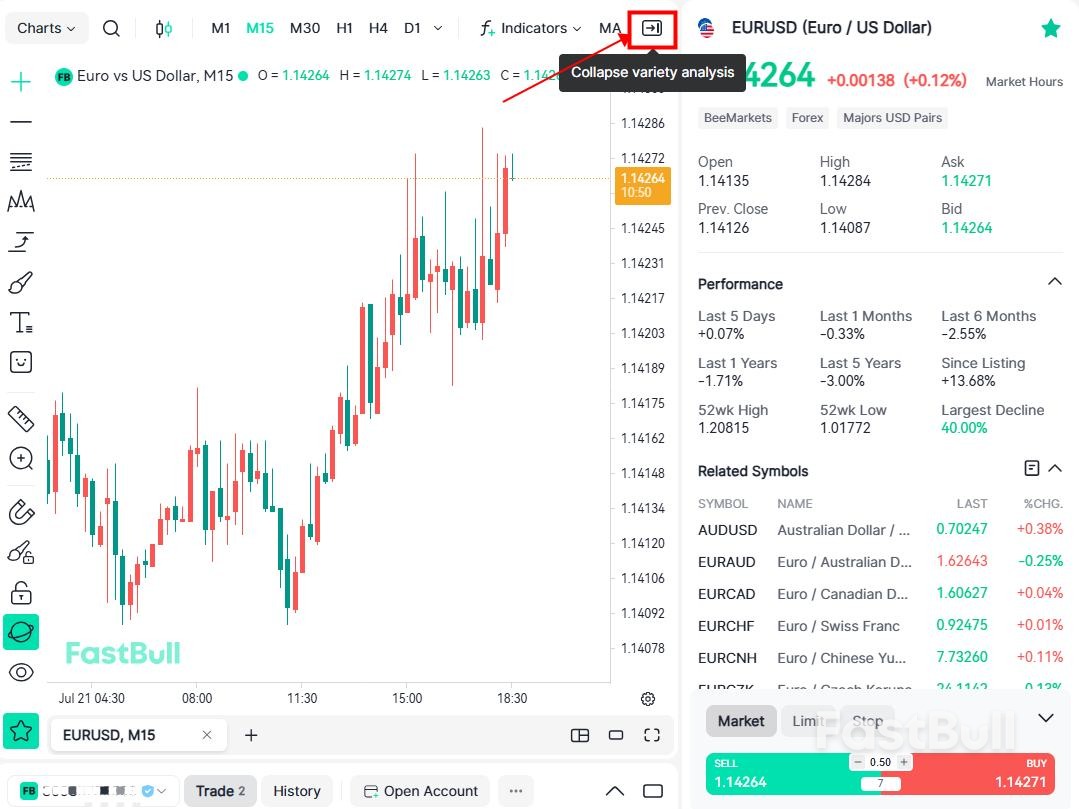
At this point, you've learned the core features of the Top Toolbar. Next, we'll explore the Drawing Toolbar, where you'll learn how to use trend lines, Fibonacci tools, chart patterns, and other drawing tools to perform more advanced technical analysis.
5.Drawing Tools: Trend Lines, Fibonacci, Elliott Wave, Risk/Reward, Annotations, and More
The Drawing Tools Toolbar is the core area for technical analysis and chart annotation in FastBull Chart. It includes a comprehensive set of tools such as trend lines, Fibonacci tools, Gann tools, chart pattern tools, Elliott Wave analysis, measurement tools, and text annotations, enabling everything from basic chart analysis to advanced professional trading workflows.
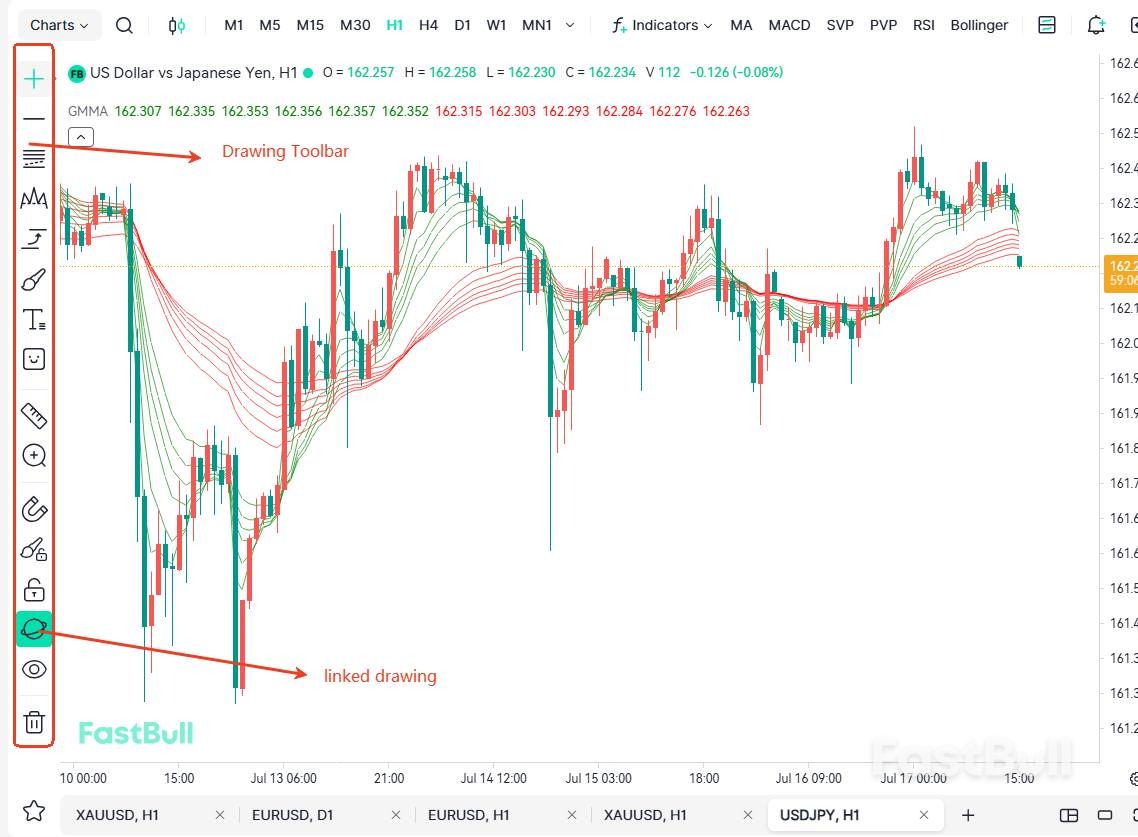
5.1 Cursor Tools
When you open FastBull Chart, the default cursor mode is Crosshair, which displays the time, price, and cursor position for the current candlestick, making it easy to inspect market data with precision.
In addition to Crosshair, FastBull offers several other cursor modes - Dot, Arrow, Eraser that you can switch between based on your trading style and analysis needs.
5.2 Drawing Tools
Drawing tools are among the most frequently used features in technical analysis. They help you identify trends, support and resistance levels, channels, and market structure, making it easier to interpret price action. FastBull groups its drawing tools into three main categories:
- Line Tools: Trend Line, Horizontal Line, Ray, Extended Line, Vertical Line, and more, for marking trends and key price levels.
- Channel Tools: Parallel Channel, Regression Channel, Trend Channel, and other tools for analyzing price ranges and identifying potential breakout areas.
- Pitchfork Tools: Multiple Pitchfork variations for analyzing trend direction, dynamic support and resistance, and price channels.
Tip: To duplicate a drawing, simply hold down the Ctrl key and drag the selected object. This allows you to quickly create a copy without redrawing it.
5.3 Fibonacci and Gann Tools
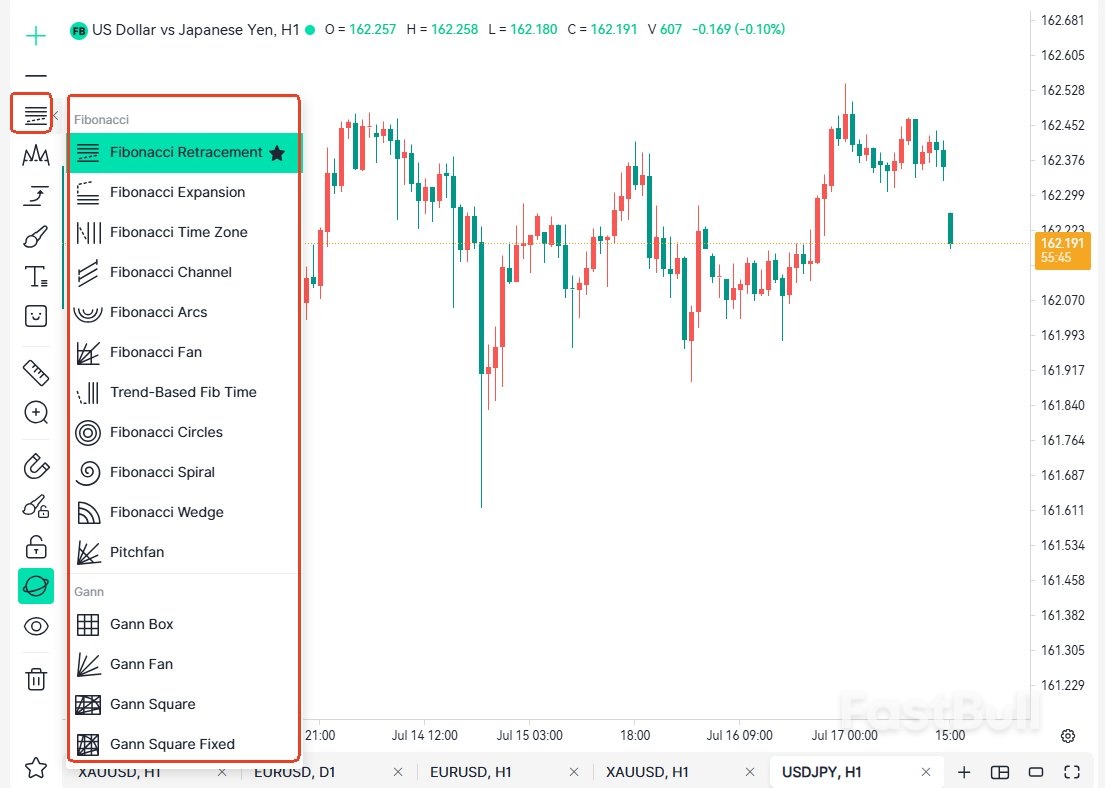
Fibonacci and Gann tools are widely used to identify support and resistance levels, price targets, and the relationship between price and time. They are essential drawing tools for many technical analysts. Click Fibonacci & Gann Tools on the Left Toolbar to access and apply the available tools to your chart.
FastBull provides 11 Fibonacci tools and 4 Gann tools, including Fibonacci Retracement, Fibonacci Extension, Fibonacci Fan, Fibonacci Time Zones, Gann Fan, and Gann Box. Among them, Fibonacci Retracement is one of the most widely used tools — traders commonly focus on key retracement levels such as 23.6%, 38.2%, 50%, 61.8%, and 78.6% when identifying potential pullback and reversal zones.
5.4 Chart Patterns, Elliott Wave, and Cycle Tools
Chart Pattern, Elliott Wave, and Cycle tools help traders identify market structure, analyze trend development, and study the relationship between price and time. Click the corresponding category on the Left Toolbar to select and apply Chart Pattern, Elliott Wave, or Cycle tools to your chart.
FastBull offers a comprehensive collection of pattern analysis tools, including ABCD, Head & Shoulders, Triangle, and harmonic patterns such as Cypher. For wave analysis, FastBull provides a complete set of Elliott Wave drawing tools, supporting Impulse Waves, Corrective Waves, and multi-timeframe wave analysis. The platform also includes Cycle analysis tools such as Cycle Lines, Time Cycles, and Sine Lines, which can be used to analyze market rhythm and identify potential timing windows.
Together, these tools are ideal for market structure analysis, trend evaluation, and cycle analysis, helping traders visualize market behavior and develop more comprehensive trading scenarios.
5.5 Forecasting and Quantitative Tools
Forecasting and Quantitative tools help traders build more objective trading plans by visualizing risk, profit targets, market cost levels, and price movement projections. Click Forecasting & Quantitative Tools on the Left Drawing Toolbar to select and add the desired tool to your chart.
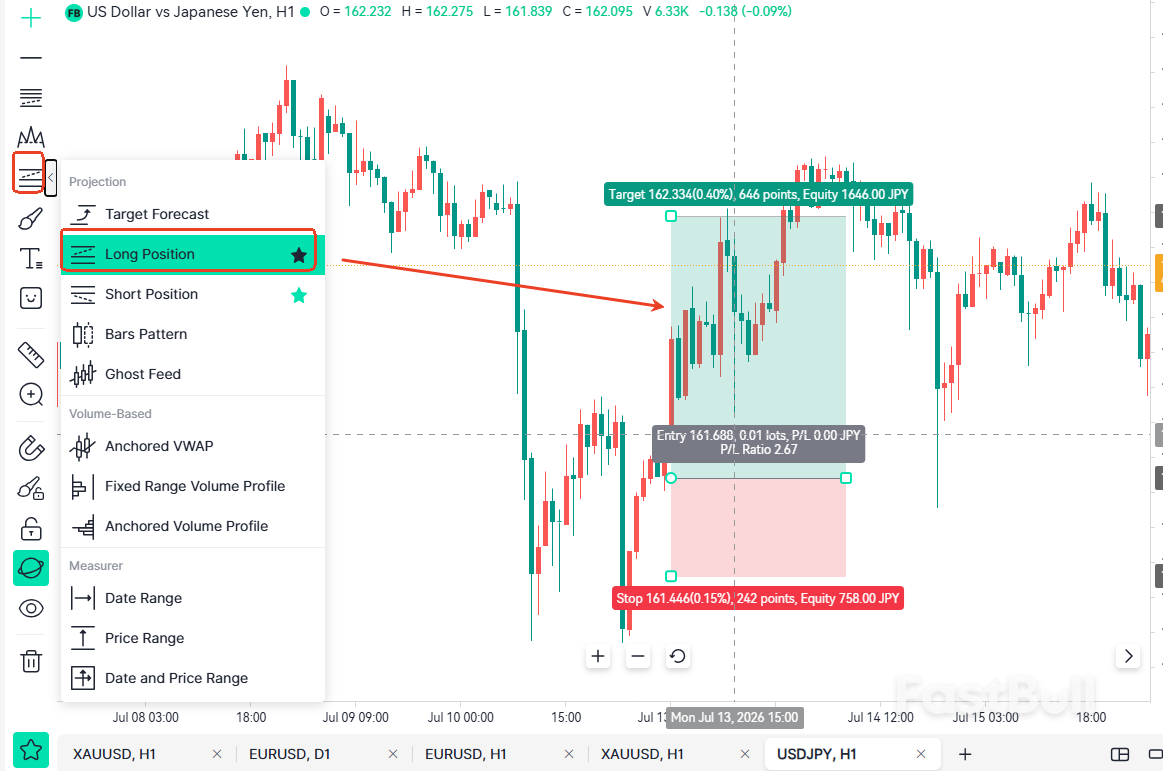
5.5.1 Long / Short Position
The Risk/Reward Ratio tool allows you to quickly plan and evaluate a trade directly on the chart. Select either the Long Position or Short Position tool, then drag it to define your entry price, stop-loss, and take-profit levels. FastBull will automatically calculate the risk/reward ratio, potential profit, and potential loss, helping you assess the risk and reward of each trade before entering the market.
5.5.2 Price Target and Candlestick Forecast Tools
The Price Target tool helps you mark trend targets, take-profit zones, and swing trading objectives. The Candlestick Forecast tool allows you to project future price action and compare it with historical candlestick patterns — useful for documenting your market outlook and later reviewing your forecasts during post-trade analysis or Bar Replay.
5.5.3 Anchored VWAP and Volume Profile
FastBull provides professional market analysis tools such as Anchored VWAP and Volume Profile. Anchored VWAP calculates the average traded price from any user-defined starting point, helping traders identify dynamic support and resistance, evaluate market positioning, and assess trend strength. Volume Profile supports both Fixed Range and Anchored modes, allowing you to quickly identify the Point of Control (POC), High Volume Nodes (HVN), Low Volume Nodes (LVN), and other key areas where trading activity is concentrated.
5.5.4 Measurement Tools
FastBull also provides three Measurement Tools: Time Measurement, Price Measurement, and Time & Price Measurement. These tools allow you to quickly measure the number of candlesticks, time span, price movement, and percentage change between two points on the chart — especially useful for historical market analysis, volatility measurement, and trade review.
5.6 Annotation and Shape Tools
Annotation and Shape tools help traders record trading ideas, highlight key market areas, and make chart analysis more intuitive. Click Annotation & Shape Tools on the Left Toolbar to access tools such as the Freehand Brush, Highlighter, Arrow, Rectangle, Circle, Polygon, and other drawing shapes.
These tools are commonly used to mark Order Blocks, Supply & Demand Zones, Fair Value Gaps (FVGs), Liquidity Zones, support and resistance levels, and potential entry and exit areas — especially useful for trade reviews, strategy refinement, and sharing market analysis with others.
Tip: Use a consistent color scheme for different types of analysis — for example, green for support, red for resistance, blue for Order Blocks, and yellow for important market events. A standardized color system improves chart readability and makes it easier to identify different analytical elements at a glance.
5.7 Text and Annotation Tools
Text and Annotation tools allow traders to document market analysis, trading plans, and chart notes, creating a complete record of every trading idea. Click Text & Annotation Tools on the Left Toolbar to add Text, Anchored Text, Text Boxes, Callouts, Labels, Price Labels, Candlestick Markers, and Images to your chart.
These tools are ideal for recording trade setups, market structure analysis, the impact of news events, trading plans, and post-trade reviews. Even if you revisit the chart weeks or months later, your notes make it easy to understand your original analysis and continuously improve your trading approach.
Tip: If you regularly review your trades, consider adding a brief note after each analysis — for example, your entry rationale, stop-loss logic, take-profit target, or market context. Building this habit over time can help you identify patterns, learn from past trades, and refine your trading system.
5.8 Chart Assistance Tools
The bottom section of the Left Drawing Toolbar provides a range of Chart Assistance Tools designed to improve your drawing workflow and overall charting experience. Simply click the corresponding icon to quickly enable or disable each feature. Among these, the following tools are the most commonly used:
- Measure Tool: Quickly measure price movement, percentage change, pips, the number of candlesticks, and time span. Ideal for analyzing market volatility, estimating price targets, and reviewing past trades.
- Magnet Tool: When enabled, drawing objects automatically snap to the Open, High, Low, or Close (OHLC) of each candlestick, making it easier to draw trend lines, support and resistance levels, and Fibonacci tools with greater precision.
- Hide Drawings (Eye Icon): Instantly hide or restore all drawings and annotations with a single click — useful for viewing a clean chart, checking market structure, or taking chart screenshots to share with others.
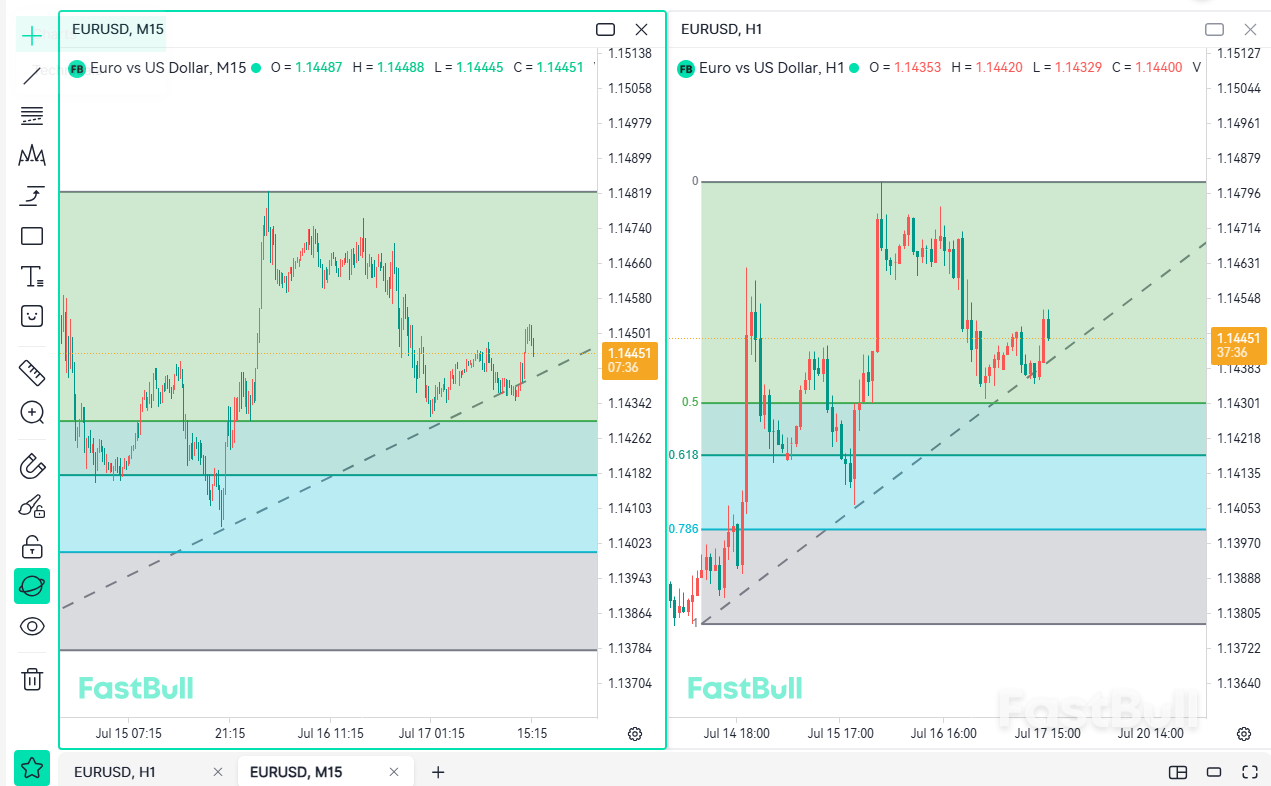
- Linkedin Drawings (Globe Icon): When enabled, drawings, technical indicators, and chart styles are automatically synchronized across different timeframes for the same trading instrument, eliminating the need to recreate your analysis and making multi-timeframe analysis far easier.
For example, if you've drawn trend lines and support and resistance levels on the EUR/USD Daily chart, they will automatically appear when you switch to the 4H, 1H, or 15M chart, allowing you to refine your trade entries across multiple timeframes without redrawing your analysis.
5.9 Save Your Chart Analysis
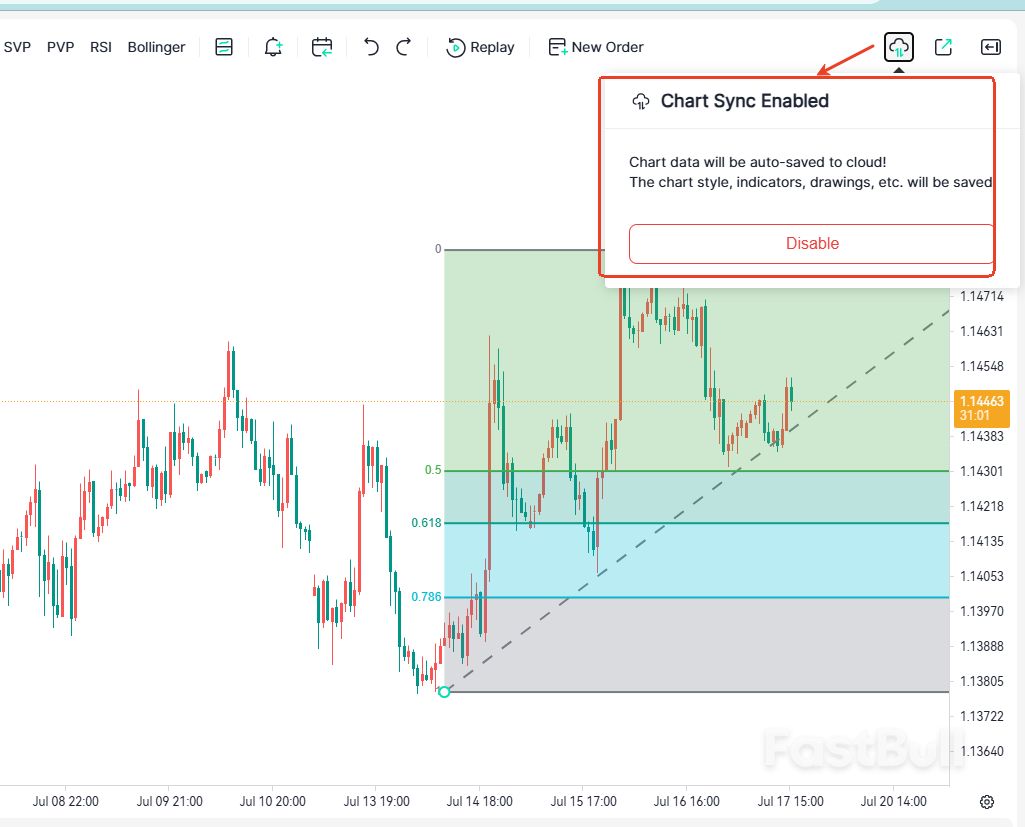
If you want to save your chart analysis and keep it synchronized across Web, Windows PC, and mobile devices, you'll need to sign in to your FastBull account and enable Cloud Sync.
Once Cloud Sync is enabled, your drawings, technical indicators, chart templates, layouts, chart styles, and personal preferences are automatically saved to the cloud. The next time you open a chart or switch to another device, you can continue your analysis without having to set everything up again.
If you're not signed in or Cloud Sync is disabled, your chart analysis will not be saved after closing the chart or switching to a different trading instrument.
Bottom Toolbar
The Bottom Toolbar is primarily used to manage multiple charts, switch chart layouts, and customize chart display settings. It is especially useful for traders who analyze multiple trading instruments or multiple timeframes at the same time.
6.1 Chart Tabs
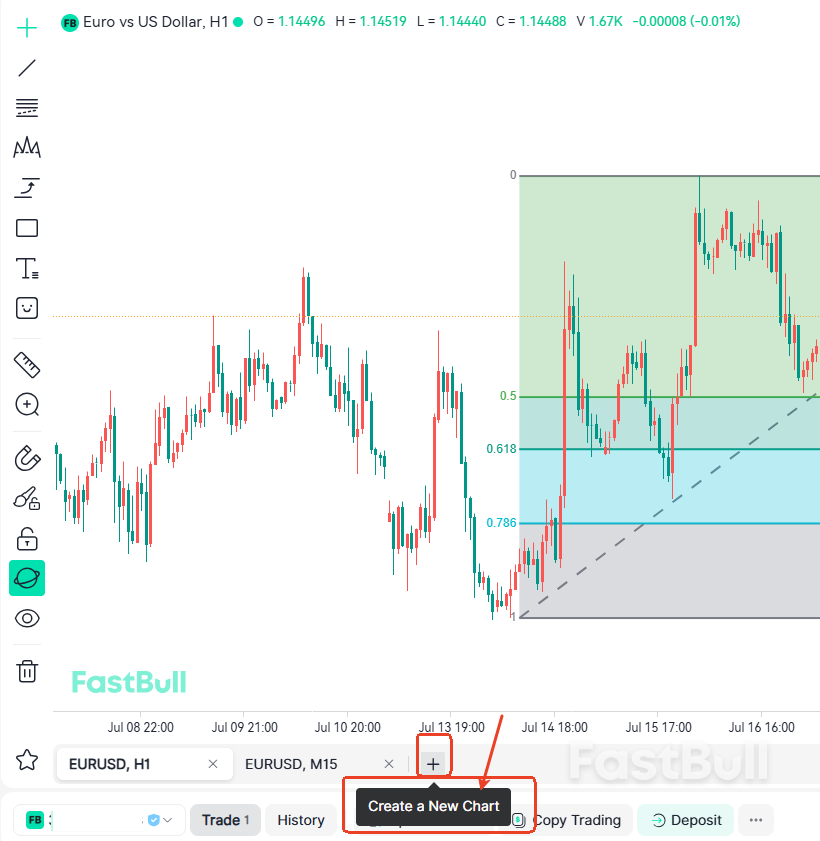
Each time you open a new trading instrument, FastBull creates a new Chart Tab, allowing you to switch between charts with a single click.
To open another chart, click the "+" button on the right side of the Chart Tabs bar.
Using multiple Chart Tabs lets you keep the analysis of different instruments or timeframes open simultaneously, eliminating the need to repeatedly switch back and forth on a single chart and making market analysis more efficient.
6.2 Multi-Chart Layouts
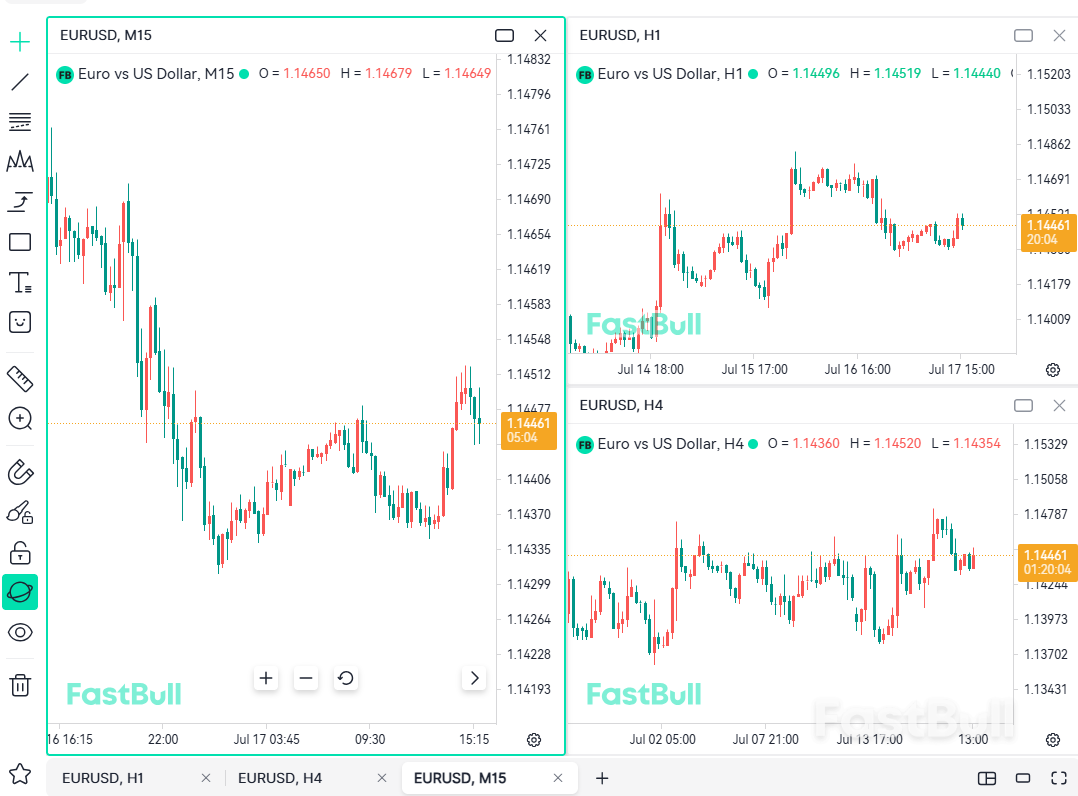
Multi-Chart Layouts allow you to display multiple charts simultaneously. You can choose from various layouts, such as 2-chart or 4-chart views, making it easy to monitor multiple trading instruments or perform multi-timeframe analysis on the same instrument.
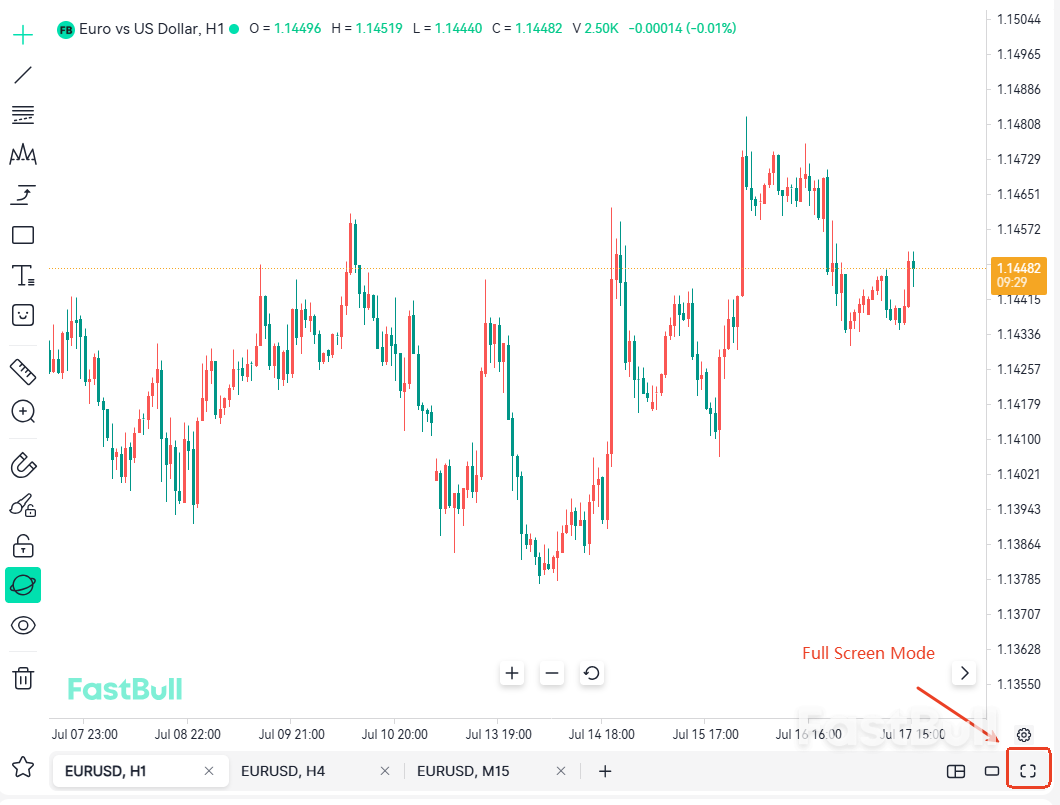
6.3 Full Screen Mode
Click the Full Screen button to enter an immersive charting view, hiding other interface elements and maximizing the chart display area. This provides more space to analyze candlestick details, price action, and market structure with greater clarity.
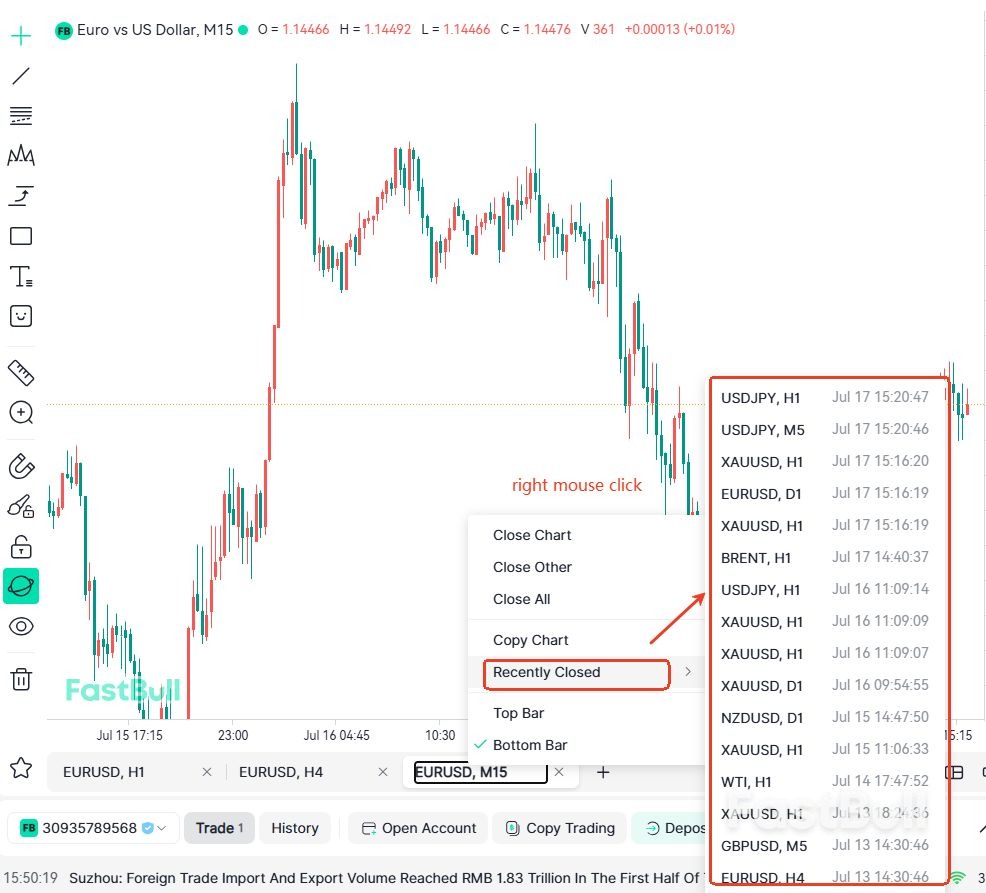
6.4 Open Recently Closed Charts
If you accidentally close a chart or want to restore a previously analyzed chart, right-click an instrument at Chart Tab and select Recently Closed Charts to reopen it without searching for the trading instrument again.
To restore your drawings, indicators, and other analysis, Cloud Sync must be enabled. Otherwise, any unsaved chart analysis cannot be recovered after the chart is closed.
6.5 Create a Paper Tradign Account
Before using Paper Trading for the first time, you'll need to create a Paper Trading account.
After signing in to your FastBull account, click Add Trading Account or Open an Account on the Bottom Toolbar, then follow the on-screen instructions to complete the setup.
Once your account has been created, you can access Paper Trading from the Top Toolbar or the Instrument Details panel to place simulated trades, practice your trading strategies, and become familiar with the trading workflow.
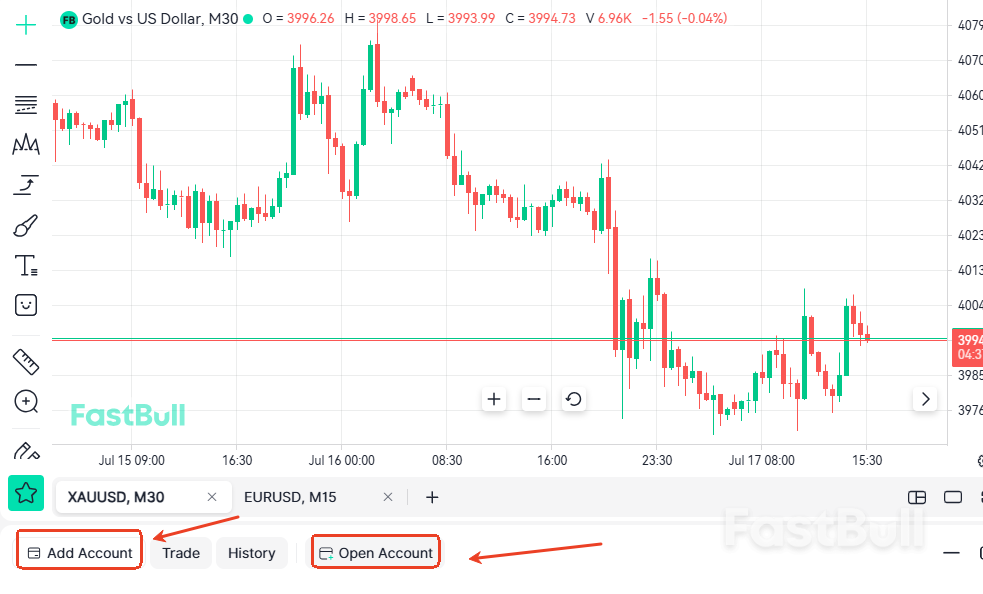
Chart Settings and Tips
7.1 Quickly Jump to a Specific Date
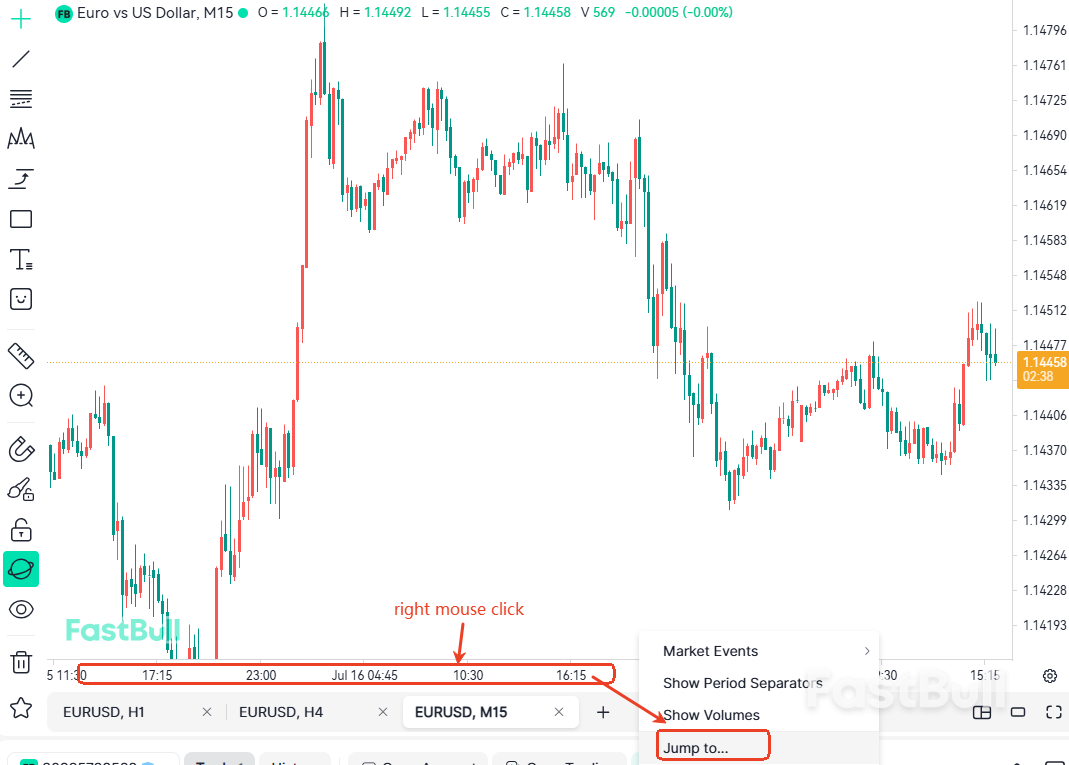
If you want to review the market on a specific date or revisit a historical event, you can quickly navigate to the desired point in time using the timeline.
Simply right-click the Time Axis at the bottom of the chart and select Jump to to jump directly to the specified date, without manually scrolling through historical data.
The Go to Historical Bar feature on the Top Toolbar provides the same functionality. You can use either entry point based on your preferred workflow.
7.2 Enable the Bar Countdown
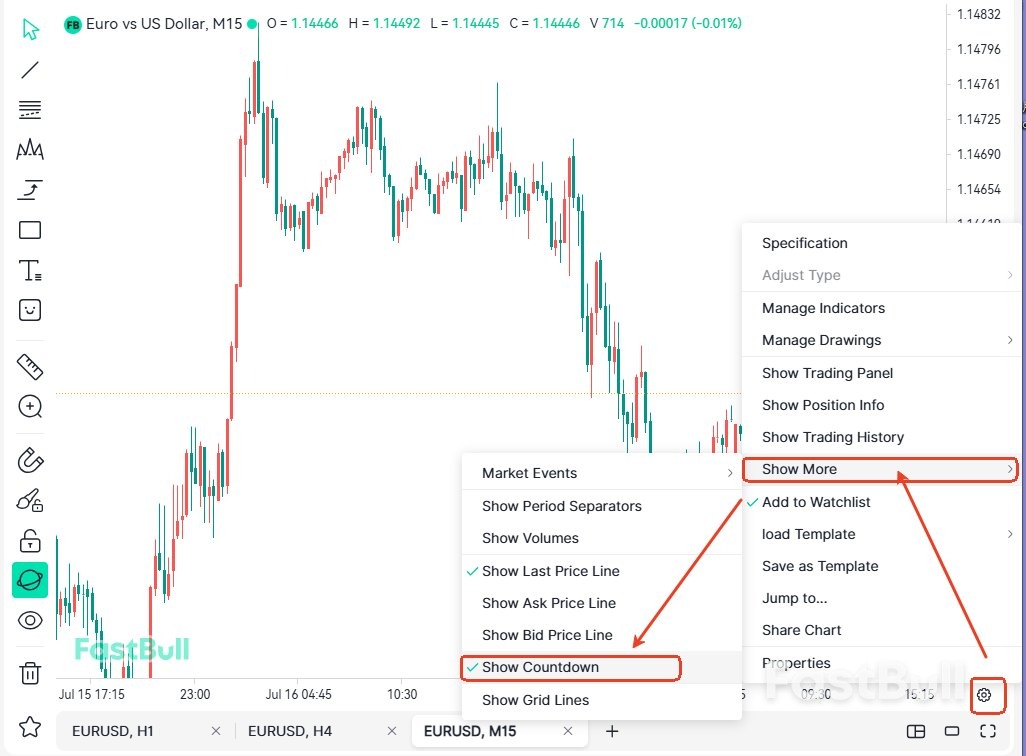
The Bar Countdown displays the remaining time before the current candlestick closes, helping you better track market timing and the formation of each bar. To enable it, go to Chart Settings → More Display Options → Show Bar Countdown. This feature is especially useful for scalpers, intraday traders, and anyone who relies on candlestick close confirmations before making trading decisions.
7.3 Auto Scale the Price Axis
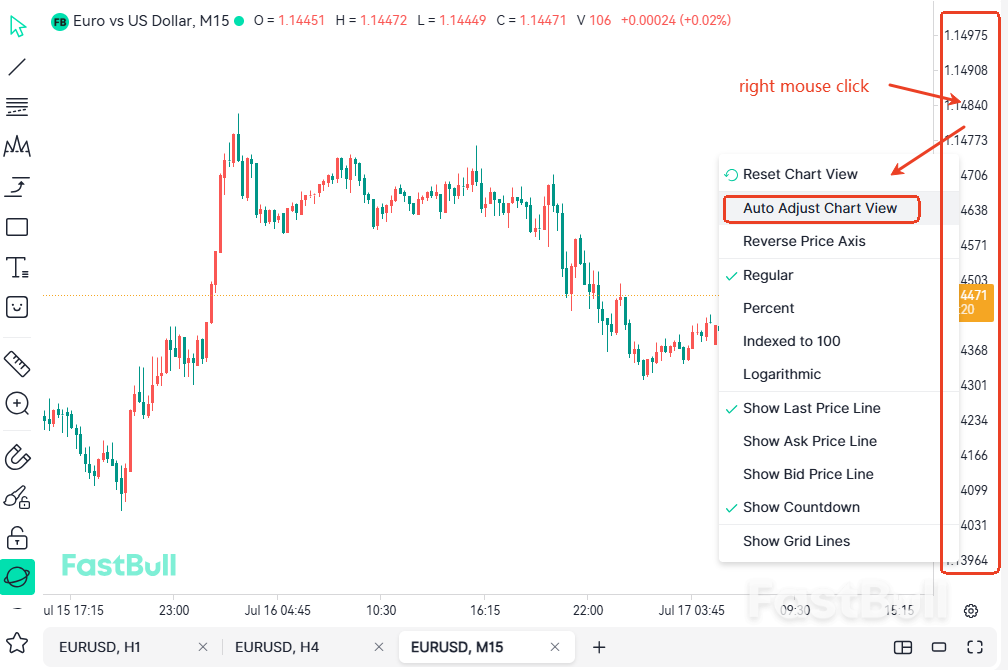
If the price scale becomes distorted after manually moving or zooming the chart, you can quickly restore the default view using Auto Scale. Simply right-click the price axis and select Auto Scale to automatically adjust the price scale to fit the current chart view.
7.4 Change the Chart Time Zone
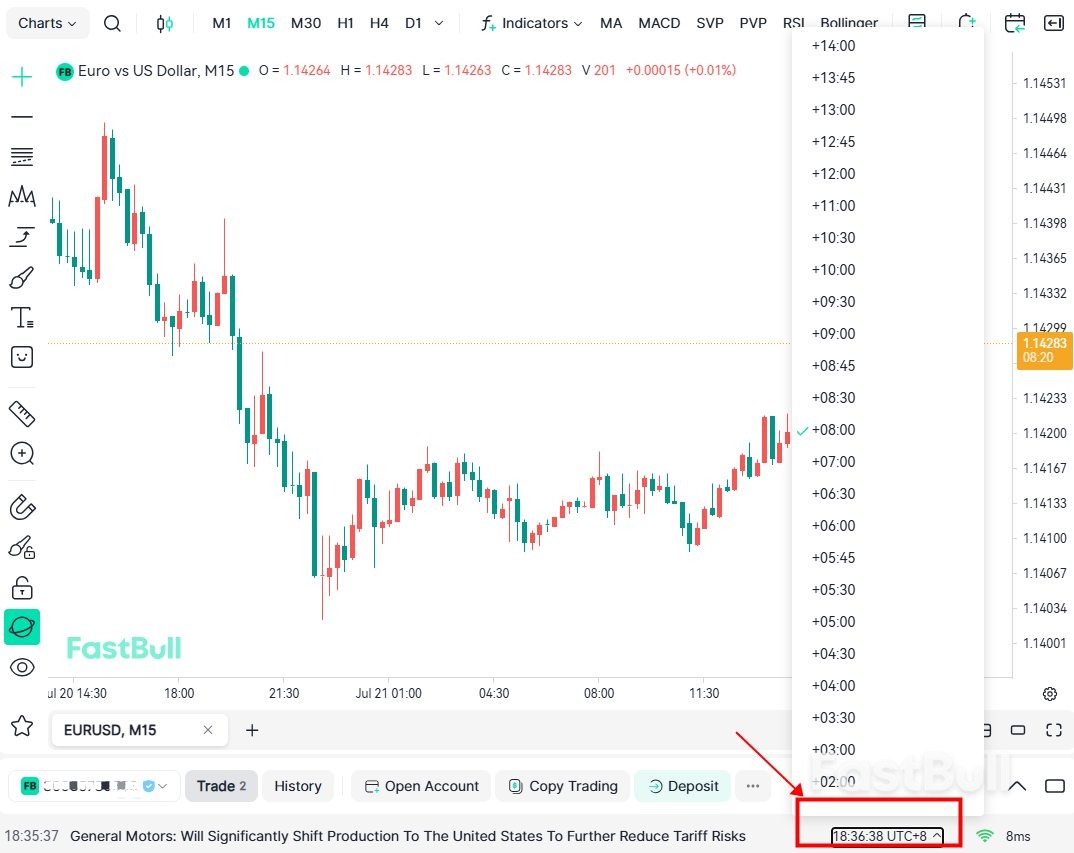
FastBull allows you to customize the chart time zone, making it easy to match the time settings of different trading platforms or financial markets. Click the current time zone displayed in the bottom-right corner of the chart to select a different time zone.
If you use multiple trading platforms, keeping the same chart time zone across all of them can help avoid confusion and ensure more consistent market analysis.
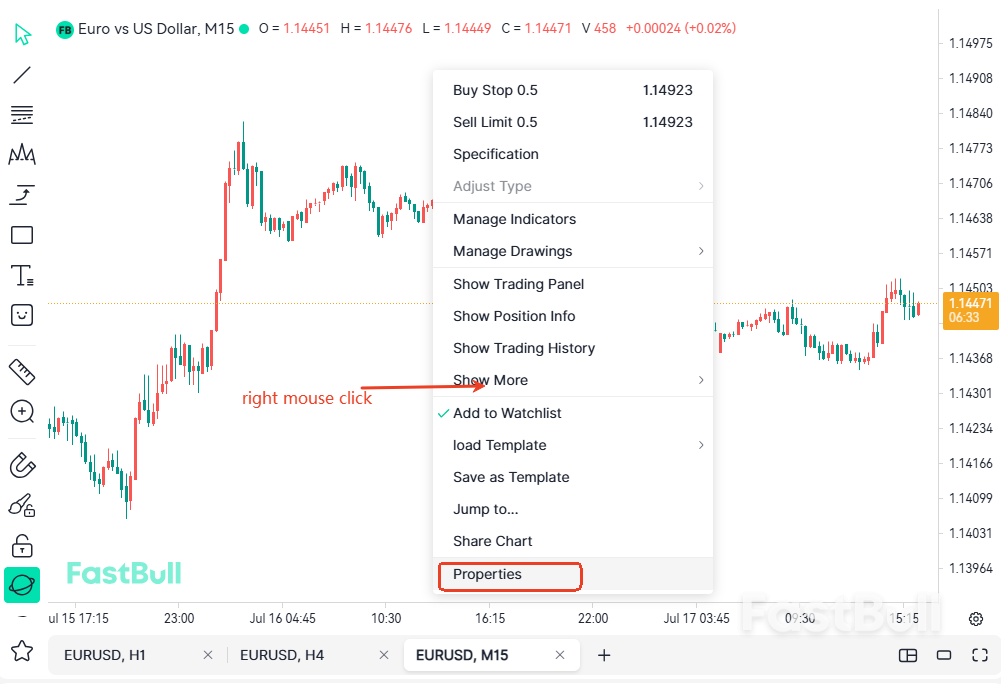
In addition to the settings above, FastBull offers a wide range of chart display options, including grid lines, axes, price labels, trading sessions, candlestick colors, and more. You can customize these settings at any time in Chart Settings to create a chart layout that best matches your trading style and personal preferences.
New to FastBull? Start with These Essential Settings
If you're using FastBull Chart for the first time, we recommend completing the following setup steps and becoming familiar with a few key features to get the best charting experience:
- Sign in to your FastBull account and enable Cloud Sync
- Add your frequently traded instruments and timeframes to Favorites
- Save your preferred technical indicator templates
- Set Price Alerts so you never miss important market movements
- Explore Bar Replay to practice and refine your trading strategies
- Use Multi-Chart Layouts for multi-timeframe analysis
- Enable the Bar Countdown (especially useful for short-term trading)
- Turn on Magnet Mode for more precise chart drawing
- Learn how to use Recently Closed Charts to quickly restore previous analysis
Once you've completed these settings, you'll be able to analyze the markets more efficiently, build structured trading plans, and continuously improve your trading skills through Bar Replay and Paper Trading.
8. Qoutes & Toolbar (Your All-in-One Trading Workspace Beyond the Chart)
In addition to its powerful charting tools, FastBull integrates trading, market quotes, financial news, the Economic Calendar, and the trading community into the Sidebar. This allows you to analyze the markets, stay informed, and engage with other traders—all without leaving the chart.
8.1 Trading
The Trading section helps you manage your Watchlist. You can add frequently traded instruments to your Watchlist and rearrange them for quicker access. If you've connected a FastBull-supported broker, you can also access trading-related features directly from this panel.
8.2 Market Quotes
The Market Quotes section provides real-time market data across global financial markets, including forex, precious metals, commodities, cryptocurrencies, stocks, indices, and funds. In addition to the latest prices, you can view key market data such as percentage change, opening price, daily high, and daily low, helping you stay on top of market movements.
8.3 Copy Trading
The Copy Trading section allows you to explore the performance of traders and trading strategies, and follow trading signals that interest you as a reference for market analysis and learning. This feature is continuously evolving, with more strategy insights and performance data planned for future updates.
8.4 Trading Contests
The Trading Contests section showcases FastBull's official trading competitions.
During an active event, you can view contest details, register to participate, track the leaderboard, and review the prize structure and competition rules.
8.5 News
The News section delivers 24/7 real-time financial news, covering central bank decisions, economic data releases, geopolitical developments, and other major market-moving events, helping you understand the drivers behind market movements.
8.6 Economic Calendar
The Economic Calendar tracks major global economic events and data releases, including interest rate decisions, Non-Farm Payrolls (NFP), CPI, GDP, PMI, and more. Each event includes the release time, forecast, previous value, and actual result, helping you prepare your trading strategy ahead of key market events.
8.7 Q&A
The Q&A section is FastBull's trading community, where users can ask trading-related questions, exchange ideas with other traders, and learn from expert insights and answers to popular market topics.
8.8 Chat
The Chat section provides a real-time trading chat room where traders from around the world share market insights, technical analysis, and trading opportunities. Join the conversation to exchange ideas, learn from other traders, and gain diverse perspectives on the financial markets.
FastBull Chart FAQ
Q1Is FastBull Chart free to use?
Q2Is FastBull a broker?
Q3Do I need to open a broker account before using FastBull Chart?
Q4Why weren't my drawings and indicators saved?
Q5Which platforms does FastBull support?
Q6I'm new to trading. Which FastBull features should I learn first?
Conclusion
FastBull offers a comprehensive suite of free charting and trading analysis tools, covering everything from trading instruments, timeframes, and technical indicators to professional drawing tools, Bar Replay, Multi-Chart Layouts, and Cloud Sync. We hope this guide has helped you quickly become familiar with the core features of FastBull Chart. With these tools at your fingertips, you'll be able to analyze the markets more efficiently, develop well-structured trading plans, and build a trading workflow that suits your own strategy and style.
Ready to start analyzing the markets?
No sign-up, no download — open FastBull Chart in your browser and view real-time markets worldwide.
Open FastBull Chart →