

行情
新闻
分析
用户
快讯
财经日历
学习
数据
- 名称
- 最新值
- 前值


VIP跟单
所有跟单
所有比赛
 英国对非欧盟贸易账 (季调后) (10月)
公:--
预: --
前: --
英国贸易账 (10月)公:--
预: --
前: --
英国服务业指数月率公:--
预: --
前: --
英国建筑业产出月率 (季调后) (10月)公:--
预: --
前: --
英国工业产出年率 (10月)公:--
预: --
前: --
英国贸易账 (季调后) (10月)公:--
预: --
前: --
英国对欧盟贸易账 (季调后) (10月)公:--
预: --
前: --
英国制造业产出年率 (10月)公:--
预: --
前: --
英国GDP月率 (10月)公:--
预: --
前: --
英国GDP年率 (季调后) (10月)公:--
预: --
前: --
英国工业产出月率 (10月)公:--
预: --
前: --
英国建筑业产出年率 (10月)公:--
预: --
前: --
 法国HICP月率终值 (11月)
公:--
预: --
前: --
 中国大陆未偿还贷款增长年率 (11月)
公:--
预: --
前: --
中国大陆M2货币供应量年率 (11月)公:--
预: --
前: --
中国大陆M0货币供应量年率 (11月)公:--
预: --
前: --
中国大陆M1货币供应量年率 (11月)公:--
预: --
前: --
 印度CPI年率 (11月)
公:--
预: --
前: --
印度存款增长年率公:--
预: --
前: --
 巴西服务业增长年率 (10月)
公:--
预: --
前: --
 墨西哥工业产值年率 (10月)
公:--
预: --
前: --
 俄罗斯贸易账 (10月)
公:--
预: --
前: --
 费城联储主席保尔森发表讲话
 加拿大营建许可月率 (季调后) (10月)
公:--
预: --
前: --
加拿大批发销售年率 (10月)公:--
预: --
前: --
加拿大批发库存月率 (10月)公:--
预: --
前: --
加拿大批发库存年率 (10月)公:--
预: --
前: --
加拿大批发销售月率 (季调后) (10月)公:--
预: --
前: --
 德国经常账 (未季调) (10月)
公:--
预: --
前: --
美国当周钻井总数公:--
预: --
前: --
美国当周石油钻井总数公:--
预: --
前: --
 日本短观大型非制造业景气判断指数 (第四季度)
--
预: --
前: --
日本短观小型制造业前景指数 (第四季度)--
预: --
前: --
日本短观大型非制造业前景指数 (第四季度)--
预: --
前: --
日本短观大型制造业前景指数 (第四季度)--
预: --
前: --
日本短观小型制造业景气判断指数 (第四季度)--
预: --
前: --
日本短观大型制造业景气判断指数 (第四季度)--
预: --
前: --
日本短观大型企业资本支出年率 (第四季度)--
预: --
前: --
英国Rightmove住宅销售价格指数年率 (12月)--
预: --
前: --
中国大陆工业产出年率 (年初至今) (11月)--
预: --
前: --
中国大陆城镇失业率 (11月)--
预: --
前: --
 沙特阿拉伯CPI年率 (11月)
--
预: --
前: --
 欧元区工业产出年率 (10月)
--
预: --
前: --
欧元区工业产出月率 (10月)--
预: --
前: --
加拿大成屋销售月率 (11月)--
预: --
前: --
欧元区储备资产总额 (11月)--
预: --
前: --
英国通胀预期--
预: --
前: --
加拿大全国经济信心指数--
预: --
前: --
加拿大新屋开工 (11月)--
预: --
前: --
美国纽约联储制造业就业指数 (12月)--
预: --
前: --
美国纽约联储制造业指数 (12月)--
预: --
前: --
加拿大核心CPI年率 (11月)--
预: --
前: --
加拿大制造业未完成订单月率 (10月)--
预: --
前: --
加拿大制造业新订单月率 (10月)--
预: --
前: --
加拿大核心CPI月率 (11月)--
预: --
前: --
加拿大制造业库存月率 (10月)--
预: --
前: --
加拿大CPI年率 (11月)--
预: --
前: --
加拿大CPI月率 (11月)--
预: --
前: --
加拿大CPI年率 (季调后) (11月)--
预: --
前: --
加拿大核心CPI月率 (季调后) (11月)--
预: --
前: --

无匹配数据
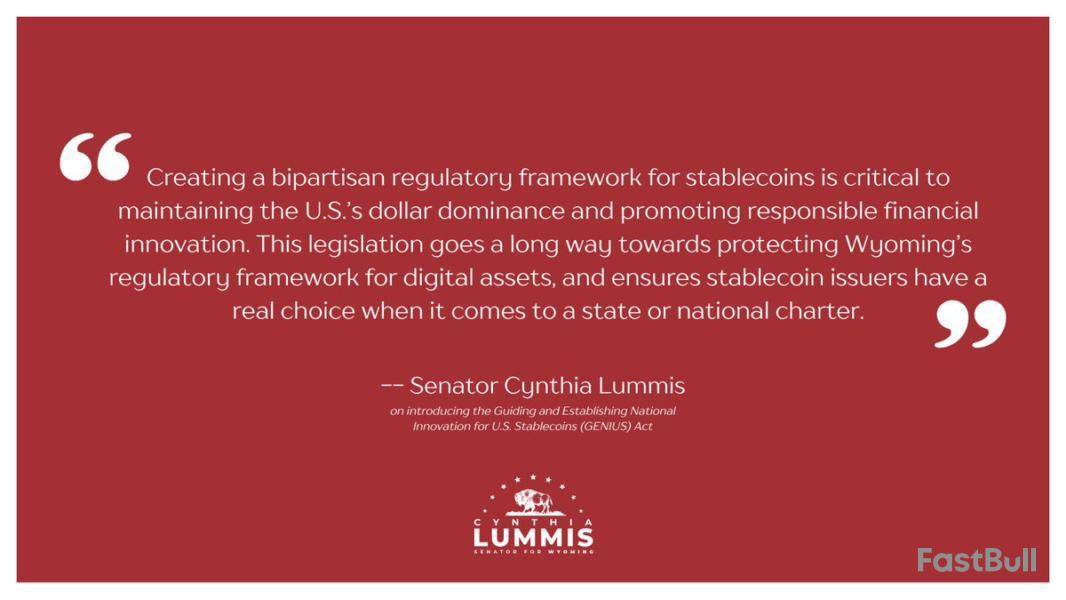
US Senator Bill Hagerty has introduced a bill to create a regulatory framework for stablecoins that would bring tokens such as Tether and USD Coin under Federal Reserve rules.
The Tennesse Republican said in a Feb. 4 statement that the stablecoin bill would create “a safe and pro-growth regulatory framework that will unleash innovation” and advance President Donald Trump’s pledge to make the US the “world capital of crypto.”
Hagerty’s “Guiding and Establishing National Innovation for US Stablecoins (GENIUS) Act” received support from Senators Tim Scott, Kirsten Gillibrand and Cynthia Lummis.
Hagerty added on X that he is looking forward to working with Representative French Hill and the House Financial Services Committee to “get it to the president’s desk and signed into law.”
Hagerty’s stablecoin bill builds on the discussion draft he submitted for former Representative Patrick McHenry’s Clarity for Payment Stablecoins Act in October.
The GENIUS stablecoin bill defines stablecoins as digital assets pegged to the US dollar and proposes that issuers with market caps above $10 billion comply with Federal Reserve regulations, while issuers below that threshold would be regulated by the states.
Tether (USDT) and Circle’s USD Coin (USDC) are the only two stablecoins with market caps currently above $10 billion, CoinGecko data shows.
Stablecoin issuers would also have to provide audited reserve reports every month, with submitting false information possibly leading to criminal penalties.
FOX Business reporter Eleanor Terrett said on X that Senate staffers “expect the bill to move quickly through committees in Congress.”
At a Feb. 4 press conference, White House’s AI and crypto czar David Sacks showed real intent to help pass stablecoin legislation in the coming months
The total stablecoin market cap sits at $227 billion, a sum that crypto asset manager Bitwise expects to increase to $400 billion by the end of this year.
Bitcoin and the entire crypto market experienced a rollercoaster of volatility yesterday, plunging on fears of a U.S. trade war before staging a rapid recovery. The price dropped over 9% in just a few hours, hitting a low of $91,530, only to bounce back by more than 12% following reports that President Trump is negotiating with Mexico and Canada to lift tariffs. This shift in sentiment quickly fueled renewed optimism across the market.
Top analyst Daan shared a technical analysis on X, highlighting Bitcoin’s resilience amid uncertainty. He noted that BTC still looks much stronger than anything else in the market, maintaining a solid uptrend when viewed from a broader perspective. Despite the aggressive sell-off, Bitcoin remains structurally sound, with strong demand levels preventing deeper corrections.
With BTC trading back above key levels, investors are watching closely to see if the cryptocurrency can sustain this momentum and push toward all-time highs. The coming days will be crucial in determining whether Bitcoin can solidify its position as the dominant asset in the market or if further volatility will test its strength again. For now, Bitcoin appears to be leading the market recovery, proving its resilience once more.
Bitcoin Holding Bullish Price Action
Despite recent volatility and aggressive selling pressure, Bitcoin continues to show strength compared to altcoins, proving its dominance in the market. While many altcoins struggle to recover, BTC has rebounded quickly from its lows, reinforcing its position as the leading asset. Yesterday’s price action further confirmed that Bitcoin is still in control, and the long-anticipated altseason may be delayed until altcoins can catch up with BTC’s momentum.
Top analyst Daan shared a technical analysis on X, highlighting Bitcoin’s resilience. He noted that BTC is much stronger than anything else in the market and still looks perfectly fine when zooming out. According to Daan, Bitcoin’s demand remains significantly higher than other assets, especially during times of uncertainty. This is evident in the recent market movement, where BTC recovered swiftly while most altcoins remained stagnant or continued to drop.
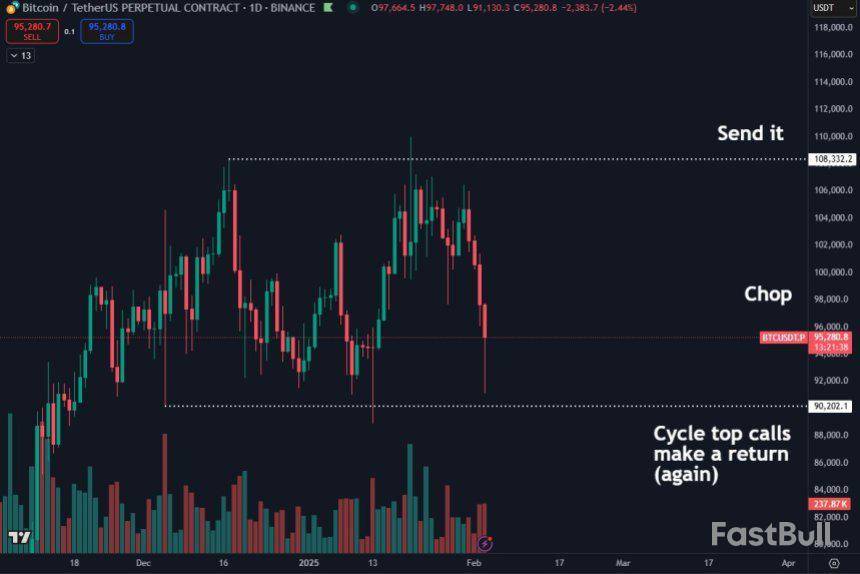
Daan’s analysis reveals that Bitcoin is currently trading within a defined range, with an all-time high (ATH) of $109K at the upper boundary and strong support at the $90K level. As long as BTC holds within this range, the potential for another breakout remains high. If bulls manage to push BTC above the ATH, a new bullish phase will begin, potentially leaving altcoins further behind.
Another key factor driving Bitcoin’s dominance is institutional interest. The recent data from major on-chain analytics platforms reveals that Bitcoin accumulation remains strong among whales, with large holders continuing to add BTC despite market uncertainty. Unlike previous market cycles, where retail investors drove price surges, this rally appears to be fueled by institutions and long-term holders, making it more sustainable.
Testing Key Demand Levels
Bitcoin is testing crucial liquidity below the $100K mark, currently trading at $99,400 and attempting to find a strong footing before its next move. Price action remains highly unpredictable and volatile, with investors closely watching key levels for signs of a potential breakout or further downside.
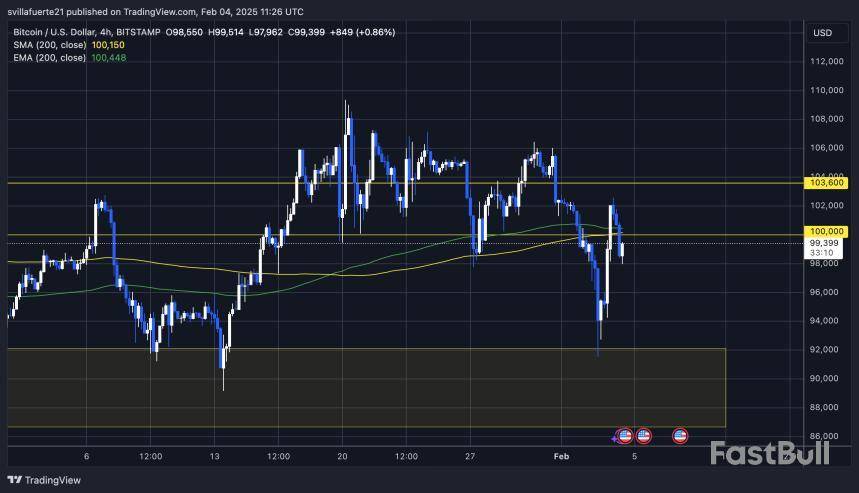
For BTC to confirm short-term strength, it must reclaim the $100K mark and hold it as support. This level is a psychological and technical barrier that, once secured, could trigger renewed bullish momentum. If Bitcoin struggles to maintain this level, further consolidation below $100K could follow, delaying any breakout attempts.
The $98K level is another crucial support zone. As long as BTC stays above this mark, a push back above $100K remains highly likely. Losing this level could lead to a deeper retracement, testing lower demand zones before another attempt to reclaim higher levels.
To fully regain bullish momentum, Bitcoin must reclaim the $103,600 mark, a key resistance level that has limited upward moves in recent days. A successful breakout above this level would set the stage for a massive rally toward all-time highs, opening the door for BTC to enter price discovery once again.
Featured image from Dall-E, chart from TradingView
Dogecoin is currently at the 200 EMA, a historically significant zone for trend reversals, having reached a critical support level following a protracted decline. Dogecoin has previously used this level as a crucial turning point, making it a critical area where either a significant rebound or additional breakdown may occur.
Holding above 200 EMA: A recovery route is scenario 1. The downtrend may come to an end and a relief rally may be triggered if DOGE is able to maintain its position above the 200 EMA, which is currently at $0.26. If this level is successfully defended, buyers will be intervening to stop additional losses. Chart by TradingView">
The next resistance zone in this scenario is $0.34, and a recovery toward $0.30 to $0.32 is feasible. A return to the $0.36-$0.38 range might occur if momentum picks up speed. For a trend reversal to be confirmed, DOGE must exhibit higher volume and buying strength.
Scenario 2: Bearish continuation with a break below the 200 EMA. A significant bearish signal that would pave the way to a more thorough correction would be generated if Dogecoin dropped below the 200 EMA. A rapid drop toward $0.22, the next important support level, could result from a break below $0.26.
At worst, DOGE might even go back to $0.18, wiping out a large portion of its recent gains. The meme coin would be in a risky position as a result, and traders would be closely monitoring any possible signs of recovery. This is a make-or-break situation for DOGE. While holding the 200 EMA might lead to a brief rally, a breakdown would increase selling pressure and cause the asset to enter a more severe correction phase. The coming days will determine whether bulls can defend this crucial level or if DOGE will enter another leg down.
DXY pushes Bitcoin
Following a recent rally, the U.S. Dollar Index , a crucial gauge of the dollar's strength relative to other major currencies, is currently trading at 108.60, indicating volatility. Bitcoin and the DXY have historically had an inverse relationship; when the dollar rises, BTC typically struggles, and when it falls, Bitcoin frequently soars.
With the help of its 50 and 200 EMAs, which both indicate continued strength, DXY has been on a strong upward trend. Bitcoin may be able to regain momentum, though, as the recent rejection at 109.50 suggests potential weakness. A further decline toward 106.40 or lower could occur if DXY is unable to maintain support at 107.70, providing a bullish setup for Bitcoin.
Bitcoin might get stronger and try to break out toward $100,000 if DXY begins to fall, assuming it stays at its current levels. However, BTC may experience pressure and a short-term decline back toward $92,000 to $90,000 if DXY recovers and breaks above 109.50. The Federal Reserve's policies and the forthcoming economic data will be key factors in determining how the DXY moves.
The dollar may weaken and open the door for Bitcoin's next bullish move if inflation slows and rate hikes slow. However, if the economy proves to be more resilient than anticipated, DXY may rise while BTC struggles.
Ethereum's worst performance
Ethereum has suffered greatly, performing worse than the other 10 most popular cryptocurrencies. While XRP and Bitcoin have demonstrated signs of stability and recovery, ETH is still plunging and is having trouble finding support. It is currently the worst-performing major digital asset, with a recent decline below $3,000 signifying a critical breakdown.
In just a few days, ETH has dropped by almost 30% and broken below a number of important support levels. Normally serving as powerful dynamic supports, the 50 EMA ($3328) and 200 EMA ($3,192) have been broken. If buyers do not intervene, Ethereum, which is currently trading at about $2,796, could lose more money.
ETH is having a hard time recovering in contrast to Bitcoin, which is still trading above $95,000, and XRP, which experienced a dramatic recovery following a significant decline. The lack of momentum suggests weak buying interest, leaving Ethereum vulnerable to further downside pressure.
The next significant support, which corresponds to previous demand zones, is located around $2,600 if Ethereum is unable to recover $3,000. Ethereum might reach $2,300, a level not seen in months, if it breaks below this. ETH may experience a brief relief rally, however, if it recovers $3,000 and rises above $3,200. To confirm a bullish reversal, it would still need to break above $3,328.
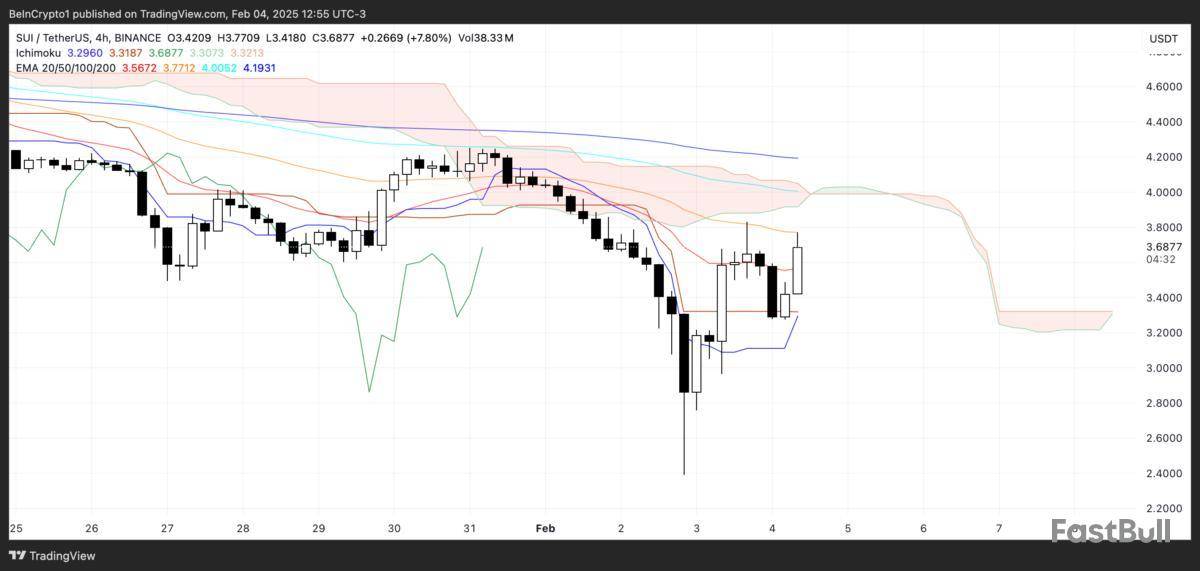
SUI price has been up roughly 4% in the last 24 hours but has remained down 30% over the past month. Despite slight recovery, its technical indicators still point to an overall bearish setup, with both the Ichimoku Cloud and EMA lines suggesting strong resistance ahead.
However, SUI continues to show impressive trading activity, ranking as the sixth-largest blockchain by daily volume, ahead of Avalanche and Polygon. Whether SUI can sustain this momentum and reclaim $4 in the coming days will depend on its ability to break key resistance levels and confirm a trend reversal.
SUI Is Now The 6th Largest Chain In Terms of Daily Volume
SUI blockchain daily volume reached $615 million in the last 24 hours, making it the sixth-largest blockchain by volume. This puts it ahead of well-established networks like Avalanche, Hyperliquid, Polygon, and Tron, signaling strong market activity.
While SUI is a relatively new player, its ability to generate such a high volume suggests growing interest from traders and investors.
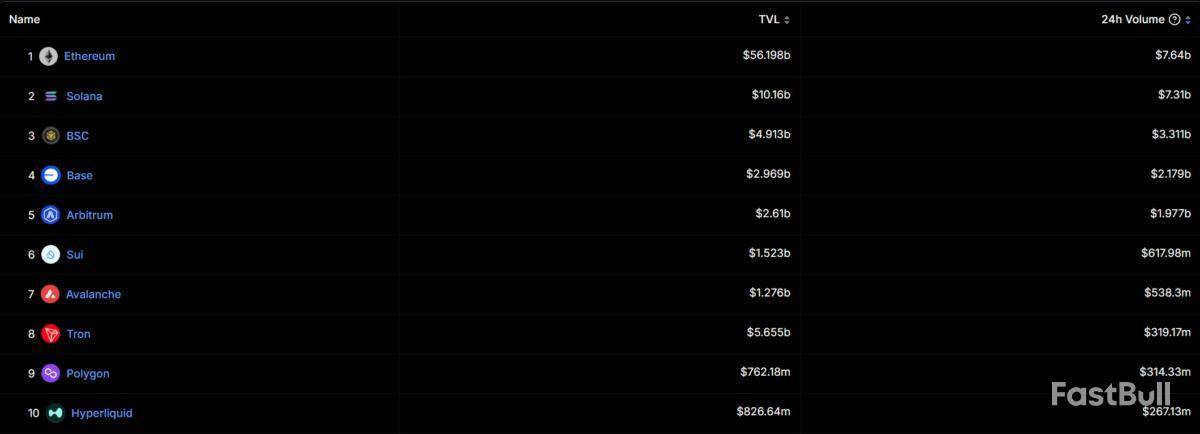
Tracking daily volume is crucial for blockchains as it reflects user engagement, liquidity, and overall demand. Despite attracting $615 million in daily volume, SUI still has far fewer protocols than older networks like Avalanche and Polygon.
This suggests that while its ecosystem is not yet as developed, the strong trading activity could drive more projects to build on SUI, potentially accelerating its adoption and growth.
Ichimoku Cloud Pictures a Bearish Setup for SUI
The Ichimoku Cloud chart shows that the SUI price is currently trading below the cloud, indicating that the broader trend remains bearish. The cloud itself is thick and sloping downward, suggesting strong resistance overhead and a continuation of the downtrend if momentum doesn’t shift.
The conversion line (blue) has recently turned upward and is attempting to cross the baseline (red), which could be an early signal of potential short-term bullish momentum. However, the lagging span (green) is still below the price and the cloud, reinforcing that the longer-term trend has not yet shifted bullish.
The future cloud is also forming a bearish structure, with its leading span A (green) below leading span B (red), showing that bearish momentum still dominates.
Despite the recent price jump, the cloud remains a strong resistance zone, and unless the price can break above it and confirm a trend reversal, the overall sentiment remains cautious. The fact that SUI price is hovering near the lower edge of the cloud suggests a period of consolidation before a clearer trend direction emerges.
SUI Price Prediction: Can SUI Reclaim $4 In The Next Days?
SUI EMA lines remain bearish, with short-term moving averages still below the longer-term ones despite the recent price surge. This suggests that while momentum has improved, the overall trend has not yet reversed into a clear uptrend.
If the current bullish momentum continues, SUI price could test $3.94, and a breakout above that level could lead to a move toward $4.25. A stronger trend shift could push the price even higher, potentially reaching $4.76 or $5.14 in the coming weeks.
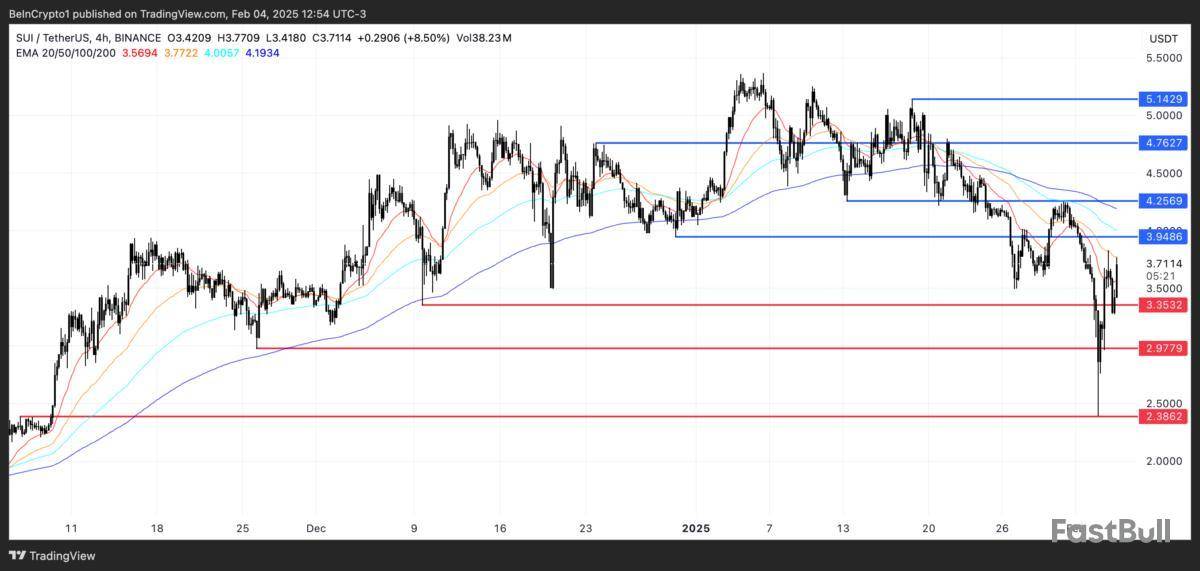
However, as both the Ichimoku Cloud and EMA structure indicate, the broader market sentiment for SUI is still bearish. If the price fails to maintain its current momentum and tests support at $3.35, losing that level could lead to a further drop below $3.
In that scenario, SUI price could decline toward $2.97, and if selling pressure remains strong, it might fall as low as $2.38. Until a decisive trend shift occurs, the market remains in a cautious phase, with both upside and downside possibilities in play.
The recent price slump in Bitcoin, caused by a turbulent cryptocurrency market, has sent many investors into panic mode, forcing them to offload their BTC holdings at a loss.
However, blockchain analytics firm Glassnode noted that a group of Bitcoin investors remained resilient despite the crypto market volatility, saying that long-term holders of the firstborn crypto are unshaken by the current market slump.
Long-Term Holders ‘Largely Unaffected’
Glassnode said that Bitcoin, like other cryptocurrencies, experienced a shaky week in which traders saw the world’s most dominant digital asset crash below the $100,000 level.
At one point, Bitcoin’s price nearly hit the $90,000 level, at $92,800, on February 3, which was the lowest since BTC recorded $90,890 on January 13.
On the brighter side, the blockchain analytics firm noted that BTC’s long-term holders seem insulated from all the chaos surrounding the cryptocurrency community, saying, “#BTC’s long-term holders (LTHs) remain largely unaffected.”
Glassnode revealed that data showed nearly 0.01% of the supply of these BTC holders was in loss, emphasizing the resiliency of long-term investors in times of market turbulence. However, the crypto firm remarked that these Bitcoin investors experienced a decreasing unrealized profit.
The analyst noted that BTC holders are not aggressively buying at current prices, possibly waiting for better market signals before resuming accumulation.
Bitcoin Short-Term Holders Bleed
Meanwhile, data showed that another segment of Bitcoin investors suffered the most from the market crash – short-term holders.
According to Glassnode, short-term BTC holders experienced a significant loss after the crypto’s price slid below the $100,000 level, causing panic among these traders.
glassnode@glassnodeFeb 03, 2025#Bitcoin dipped below $100K over the weekend, pushing a notable amount of short-term holder (STH) supply into loss. At $97K, the supply in loss & profit held by STHs was evenly split at ~11% – the largest loss exposure for STHs since early January: https://t.co/Drjy6ahQMm pic.twitter.com/gypNiJ0BqX
Glassnode said that when Bitcoin plummeted to $100,000 over the weekend, it pushed “a notable amount of short-term holder (STH) supply into loss.”
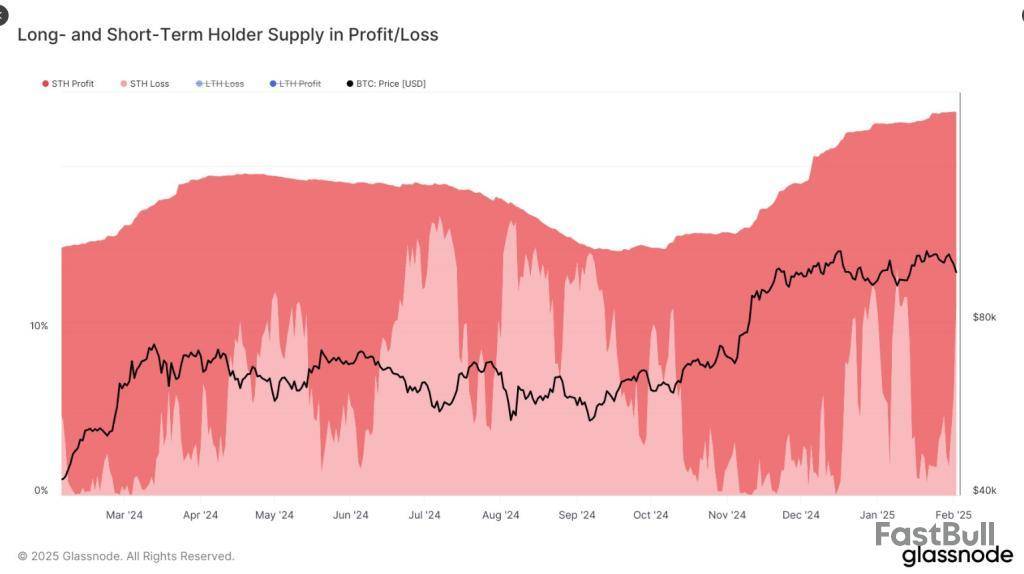
“At $97K, the supply in loss & profit held by STHs was evenly split at ~11% – the largest loss exposure for STHs since early January,” the blockchain analytics firm said in an X post.Bearish Market Sentiment
An analyst noted that Bitcoin briefly dipped so low that it nearly hit $90,000 per coin, as the dominating crypto suffered after the market crash.
“Bitcoin plummeted to as low as $91.2K as all of crypto has dipped with world stock markets starting the week with heavy bleeding. Media outlets seem to be attributing plummeting sectors to ‘Trump’s trade war’,” market intelligence platform Santiment said in a post.
Santiment@santimentfeedFeb 03, 2025Bitcoin plummeted to as low as $91.2K as all of crypto has dipped with world stock markets starting the week with heavy bleeding. Media outlets seem to be attributing plummeting sectors to ‘Trump’s trade war’.
Whether this is the primary reason or if there are other… pic.twitter.com/ij1bQ6xfUu
Santiment added that there have been overwhelmingly negative reactions from investors in the cryptocurrency community as a result of the price decline, and for a moment it seems BTC is about to enter bearish territory.
The market intelligence platform noted that at the moment, Bitcoin was able to pull back to $96,000.
Featured image from Pexels, chart from TradingView
Bullish Global, which is a subsidiary of Block.one and counts billionaire Peter Thiel as an investor, is considering an initial public offering Bloomberg reported Tuesday, citing anonymous sources. The company could launch its IPO as soon as this year, the sources said.
Bullish Global develops financial services for the digital assets sector and operates a cryptocurrency trading platform, according to its website. The company acquired crypto media outlet CoinDesk from Digital Currency Group in November 2023.
The report emerges on the heels of Donald Trump, who Thiel supported during last year's election, taking office as president of the United States. Trump's embrace of crypto and moves to support the digital assets industry has helped spur a bullish cycle.
Both Bullish Global and Block.one did not immediately respond to requests for comment.
Back in 2021, Block.one unveiled Bullish Global and said it had raised nearly $10 billion in funding. Block.one is the developer of the EOSIO blockchain.
Bullish also planned to go public in 2021, but didn't follow through. The company is working with Jefferies Financial Group on potentially launching an IPO, Bloomberg reported.
Thiel's venture capital firm Founders Fund has invested in the decentralized prediction market platform Polymarket. Other investors in Block.one includes Alan Howard, Mike Novogratz, and the Japanese banking giant Nomura.
Disclaimer: The Block is an independent media outlet that delivers news, research, and data. As of November 2023, Foresight Ventures is a majority investor of The Block. Foresight Ventures invests in other companies in the crypto space. Crypto exchange Bitget is an anchor LP for Foresight Ventures. The Block continues to operate independently to deliver objective, impactful, and timely information about the crypto industry. Here are our current financial disclosures.
© 2024 The Block. All Rights Reserved. This article is provided for informational purposes only. It is not offered or intended to be used as legal, tax, investment, financial, or other advice.
Ethereum is down $175.99 today or 6.25% to $2642.00
Note: The Ethereum price is a 5 p.m. ET snapshot from Kraken
Data compiled by Dow Jones Market Data
728 RM B 7/F GEE LOK IND BLDG NO 34 HUNG TO RD KWUN TONG KLN HONG KONG


交易股票、货币、商品、期货、债券、基金等金融工具或加密货币属高风险行为,这些风险包括损失您的部分或全部投资金额,所以交易并非适合所有投资者。
做出任何财务决定时,应该进行自己的尽职调查,运用自己的判断力,并咨询合格的顾问。本网站的内容并非直接针对您,我们也未考虑您的财务状况或需求。本网站所含信息不一定是实时提供的,也不一定是准确的。本站提供的价格可能由做市商而非交易所提供。您做出的任何交易或其他财务决定均应完全由您负责,并且您不得依赖通过网站提供的任何信息。我们不对网站中的任何信息提供任何保证,并且对因使用网站中的任何信息而可能造成的任何交易损失不承担任何责任。
未经本站书面许可,禁止使用、存储、复制、展现、修改、传播或分发本网站所含数据。提供本网站所含数据的供应商及交易所保留其所有知识产权。


