行情
新闻
分析
用户
快讯
财经日历
学习
数据
- 名称
- 最新值
- 前值


VIP跟单
所有跟单
所有比赛


英国对非欧盟贸易账 (季调后) (10月)公:--
预: --
前: --
英国贸易账 (10月)公:--
预: --
前: --
英国服务业指数月率公:--
预: --
前: --
英国建筑业产出月率 (季调后) (10月)公:--
预: --
前: --
英国工业产出年率 (10月)公:--
预: --
前: --
英国贸易账 (季调后) (10月)公:--
预: --
前: --
英国对欧盟贸易账 (季调后) (10月)公:--
预: --
前: --
英国制造业产出年率 (10月)公:--
预: --
前: --
英国GDP月率 (10月)公:--
预: --
前: --
英国GDP年率 (季调后) (10月)公:--
预: --
前: --
英国工业产出月率 (10月)公:--
预: --
前: --
英国建筑业产出年率 (10月)公:--
预: --
前: --
法国HICP月率终值 (11月)公:--
预: --
前: --
中国大陆未偿还贷款增长年率 (11月)公:--
预: --
前: --
中国大陆M2货币供应量年率 (11月)公:--
预: --
前: --
中国大陆M0货币供应量年率 (11月)公:--
预: --
前: --
中国大陆M1货币供应量年率 (11月)公:--
预: --
前: --
印度CPI年率 (11月)公:--
预: --
前: --
印度存款增长年率公:--
预: --
前: --
巴西服务业增长年率 (10月)公:--
预: --
前: --
墨西哥工业产值年率 (10月)公:--
预: --
前: --
俄罗斯贸易账 (10月)公:--
预: --
前: --
费城联储主席保尔森发表讲话
加拿大营建许可月率 (季调后) (10月)公:--
预: --
前: --
加拿大批发销售年率 (10月)公:--
预: --
前: --
加拿大批发库存月率 (10月)公:--
预: --
前: --
加拿大批发库存年率 (10月)公:--
预: --
前: --
加拿大批发销售月率 (季调后) (10月)公:--
预: --
前: --
德国经常账 (未季调) (10月)公:--
预: --
前: --
美国当周钻井总数公:--
预: --
前: --
美国当周石油钻井总数公:--
预: --
前: --
日本短观大型非制造业景气判断指数 (第四季度)--
预: --
前: --
日本短观小型制造业前景指数 (第四季度)--
预: --
前: --
日本短观大型非制造业前景指数 (第四季度)--
预: --
前: --
日本短观大型制造业前景指数 (第四季度)--
预: --
前: --
日本短观小型制造业景气判断指数 (第四季度)--
预: --
前: --
日本短观大型制造业景气判断指数 (第四季度)--
预: --
前: --
日本短观大型企业资本支出年率 (第四季度)--
预: --
前: --
英国Rightmove住宅销售价格指数年率 (12月)--
预: --
前: --
中国大陆工业产出年率 (年初至今) (11月)--
预: --
前: --
中国大陆城镇失业率 (11月)--
预: --
前: --
沙特阿拉伯CPI年率 (11月)--
预: --
前: --
欧元区工业产出年率 (10月)--
预: --
前: --
欧元区工业产出月率 (10月)--
预: --
前: --
加拿大成屋销售月率 (11月)--
预: --
前: --
欧元区储备资产总额 (11月)--
预: --
前: --
英国通胀预期--
预: --
前: --
加拿大全国经济信心指数--
预: --
前: --
加拿大新屋开工 (11月)--
预: --
前: --
美国纽约联储制造业就业指数 (12月)--
预: --
前: --
美国纽约联储制造业指数 (12月)--
预: --
前: --
加拿大核心CPI年率 (11月)--
预: --
前: --
加拿大制造业未完成订单月率 (10月)--
预: --
前: --
加拿大制造业新订单月率 (10月)--
预: --
前: --
加拿大核心CPI月率 (11月)--
预: --
前: --
加拿大制造业库存月率 (10月)--
预: --
前: --
加拿大CPI年率 (11月)--
预: --
前: --
加拿大CPI月率 (11月)--
预: --
前: --
加拿大CPI年率 (季调后) (11月)--
预: --
前: --
加拿大核心CPI月率 (季调后) (11月)--
预: --
前: --


无匹配数据
There has been a notable uptick in crypto crowd chatter following the Senate’s passage of US President Donald Trump’s sweeping “One Big Beautiful Bill,” with Vice President JD Vance breaking a 50-50 tie. Santiment reported a measurable increase in the social volume of the words “big,” “beautiful,” and “bill.”
This means that crypto traders are actively linking market outlooks to the bill’s potential policy shifts.
While the legislation itself offers no direct crypto provisions, the on-chain analytics platform noted that the traders appear to be positioning for possible ripple effects. These include broad tax cuts and consumer spending incentives that could fuel a “risk-on” sentiment favorable for Bitcoin and altcoins.Bill’s Depreciation Incentives Attract Miners
The bill’s return of 100% bonus depreciation is another underreported aspect Santiment flagged as potentially bullish for Bitcoin mining. This is because it allows firms to immediately write off mining equipment purchases. Such a move is expected to incentivize rapid ASIC deployment and potentially increase Bitcoin’s hash rate.
Historically, higher hash rates align with bullish cycles, particularly during monetary expansion. As such, the report noted that if looser fiscal policy intersects with rising M2 supply, crypto assets may see upward momentum.
Despite market optimism, Santiment highlighted disappointment following the failure to include Senator Cynthia Lummis’ proposed amendment. The amendment aimed to address staking, mining, and microtransaction tax complications, an omission many in the industry had pushed for over the weekend.
Overall, the social sentiment is still skewed bullish. Traders are mostly anticipating potential indirect benefits to crypto investments as tax cuts on overtime and tips put more disposable income into circulation.
Certain others, however, remained cautious as the bill’s deep spending cuts to healthcare and green energy have triggered market anxieties, which evenledto tensions between Trump and Tesla CEO Elon Musk. The latter had publicly criticized the bill and hinted at political realignment.
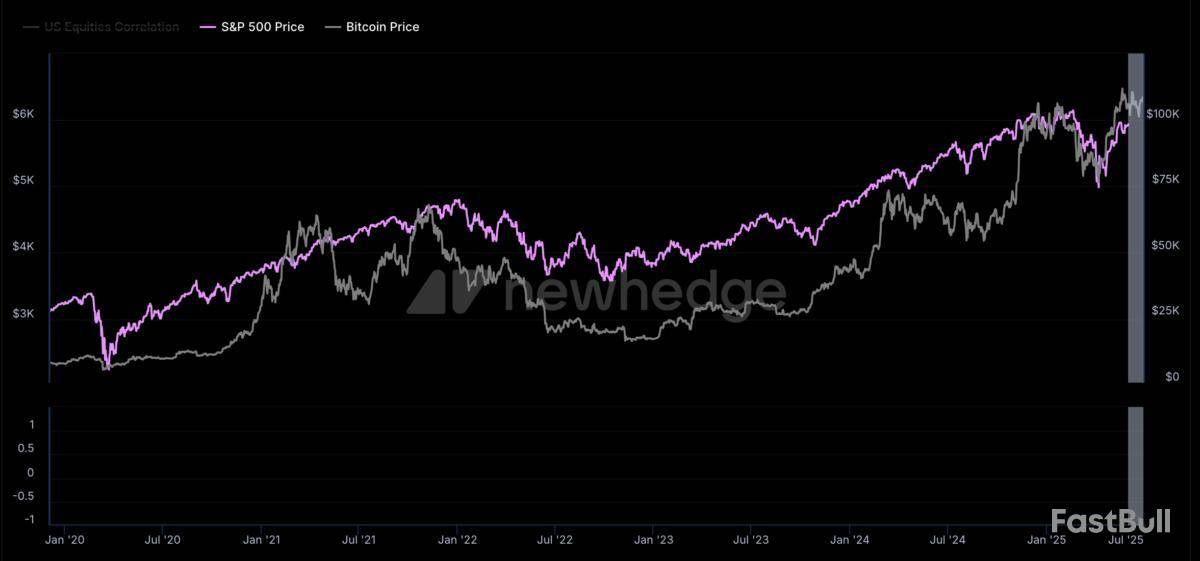
When tracking the social reactions to this conflict, Santiment found a slight dip in Bitcoin prices mirroring Tesla’s decline. This reflected the continued correlation between Tesla stock movements and crypto market reactions during significant political events.
Additionally, Dogecoin entered the narrative as traders referenced Musk’s previous humorous support through the so-called DOGE department. His current remarks warned that the bill could damage future-focused companies, further adding to volatility in sentiment.“Sell the Rumor, Buy the News” Patterns Emerge
The social metric analysis suggests that while the Senate’s passage of the bill has not yet translated into significant price rallies for Bitcoin or major altcoins, the crowd mood has shifted toward cautious optimism, which is consistent with “sell the rumor, buy the news” behavior often seen in crypto markets.
The ongoing legislative process is expected to influence crypto market sentiment depending on how political negotiations evolve, particularly around the potential impact on fiscal spending, Treasury markets, and Federal Reserve liquidity actions.
While direct crypto wins were absent in the Senate version, the broader implications of consumer liquidity, policy volatility, and fiscal-monetary interactions will remain critical watchpoints for traders seeking to position around the “Big Beautiful Bill” narrative in the coming weeks.
Publicly traded Bitcoin miner Hut 8 (ticker HUT) signed five-year capacity contracts with the Ontario Independent Electricity System Operator (IESO) for four of its natural gas-fired power plants in the Canadian province.
A capacity contract is an agreement between a power generator and a grid operator where generators are paid to ensure a specified amount of electrical capacity is available during a set period, typically to meet peak demand or ensure grid reliability.
Hut 8 notes that the agreement will "deliver stable cash flows" for Far North Power Corp., a joint entity formed between Hut 8 and Macquarie Equipment Finance Ltd. The contracts include a weighted average payment of approximately CAD $530 per megawatt of power per day, according to the announcement.
"The contracted assets total 310 MW of nameplate capacity across four sites: Iroquois Falls, Kingston, Kapuskasing, and North Bay," the firm wrote.
The move represents the growing integration of Bitcoin mining facilities into existing grid operations and the expanding business lines pursued by miners that are now facing more competition following the programmatic Bitcoin network halving in 2024.
For instance, mining facilities in Texas, which maintain an independent grid, have long signed deals with the Electric Reliability Council of Texas operator to act as flexible load balancers during times of peak power demand.
Self mining
Meanwhile, Nasdaq-listed Cipher Mining (ticker CIFR) announced that it has surpassed expectations for its self-mining capacity at its new Black Pearl facility, which started hashing at the end of June.
"Hashrate will continue to increase at the site through the third quarter of 2025 as new mining rigs continue to be delivered in scheduled batches, gradually replacing legacy units," the firm wrote.
Self-mining capacity refers to the total computational power that a miner dedicates to mining Bitcoin using its own equipment and is a representation of a firm’s ability to earn Bitcoin rewards without relying on third-party mining pools or hosted services. The firm mined 160 BTC in June and sold 58, bringing its total held to 1,063 bitcoins.
Disclaimer: The Block is an independent media outlet that delivers news, research, and data. As of November 2023, Foresight Ventures is a majority investor of The Block. Foresight Ventures invests in other companies in the crypto space. Crypto exchange Bitget is an anchor LP for Foresight Ventures. The Block continues to operate independently to deliver objective, impactful, and timely information about the crypto industry. Here are our current financial disclosures.
© 2025 The Block. All Rights Reserved. This article is provided for informational purposes only. It is not offered or intended to be used as legal, tax, investment, financial, or other advice.
Bitcoin is holding steady above its 50-day Simple Moving Average (SMA), showing signs of underlying strength despite a lack of clear directional momentum. With rising trading volume and mixed technical indicators, the next move could swing either way, keeping the market on edge.
RSI Holds Neutral As Bitcoin Awaits A Clearer Signal
According to Shaco AI, in a recent update on X, Bitcoin is currently hovering around $107,264.17, positioning itself just above two key moving averages. It’s nudging the 25-day SMA at $107,229.82 and holding slightly above the 50-day SMA, which sits at $107,040.81. This positioning reflects a mild bullish bias in recent sessions, keeping both bulls and bears on alert.
Looking at momentum indicators, the Relative Strength Index (RSI) is resting at 53.36—firmly in neutral territory. This suggests that Bitcoin is neither overbought nor oversold at the moment, offering no strong directional clues as it keeps the market guessing.
Furthermore, the Average Directional Index (ADX) adds to this indecisive mood, coming in at a soft 20.44. This low reading signals a weak trend, meaning there’s not enough force from bulls or bears to drive a clear breakout just yet. In other words, the market isn’t leaning heavily in either direction.
Meanwhile, the Moving Average Convergence Divergence (MACD) remains in negative territory at -137.33. Although it isn’t signaling any strong downward momentum, traders may want to stay cautious and alert for any sudden shift in the current tone.
Despite the technical indecision, market activity is picking up. Bitcoin’s recent trading volume has surged to 1903.51, well above the average of 1522.43. This uptick signals a rise in interest and participation, indicating that traders are actively positioning themselves in anticipation of Bitcoin’s next move.
Critical Zones At Play As Market Prepares For A Directional Push
Looking at key levels, Shaco AI highlighted that resistance is at $108,789.99, which seems to be a strong level to overcome. The level marks a significant ceiling for Bitcoin, and any attempt to push higher will need solid momentum to break through. On the other hand, support lies at $104,622.02. This support level will be critical in case the price begins to retreat, as a breakdown here could open the door for further downside.
Based on current indicators, the analyst suggests it’s wise to keep an eye out for potential movement in either direction. With volume picking up, Bitcoin may soon test either the resistance above or fall back to support, depending on how momentum develops in the coming sessions.
Bitcoin faced a challenging start to July, influenced by broader macroeconomic pressures. Yet, the largest cryptocurrency has demonstrated remarkable resilience. Many market observers remain positive, with some speculating that Bitcoin could soon reach a new all-time high.
Analysts cite several key factors fueling this optimism, including growing market liquidity, a weakening dollar, historical trends, and positive technical indicators.
These Key Drivers Suggest a Potential Bitcoin Price Surge
BeInCrypto reported yesterday that the renewed feud between Donald Trump and billionaire Elon Musk put downward pressure on the broader market. Thus, Bitcoin also suffered.
However, BTC managed to recover its gains. At the time of writing, it traded at $107,688, up 1.05% over the past day.
With BTC just 3.8% from its record high, analysts are growing increasingly hopeful that this gap will close soon. Three key factors support this view.
The first is the M2 money supply. According to the latest data, the US M2 money supply has reached a record high of $21.94 trillion.
Historically, Bitcoin has shown a strong correlation with M2. If this pattern continues, BTC may soon follow suit. Moreover, rising M2 also signals more money in circulation, which can lead to inflationary pressures and a weaker dollar.
In fact, recent Barchart data shows that the US Dollar Index (DXY) has dropped to levels not seen since February 2022.
“US Dollar Index DXY fell as low as 96.37, its lowest level since February 2022,” the post read.
Once again, Bitcoin has demonstrated an inverse relationship with the DXY. Investors often turn to Bitcoin as a hedge against inflation as the dollar weakens. This trend could drive prices higher.
Next, in addition to the M2 money supply, several major indices, including NVIDIA, S&P 500, and the US100, have reached new all-time highs (ATH). But how does Bitcoin benefit from this?
Over the past five years, Bitcoin and the S&P 500 have shown a strong correlation. Therefore, Bitcoin may also experience positive momentum.
“Bitcoin is expected to reach a new all-time high in July, as history shows strong returns for risk assets this month. BTC has never dropped over 10% in July, and the S&P 500 has gained for 10 consecutive years,” an analyst stated.
Lastly, a significant reduction in Bitcoin’s supply on exchanges has emerged as a bullish indicator. According to data from Glassnode, Bitcoin’s percent supply on exchanges has dropped to 14.5%, the lowest since August 2018.
This decline suggests reduced selling pressure as investors move holdings to long-term storage, a classic precursor to price rallies.
Moreover, analyst Crypto Rover highlighted a bull flag pattern on the BTC price chart. A bull flag is a chart pattern indicating a continuation of an uptrend, so Bitcoin could continue moving north.
“This bull flag will send Bitcoin to $120,000!” Rover added.
BTC Market Structure Favors Upside, But Challenges Remain
While all these factors create a compelling case for Bitcoin’s next rally, Ray Youssef, CEO of NoOnes, remains cautiously optimistic.
“BTC price action has remained range-bound between $106,000 and $108,700 for 7 consecutive days, with market momentum stalling and no decisive breakout in sight. BTC has repeatedly failed to break and hold above $108,500 despite the resilient institutional appetite,” Youssef told BeInCrypto.
He acknowledged that traditional stocks’ performance and the macroeconomic conditions, like a falling dollar, support a bullish outlook.
However, the executive believes that Bitcoin still needs a clear macro catalyst to emerge. In the absence of this, the market appears cautious and reluctant to break higher.
“A clean break above $108,800 could open the door to retest the previous all-time range at $111,980, potentially $130,000 by the end of Q3 and $150,000 by EOY, provided institutional demand remains resilient and macro conditions create a favorable backdrop. Sellers are actively defending the $108,500 resistance zone, but the market structure favours upside continuation if bulls can regain control with volume,” he stated.
Youssef stressed that if the price fails to stay above $107,000, the short-term outlook could shift, with potential targets of $105,000 or even $102,000 coming into play.
Key takeaways:
Bitcoin’s STH cost basis, MVRV data, and other technical indicators suggest that BTC price is on track toward $117,000.
Analysts suggest a breakout above $109,000-$110,000 could push BTC to fresh all-time highs.
Bitcoin has been trading in a “well-defined” range over the past six months as traders anticipate a potential breakout.
Onchain indicators, including the short-term holder (STH) cost basis, point to a potential upward breakout toward $117,000 or higher.
Bitcoin price eyes $117,000 next
Since January, Bitcoin’s price has generally traded in a large range stretching from $78,000 to $110,000, per data from Cointelegraph Markets Pro and TradingView.
This is a “well-defined” range marked by the short-term holder (STH) cost basis bands, according to onchain analytics platform Glassnode. STH cost basis refers to the average purchase price of investors who have held Bitcoin for less than 155 days.
The price touched the upper band of this metric in May at $112,000, when it hit its current all-time high. If BTC rises to retest the line, it will likely rise toward $117,000 in the short term.
“The upper boundary of the STH cost basis was tested only once in late May and currently stands at $117,113,” the market intelligence firm said in a July 2 post on X, adding:
The market value realized value (MVRV) metric, a metric that measures whether the asset is overvalued or not, suggests that BTC price still has more room for further expansion before the unrealized profit value reaches an extreme level represented by the upper MVRV band around $123,000.
When will BTC price breakout?
Meanwhile, popular trader and analyst Rekt Capital shows that Bitcoin is already retesting its multimonth descending trendline.
“How many more rejections from the daily downtrend line before Bitcoin finally breaks out?” he asked, wondering whether the level was weakening as a point of rejection.
An accompanying chart revealed that the downward trendline at $109,000 is now a key breakout level.
“Bitcoin needs a daily close above and retest of the downtrend line as support to confirm the breakout.”
Fellow analyst Jelle opined that Bitcoin will break out once it closes above the upper boundary of a bull flag at $110,000 on the daily time frame, with a measured target of $130,000.
Jelle@CryptoJelleNLJul 02, 2025#Bitcoin is pushing for a breakout from the bullish flag! 👀
Break above $110k, and the first target is $130k. 📈 pic.twitter.com/fWzYZZiArd
As Cointelegraph reported, several Bitcoin traders are cautiously optimistic about a decisive break of the resistance at $109,000.
This article does not contain investment advice or recommendations. Every investment and trading move involves risk, and readers should conduct their own research when making a decision.
交易股票、货币、商品、期货、债券、基金等金融工具或加密货币属高风险行为,这些风险包括损失您的部分或全部投资金额,所以交易并非适合所有投资者。
做出任何财务决定时,应该进行自己的尽职调查,运用自己的判断力,并咨询合格的顾问。本网站的内容并非直接针对您,我们也未考虑您的财务状况或需求。本网站所含信息不一定是实时提供的,也不一定是准确的。本站提供的价格可能由做市商而非交易所提供。您做出的任何交易或其他财务决定均应完全由您负责,并且您不得依赖通过网站提供的任何信息。我们不对网站中的任何信息提供任何保证,并且对因使用网站中的任何信息而可能造成的任何交易损失不承担任何责任。
未经本站书面许可,禁止使用、存储、复制、展现、修改、传播或分发本网站所含数据。提供本网站所含数据的供应商及交易所保留其所有知识产权。