行情
新闻
分析
用户
快讯
财经日历
学习
数据
- 名称
- 最新值
- 前值


VIP跟单
所有跟单
所有比赛


英国对非欧盟贸易账 (季调后) (10月)公:--
预: --
前: --
英国贸易账 (10月)公:--
预: --
前: --
英国服务业指数月率公:--
预: --
前: --
英国建筑业产出月率 (季调后) (10月)公:--
预: --
前: --
英国工业产出年率 (10月)公:--
预: --
前: --
英国贸易账 (季调后) (10月)公:--
预: --
前: --
英国对欧盟贸易账 (季调后) (10月)公:--
预: --
前: --
英国制造业产出年率 (10月)公:--
预: --
前: --
英国GDP月率 (10月)公:--
预: --
前: --
英国GDP年率 (季调后) (10月)公:--
预: --
前: --
英国工业产出月率 (10月)公:--
预: --
前: --
英国建筑业产出年率 (10月)公:--
预: --
前: --
法国HICP月率终值 (11月)公:--
预: --
前: --
中国大陆未偿还贷款增长年率 (11月)公:--
预: --
前: --
中国大陆M2货币供应量年率 (11月)公:--
预: --
前: --
中国大陆M0货币供应量年率 (11月)公:--
预: --
前: --
中国大陆M1货币供应量年率 (11月)公:--
预: --
前: --
印度CPI年率 (11月)公:--
预: --
前: --
印度存款增长年率公:--
预: --
前: --
巴西服务业增长年率 (10月)公:--
预: --
前: --
墨西哥工业产值年率 (10月)公:--
预: --
前: --
俄罗斯贸易账 (10月)公:--
预: --
前: --
费城联储主席保尔森发表讲话
加拿大营建许可月率 (季调后) (10月)公:--
预: --
前: --
加拿大批发销售年率 (10月)公:--
预: --
前: --
加拿大批发库存月率 (10月)公:--
预: --
前: --
加拿大批发库存年率 (10月)公:--
预: --
前: --
加拿大批发销售月率 (季调后) (10月)公:--
预: --
前: --
德国经常账 (未季调) (10月)公:--
预: --
前: --
美国当周钻井总数公:--
预: --
前: --
美国当周石油钻井总数公:--
预: --
前: --
日本短观大型非制造业景气判断指数 (第四季度)--
预: --
前: --
日本短观小型制造业前景指数 (第四季度)--
预: --
前: --
日本短观大型非制造业前景指数 (第四季度)--
预: --
前: --
日本短观大型制造业前景指数 (第四季度)--
预: --
前: --
日本短观小型制造业景气判断指数 (第四季度)--
预: --
前: --
日本短观大型制造业景气判断指数 (第四季度)--
预: --
前: --
日本短观大型企业资本支出年率 (第四季度)--
预: --
前: --
英国Rightmove住宅销售价格指数年率 (12月)--
预: --
前: --
中国大陆工业产出年率 (年初至今) (11月)--
预: --
前: --
中国大陆城镇失业率 (11月)--
预: --
前: --
沙特阿拉伯CPI年率 (11月)--
预: --
前: --
欧元区工业产出年率 (10月)--
预: --
前: --
欧元区工业产出月率 (10月)--
预: --
前: --
加拿大成屋销售月率 (11月)--
预: --
前: --
欧元区储备资产总额 (11月)--
预: --
前: --
英国通胀预期--
预: --
前: --
加拿大全国经济信心指数--
预: --
前: --
加拿大新屋开工 (11月)--
预: --
前: --
美国纽约联储制造业就业指数 (12月)--
预: --
前: --
美国纽约联储制造业指数 (12月)--
预: --
前: --
加拿大核心CPI年率 (11月)--
预: --
前: --
加拿大制造业未完成订单月率 (10月)--
预: --
前: --
加拿大制造业新订单月率 (10月)--
预: --
前: --
加拿大核心CPI月率 (11月)--
预: --
前: --
加拿大制造业库存月率 (10月)--
预: --
前: --
加拿大CPI年率 (11月)--
预: --
前: --
加拿大CPI月率 (11月)--
预: --
前: --
加拿大CPI年率 (季调后) (11月)--
预: --
前: --
加拿大核心CPI月率 (季调后) (11月)--
预: --
前: --


无匹配数据
Solana is gaining momentum once again, with price action pushing above the $175 level for the first time in weeks. The move comes as crypto markets roar back to life, fueled by Bitcoin’s push above $100K and Ethereum’s explosive rally past $2,500. Solana has surged more than 20% in the past week alone, signaling strong demand and a renewed bullish outlook from traders and investors alike.
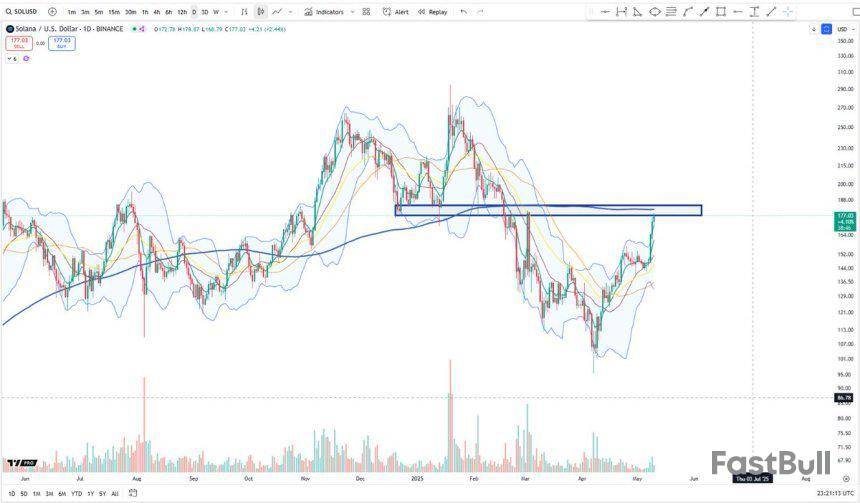
Top analyst Big Cheds shared a technical analysis revealing that Solana is now making a strong advance into a key spot—the underside of the daily 200 moving average (DMA). The asset is also approaching a lower high around the $180 mark, which previously acted as resistance during the last failed breakout attempt. Cheds notes that reclaiming this zone would be a significant win for bulls, potentially triggering a sharp continuation toward new highs.
Market sentiment is turning optimistic across the board, and Solana’s technical setup reflects that shift. As price approaches the 200DMA, all eyes are on whether SOL can hold this momentum and break through key levels to join the broader market rally. The coming days will be crucial for confirming a full trend reversal.
Solana Approaches Pivotal Level As Bulls Eye Breakout
Solana is showing renewed strength after a clean breakout above the $160 resistance zone, a level that had capped price action for several weeks. The surge has brought SOL into a critical region that could act as a pivot point—either igniting a fresh bullish rally or marking a temporary top before a retrace.
As global tensions between the US and China and broader macroeconomic uncertainties linger, the crypto market remains exposed to sudden sentiment shifts. However, recent price action in Solana, along with Bitcoin and Ethereum, suggests that investors are increasingly optimistic about a continued market recovery.
Solana’s current structure reflects that optimism. The asset is now testing the underside of its daily 200 moving average, a level often viewed by traders as a trend-defining indicator. A successful push above this moving average would add further confidence to the bullish thesis. At the same time, Solana is approaching a lower high near the $180 zone, where the price was previously rejected in March. Cheds points to this convergence as a crucial area: a breakout here could mark the beginning of a larger reversal pattern.
Still, risks remain. A rejection at the $180 level could reinforce resistance and trigger a pullback toward the $160 support, especially if macro conditions worsen or profit-taking sets in. For now, however, bulls appear to be in control, and the technical landscape supports a potential continuation—if momentum holds.
Technical Levels: Price Action Shows Strength
Solana (SOL) is exhibiting strong momentum as it trades at $176.41, advancing toward a crucial resistance area around the $180 level. The daily chart shows that SOL has surged rapidly from April lows, breaking above both the 200-day EMA ($161.67) and approaching the 200-day SMA ($181.10), a key area that could determine the next major trend.
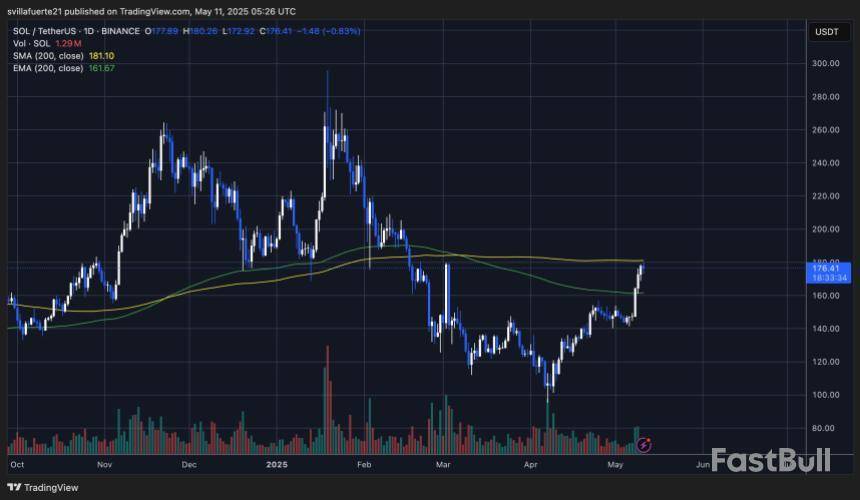
This zone acted as support and resistance multiple times in the past, particularly during Q4 2024 and early 2025. Now, as price returns to this range, it becomes a potential pivot point. If bulls can sustain pressure and close above $181.10 with volume confirmation, it may trigger a continuation toward $200 and possibly retest February highs above $260. However, failure to break above this range could prompt a rejection and consolidation below the 200 SMA.
Volume has picked up significantly over the last few days, indicating rising interest and participation from traders. This is a constructive sign as Solana attempts to reclaim higher ground. For now, the trend remains bullish, but eyes are on the $180–$185 resistance zone to confirm whether SOL has the strength to continue its breakout or faces a short-term pullback.
Featured image from Dall-E, chart from TradingView
Shiba Inu is currently showing signs of bullishness propelled by a surge in large-holder inflows of 643% over the last 30 days. A broader confidence in SHIB's short- to midterm trajectory is demonstrated by this massive capital movement, which indicates renewed interest from whales.
The inflows appear to be dispersed throughout the market rather than being a coordinated pump by a single party. Technically speaking, SHIB is testing resistance levels at $0.0001400 while riding above important moving averages. The more psychologically significant $0.00001600 zone, which corresponds with the 200 EMA, a crucial trend indicator that hasn't been challenged since its corrective downtrend started earlier this year, could be reached with a sustained break above this barrier. Chart by TradingView">
A close above that line might cause sentiment to shift sharply in favor of bullishness and possibly spark a larger breakout. At the moment, the RSI is close to 70, indicating that the market is almost overbought. Notably, such RSI levels are also typical during strong uptrends, particularly when supported by on-chain inflow surges like the ones we are currently seeing even though this typically indicates a potential pullback. At the same time, the net outflows from large holders are also slowing down, having decreased by more than 42% over the past seven days.
This divergence, inflows increasing and outflows decreasing, indicates accumulation as opposed to distribution, supporting the notion that the current move is more than a one-time event. With momentum above $0.000013 and $0.000014 as support, SHIB will be in a strong position to run toward $0.000016 and beyond. Failure to maintain that level, though, could result in a swift decline back to the next significant support at $0.00001275.
In summary, the stars are aligning for a possible explosive move as whales pile in and SHIB pushes against key resistance while technical confirmation builds. However, traders should keep an eye out for volume confirmations and be prepared for abrupt reversals in the event that sentiment changes as volatility always works both ways.
In the last few days Ethereum has experienced a strong recovery rally, rising from below $2,000 to almost $2,700. ETH may be set to continue its ascent toward $3,000 in the near future for three specific reasons even though some of this spike can be ascribed to general market momentum. There has been one of the biggest accumulation spikes in years in addresses with 10,000-100,000 ETH.
These wallets usually belong to high-net-worth individuals, funds and institutions. These organizations tend to position themselves ahead of significant movements rather than chase prices. The magnitude and velocity of this accumulation point to confidence in Ethereum's medium-term course. Significant whale accumulation has historically come before noteworthy rallies, and this time appears to be no exception. Chart by TradingView">
Staking activity has increased since Ethereum's Pectra upgrade, which combined aspects of the Electra and Prague upgrades. More ETH being locked into staking contracts suggests that investors are more confident in the network's long-term sustainability and that there is less supply in circulation, both of which encourage price pressure to rise. Additionally, the increase in staking suggests that holders anticipate higher yield and lower short-term volatility, which supports a bullish outlook.
A significant milestone has been reached in the Ethereum tokenization of real-world assets (RWAs). Just in May, tokenized U.S. Treasury prices on the Ethereum mainnet surged 12%, reaching $5 billion for the first time. This indicates that Ethereum is becoming more widely used by institutions as the backbone of actual finance. Ethereum's growing popularity for physical regulated financial products is evidence of the network's scalability, security and long-term viability.
Technically speaking, on high volume ETH has decisively broken above the 50, 100 and 200 EMA levels. A healthy reset before another leg upward may be provided by the pullback on May 11, and the RSI is still high but not extreme. It is not only possible but also likely that Ethereum will move to $3,000 if it maintains $2,500 as support.
Cardano is undergoing a major transformation as it adopts a more open and agile development model.
Charles Hoskinson, the blockchain’s founder, announced the shift on May 10, signaling a new chapter in how the network evolves.
Cardano Opens Ecosystem to Speed Up Innovation
According to Hoskinson, the new approach will allow external contributors to participate more actively in building the ecosystem. It also introduces flexible workflows to speed up innovation while preserving the platform’s security principles.
Hoskinson acknowledged that Cardano’s early design favored caution over speed. Its focus on formal verification and long-term planning helped build a secure foundation.
However, he admitted that this same approach slowed development and made it harder for outside teams to contribute.
“The team didn’t want deadlines, focused on purity of practice, and thought in terms of years and decades. This benefited us tremendously in an age of unsafe practices, but also made it difficult for Cardano to grow and thrive,” Hoskinson said.
To address this, Cardano is bringing in smaller and more adaptive teams, such as Aiken and Midgard.
These groups will work alongside established teams like Input Output’s formal verification unit, which uses advanced tools to ensure code safety. The idea is to blend speed with rigor, enabling the network to keep pace with evolving demands.
“In 2025, we are opening up the ecosystem augmented with small agile teams like Aiken and Midgard, while preserving the knowledge, experience, and rigor with IOR and our formal methods group using Agda. We also see different clients that will and should challenge the assumptions, designs, and features of prior teams to accommodate new protocols, economic realities, and our progress as a community,” Hoskinson said.
He furthered that this new hybrid approach will encourage innovation while preserving Cardano’s foundational strengths.
Meanwhile, Hoskinson acknowledged that some community members may resist change and prefer the platform’s earlier methods. Nevertheless, he believes this evolution is necessary for Cardano to reach its full potential.
“There are times I miss the old days. But the new days will be filled with even greater opportunities and exciting new capabilities. That’s the nature of all great products and projects,” the Cardano founder concluded.
The transition has already impacted Cardano’s internal structure.
Several contributors were dismissed after allegedly planning to delay the Leios upgrade to 2028. Hoskinson made it clear that such delays are no longer acceptable.
Jeff Watson, Director of Engineering at Input Output, confirmed that the team is hiring new contractors. These recruits will come from within the Cardano ecosystem and will help push the Leios upgrade forward.
“We are in the process of hiring new contractors through the Cardano ecosystem, vendors with existing Networking expertise. Some time will be needed for onboarding but this is within an acceptable timeframe,” Watson said.
Meanwhile, Cardano’s strategic shift reflects a broader trend across the blockchain industry where rival blockchain networks like Ethereum are releasing upgrades faster to maintain momentum.
Cardano is now positioning itself to do the same, without losing sight of the security-first mindset that built its reputation.
Bitcoin, the leading cryptocurrency by market capitalization, approached the $105,000 level earlier this Sunday, reaching an intraday high of $104,958 on the Bitstamp exchange.
There have now been a total of 12 days where the price of the leading cryptocurrency has closed above the highly important $100,000 mark.
It's very quiet
Despite the fact that Bitcoin is just inches away from reclaiming the $100,000 level, retail investors seemingly remain on the sidelines for now.
Fundstrat's Tom Lee has described this kind of silence as "strange," given that Bitcoin has made significant moves over the past few days.
"Funding rates are also low relative to prior price peaks. When they come, they are going to come very heavily," he said.
It is not clear whether Bitcoin will be able to sustain the current momentum and eventually reach a new record high.
In the meantime, chartist Todd Butterfield believes that Bitcoin is lightly overbought following the recent surge, meaning that the cryptocurrency might experience a slight pullback.
Todd Butterfield@WyckoffOnCryptoMay 11, 2025Our Technometer is finally overbought for #Bitcoin We look for a pullback here…. #Wyckoff pic.twitter.com/coIx7Ljn95
Prescient Reddit post
In the meantime, an extremely prescient Reddit post from 2011 predicting Bitcoin's price action recently emerged on social media.
A Reddit user (u/oldie101) made a post on the r/MarkMyWords subreddit predicting that the cryptocurrency would be able to hit $100,000 in 2025.
"Just realized why I was getting notifications. No, I didn’t hodl. Bought and sold as life moved on. Still hodl a bit, but could have been long retired if I trusted myself long ago," the user wrote a Reddit comment four days ago.
Hackers drained over $2.15 million from Mobius Token ($MBU) smart contracts on the BNB Chain in a targeted exploit detected early May 11, according to security firm Cyvers Alerts.
The attacker deployed the contract from address 0xb32a53... at 07:31:38 UTC and initiated the exploit at 07:33:56 UTC, draining funds from the victim wallet 0xb5252f...
Cyvers confirmed to Cointelegraph that the attacker used contract 0x631adf... to execute a series of malicious transactions. The smart contract drained 28.5 million MBU tokens and converted them into stablecoins, resulting in a net loss of $2,152,219.99 for the victim.
In total, the attacker stole 28.5 million MBU tokens and converted them to $2.15 million worth of USDT.
Cyvers labeled the exploit as “critical” and noted the attacker’s use of suspicious contract code and abnormal transaction patterns.
The attacker’s wallet remains active and has retained the stolen funds as of publication. Mobius Token’s team has not yet released an official statement.
“Two minutes prior to the exploit, our system identified a deployment of a malicious smart contract that eventually targeted the Mobius Token smart contracts,” Cyvers wrote on X.
Crypto losses near $360 million in April
In April 2025, blockchain security firm PeckShield reported that the space saw nearly $360 million in digital assets stolen across 18 hacking incidents.
April’s losses show a 990% increase compared to March, when crypto lost to hacks totalled about $33 million. The largest chunk of the losses came from an unauthorized Bitcoin transfer.
On April 28, blockchain investigator ZachXBT flagged a suspicious transfer of $330 million in BTC. The investigator later confirmed that the transfer was a social engineering attack targeting an elderly individual in the United States.
Global Macro CEO Raoul Pal has opined that meme cryptocurrency Dogecoin could potentially reach a new high against Bitcoin .
The chart shared by Pal shows a long-term falling wedge, which is a well-known bullish reversal pattern.
Following years of rather uneventful price action during the 2014-2021 period, Dogecoin experienced an enormous rally in 2021.
Pal appears to suggest that a similar scenario might play out this time around.
Another long-term descending channel has now formed, meaning that Dogecoin might be preparing for another massive breakout following years of price consolidation.
The chart shared by Pal shows a bull fag where the massive 2021 rally potentially acts as a flagpole.
Breaking above the upper boundary of the current descending channel could potentially set the stage for the creation of a new bull flag. In such a case, the leading meme cryptocurrency could potentially surge to the previous high (roughly 0.000017 BTC) and potentially record additional gains.
Pal has joked that Dogecoin becoming "the hardest currency on earth" would be the most amusing outcome considering its facetious nature.
交易股票、货币、商品、期货、债券、基金等金融工具或加密货币属高风险行为,这些风险包括损失您的部分或全部投资金额,所以交易并非适合所有投资者。
做出任何财务决定时,应该进行自己的尽职调查,运用自己的判断力,并咨询合格的顾问。本网站的内容并非直接针对您,我们也未考虑您的财务状况或需求。本网站所含信息不一定是实时提供的,也不一定是准确的。本站提供的价格可能由做市商而非交易所提供。您做出的任何交易或其他财务决定均应完全由您负责,并且您不得依赖通过网站提供的任何信息。我们不对网站中的任何信息提供任何保证,并且对因使用网站中的任何信息而可能造成的任何交易损失不承担任何责任。
未经本站书面许可,禁止使用、存储、复制、展现、修改、传播或分发本网站所含数据。提供本网站所含数据的供应商及交易所保留其所有知识产权。