• 交易
  • 行情
  • 跟单
  • 比赛
  • 资讯
  • 快讯
  • 日历
  • 问答
  • 聊天
热门
筛选器
资产
最新价
买价
卖价
最高
最低
涨跌额
涨跌幅
点差
SPX
标普 500 指数
6827.42
6827.42
6827.42
6899.86
6801.80
-73.58
-1.07%
--
DJI
道琼斯工业平均指数
48458.04
48458.04
48458.04
48886.86
48334.10
-245.98
-0.51%
--
IXIC
纳斯达克综合指数
23195.16
23195.16
23195.16
23554.89
23094.51
-398.69
-1.69%
--
USDX
美元指数
97.950
98.030
97.950
98.500
97.950
-0.370
-0.38%
--
EURUSD
欧元/美元
1.17394
1.17409
1.17394
1.17496
1.17192
+0.00011
+ 0.01%
--
GBPUSD
英镑/美元
1.33707
1.33732
1.33707
1.33997
1.33419
-0.00148
-0.11%
--
XAUUSD
黄金/美元
4299.39
4299.39
4299.39
4353.41
4257.10
+20.10
+ 0.47%
--
WTI
轻质原油
57.233
57.485
57.233
58.011
56.969
-0.408
-0.71%
--

社区账户

信号账户 (个)
--
盈利账户 (个)
--
亏损账户 (个)
--
查看更多

成为信号提供者

出售交易信号,享受跟单收入

查看更多

跟单功能指引

轻松无忧,即刻开始

查看更多

VIP跟单

所有跟单

收益最佳
  • 收益最佳
  • 盈亏最佳
  • 回撤最佳
近一周
  • 近一周
  • 近一月
  • 近一年

所有比赛

  • 全部
  • 推荐
  • 股票
  • 加密货币
  • 央行
  • 特朗普动态
  • 专题关注
只看重要
分享

科威特石油大臣:我们预计油价至少保持不变,甚至会更好,但油价下跌令我们感到意外。

分享

科威特认为,在当前条件下,油价在每桶60-68美元为公允价格。

分享

叙利亚日产量约为10万桶,若幼发拉底河以东的问题得到解决,该国将致力于提高产量。

分享

澳大利亚情报官员:国家恐怖主义威胁级别仍维持在“可能”级别。

分享

澳大利亚情报官员:我们正在调查社区内是否存在与袭击者有相似意图的人员。

分享

澳大利亚情报官员:我们正在调查袭击者的身份。

分享

澳大利亚总理:已向犹太人表示,澳方将投入所有必要资源,确保犹太人的安全和受保护。

分享

澳大利亚总理:警方和安全机构正在努力查明与此次袭击有关的任何人。

分享

澳大利亚警方:警方炸弹处理部门目前正在对几枚疑似简易爆炸装置进行处理。

分享

叙利亚石油部预测该国天然气产量将在2026年末增至1500万立方米。

分享

总统办公室:乌克兰总统泽连斯基已抵达德国。

分享

澳大利亚警方:现在不是报复的时候,而是要让警方履行职责。

分享

澳大利亚警方:我们已确认有两名明确的犯罪嫌疑人,但希望确保社区安全。

分享

澳大利亚警方:反恐指挥部将牵头此次调查,并有州犯罪指挥部的调查员参与。我们将彻查所有细节。

分享

澳大利亚警方:这是一起恐怖事件。

分享

乌克兰总统泽连斯基:沿目前前线实现乌克兰与俄罗斯停火将是一个公平的选择。

分享

新南威尔士州州长克里斯·明斯:这是一项庞大、复杂且刚刚开始的调查。

分享

新南威尔士州州长克里斯·明斯:邦迪枪击事件造成12人死亡

分享

乌克兰总统泽连斯基:安全保障应具有法律约束力。

分享

乌克兰总统泽连斯基:美国和欧洲的安全保障而非北约成员国资格,是乌克兰方面做出的妥协。

时间
公布值
预测值
前值
英国贸易账 (10月)

公:--

预: --

前: --

英国服务业指数月率

公:--

预: --

前: --

英国建筑业产出月率 (季调后) (10月)

公:--

预: --

前: --

英国工业产出年率 (10月)

公:--

预: --

前: --

英国贸易账 (季调后) (10月)

公:--

预: --

前: --

英国对欧盟贸易账 (季调后) (10月)

公:--

预: --

前: --

英国制造业产出年率 (10月)

公:--

预: --

前: --

英国GDP月率 (10月)

公:--

预: --

前: --

英国GDP年率 (季调后) (10月)

公:--

预: --

前: --

英国工业产出月率 (10月)

公:--

预: --

前: --

英国建筑业产出年率 (10月)

公:--

预: --

前: --

法国HICP月率终值 (11月)

公:--

预: --

前: --

中国大陆未偿还贷款增长年率 (11月)

公:--

预: --

前: --

中国大陆M2货币供应量年率 (11月)

公:--

预: --

前: --

中国大陆M0货币供应量年率 (11月)

公:--

预: --

前: --

中国大陆M1货币供应量年率 (11月)

公:--

预: --

前: --

印度CPI年率 (11月)

公:--

预: --

前: --

印度存款增长年率

公:--

预: --

前: --

巴西服务业增长年率 (10月)

公:--

预: --

前: --

墨西哥工业产值年率 (10月)

公:--

预: --

前: --

俄罗斯贸易账 (10月)

公:--

预: --

前: --

费城联储主席保尔森发表讲话
加拿大营建许可月率 (季调后) (10月)

公:--

预: --

前: --

加拿大批发销售年率 (10月)

公:--

预: --

前: --

加拿大批发库存月率 (10月)

公:--

预: --

前: --

加拿大批发库存年率 (10月)

公:--

预: --

前: --

加拿大批发销售月率 (季调后) (10月)

公:--

预: --

前: --

德国经常账 (未季调) (10月)

公:--

预: --

前: --

美国当周钻井总数

公:--

预: --

前: --

美国当周石油钻井总数

公:--

预: --

前: --

日本短观大型非制造业景气判断指数 (第四季度)

--

预: --

前: --

日本短观小型制造业前景指数 (第四季度)

--

预: --

前: --

日本短观大型非制造业前景指数 (第四季度)

--

预: --

前: --

日本短观大型制造业前景指数 (第四季度)

--

预: --

前: --

日本短观小型制造业景气判断指数 (第四季度)

--

预: --

前: --

日本短观大型制造业景气判断指数 (第四季度)

--

预: --

前: --

日本短观大型企业资本支出年率 (第四季度)

--

预: --

前: --

英国Rightmove住宅销售价格指数年率 (12月)

--

预: --

前: --

中国大陆工业产出年率 (年初至今) (11月)

--

预: --

前: --

中国大陆城镇失业率 (11月)

--

预: --

前: --

沙特阿拉伯CPI年率 (11月)

--

预: --

前: --

欧元区工业产出年率 (10月)

--

预: --

前: --

欧元区工业产出月率 (10月)

--

预: --

前: --

加拿大成屋销售月率 (11月)

--

预: --

前: --

欧元区储备资产总额 (11月)

--

预: --

前: --

英国通胀预期

--

预: --

前: --

加拿大全国经济信心指数

--

预: --

前: --

加拿大新屋开工 (11月)

--

预: --

前: --

美国纽约联储制造业就业指数 (12月)

--

预: --

前: --

美国纽约联储制造业指数 (12月)

--

预: --

前: --

加拿大核心CPI年率 (11月)

--

预: --

前: --

加拿大制造业未完成订单月率 (10月)

--

预: --

前: --

加拿大制造业新订单月率 (10月)

--

预: --

前: --

加拿大核心CPI月率 (11月)

--

预: --

前: --

加拿大制造业库存月率 (10月)

--

预: --

前: --

加拿大CPI年率 (11月)

--

预: --

前: --

加拿大CPI月率 (11月)

--

预: --

前: --

加拿大CPI年率 (季调后) (11月)

--

预: --

前: --

加拿大核心CPI月率 (季调后) (11月)

--

预: --

前: --

加拿大CPI月率 (季调后) (11月)

--

预: --

前: --

专家问答
    • 全部
    • 聊天室
    • 群聊
    • 好友
    正在连接聊天室
    .
    .
    .
    请输入...
    添加资产名称或代码

      无匹配数据

      全部
      推荐
      股票
      加密货币
      央行
      特朗普动态
      专题关注
      • 全部
      • 俄乌冲突
      • 中东焦点
      • 全部
      • 俄乌冲突
      • 中东焦点
      搜索
      产品

      图表 永久免费

      聊天 专家问答
      筛选器 财经日历 数据 工具
      会员 功能特色
      数据中心 市场动向 机构数据 央行利率 宏观经济

      市场动向

      投机情绪 挂单持仓 品种相关性

      热门指标

      图表 永久免费
      市场

      资讯

      新闻 分析 快讯 专栏 学习
      机构观点 分析师观点
      专栏话题 专栏作家

      最新观点

      最新观点

      热门话题

      热门作家

      最近更新

      信号

      跟单 排行榜 最新信号 成为信号提供者 AI评级
      比赛
      Brokers

      概览 交易商 评测 榜单 监管机构 新闻 维权
      交易商列表 交易商对比 实时点差对比 虚假交易商
      问答 投诉 维权一时间 防骗宝典
      更多

      商业
      活动
      招聘 关于我们 广告合作 帮助中心

      白标

      数据API

      网页插件

      代理计划

      红人评选 机构评选 IB研讨会 沙龙活动 展会
      越南 泰国 新加坡 迪拜
      粉丝见面会 投资分享会
      FastBull 峰会 BrokersView 展会
      最近搜索
        热门搜索
          行情
          新闻
          分析
          用户
          快讯
          财经日历
          学习
          数据
          • 名称
          • 最新值
          • 前值

          查看所有搜索结果

          暂无数据

          扫一扫,下载

          Faster Charts, Chat Faster!

          下载APP
          简中
          • English
          • Español
          • العربية
          • Bahasa Indonesia
          • Bahasa Melayu
          • Tiếng Việt
          • ภาษาไทย
          • Français
          • Italiano
          • Türkçe
          • Русский язык
          • 简中
          • 繁中
          开户
          搜索
          产品
          图表 永久免费
          市场
          资讯
          信号

          跟单 排行榜 最新信号 成为信号提供者 AI评级
          比赛
          Brokers

          概览 交易商 评测 榜单 监管机构 新闻 维权
          交易商列表 交易商对比 实时点差对比 虚假交易商
          问答 投诉 维权一时间 防骗宝典
          更多

          商业
          活动
          招聘 关于我们 广告合作 帮助中心

          白标

          数据API

          网页插件

          代理计划

          红人评选 机构评选 IB研讨会 沙龙活动 展会
          越南 泰国 新加坡 迪拜
          粉丝见面会 投资分享会
          FastBull 峰会 BrokersView 展会

          Ethereum ETF Frenzy: Inflows Jump 5x While Bitcoin Stalls

          NewsBTC
          1inch/Tether
          -4.37%
          Vaulta/Tether
          -1.58%
          AAVE/Tether
          -2.05%

          Data shows the Ethereum spot exchange-traded funds (ETFs) have seen weekly inflows five times the recent average, while Bitcoin has seen a slowdown in momentum.

          Ethereum Spot ETFs Have Seen 154,000 ETH In Inflows This Week

          In a new post on X, the analytics firm Glassnode has talked about the latest trend in the netflow related to the US-based Ethereum spot ETFs. The “spot ETFs” refer to investment vehicles that allow an alternate means of exposure to a given asset.

          This means that with a spot ETF, a trader can ‘invest’ into an asset without having to directly own it. In the context of cryptocurrencies, this is especially relevant, as the ETFs trade on traditional platforms. Some investors may not want to fiddle with digital asset exchanges and wallets, so the ETFs offer them a familiar path into cryptocurrencies.

          The option of the spot ETFs is a relatively recent one in the sector, with Bitcoin’s version gaining approval from the US Securities and Exchange Commission (SEC) at the start of 2024 and Ethereum’s in mid-2024.

          Below is a chart that shows how the netflows related to the latter’s spot ETFs have looked during the past month.

          Ethereum ETF Netflows

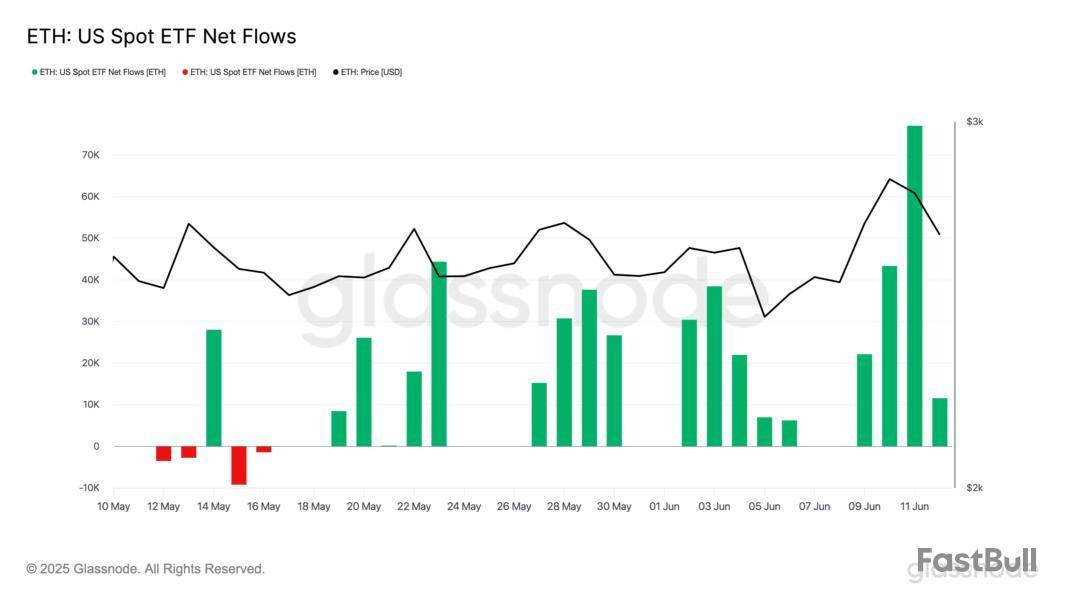
          From the graph, it’s visible that the Ethereum US spot ETFs have been witnessing net inflows for the last few weeks, a sign that there has been demand for the coin from the traditional investors.

          “This week alone, they’ve seen 154K ETH in inflows – 5x higher than their recent weekly average,” notes Glassnode. “For context: the biggest single-day ETH inflow this month was 77K ETH on June 11th.”

          While the trend has been that of growth for Ethereum, it has looked a bit more mixed when it comes to the number one digital asset, Bitcoin.

          Bitcoin spot ETFs

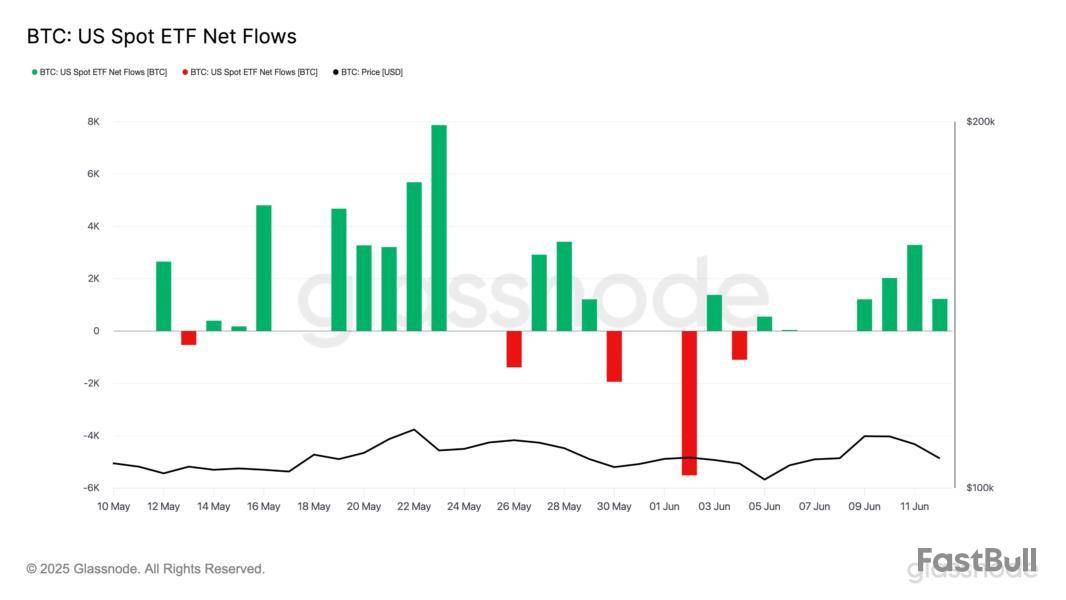
          As displayed in the above graph, the Bitcoin US spot ETFs have also seen positive netflows this week. The scale of the inflows, however, hasn’t been anything impressive, as only around 7,800 BTC has entered into the ETFs.

          This is above average, but far lower than the highs witnessed in May, when at one point the daily inflow had reached a peak of 7,900 BTC, more than the inflows for the entire current week.

          Last week, the Bitcoin spot ETFs witnessed an outright negative netflow, so it seems the momentum has recently just been slower for the asset. In contrast, things have looked much more green for Ethereum indeed.

          ETH Price

          While Ethereum has been seeing consistent ETF inflows, its price has still underperformed against Bitcoin over the past day as it has dropped to $2,540, a decline of 7% compared to BTC’s 2% loss.

          风险提示及免责条款
          市场有风险,投资需谨慎。本文内容仅供参考,不构成个人投资建议,也未考虑到某些用户特殊的投资目标、财务状况或其他需要。据此投资,责任自负。
          收藏
          分享

          Trump Media’s Bitcoin treasury registration ‘declared effective’ by SEC

          Cointelegraph
          1inch/Tether
          -4.37%
          Vaulta/Tether
          -1.58%
          AAVE/Tether
          -2.05%

          Trump Media and Technology Group (TMTG), the company that owns US President Donald Trump’s Truth Social platform and is partially owned by the president, has received approval from the US Securities and Exchange Commission (SEC) for its registration statement tied to its $2.3 billion Bitcoin treasury deal.

          According to a June 13 SEC filing, the agency “declared effective” TMTG’s S-3 registration statement — filed on June 6 — for the Bitcoin (BTC) treasury deal. The S-3 is a form that US companies use to register the sale of various securities, like stocks, options, and different types of debt. TMTG filed a corresponding final prospectus with the SEC on the same day.

          Trump Media’s CEO says the firm is “aggressively” expanding

          The SEC filing said that, as part of its Bitcoin treasury plan, TMTG registered the resale of approximately 56 million shares and 29 million more tied to convertible notes as part of debt and equity agreements with around 50 investors, which yielded $2.3 billion.

          Although the registration statement includes a universal shelf to give TMTG “greater flexibility” for future growth plans, the company currently has “no immediate plans” to issue any securities under it.

          Cryptocurrencies, United States, Donald Trump

          Trump Media’s CEO and President Devin Nunes said, “We’re aggressively implementing our plans to expand the Company, our offerings, and our capabilities.” Nunes added:

          “By simultaneously enhancing and growing our social media platform, TV streaming platform, and our fintech brand while establishing a Bitcoin treasury, we aim to continue rapidly transforming Trump Media into an indispensable company for the expanding customer base of the Patriot Economy.”

          On the same day, TMTG’s stock price fell 2.06%, closing the trading day at $19.52, according to Google Finance data.

          Cryptocurrencies, United States, Donald Trump

          It comes only weeks after the company confirmed a $2.5 billion capital raise to purchase Bitcoin on May 27 after denying earlier reports of the deal.

          At the time, Nunes said that TMTG views “Bitcoin as an apex instrument of financial freedom, and now Trump Media will hold cryptocurrency as a crucial part of our assets.”

          TMTG recently filed to launch a spot Bitcoin ETF

          Blockchain analysis company Arkham said in a May 28 X post, “Donald Trump’s company, Trump Media, will buy $2.5 BILLION of Bitcoin. Is Trump about to go Saylor Mode?”

          Meanwhile, on June 5, TMTG filed with the SEC to launch a Bitcoin exchange-traded fund (ETF).

          “The assets of the Trust consist primarily of Bitcoin held by a custodian on behalf of the Trust. The Trust seeks to reflect generally the performance of the price of Bitcoin,” TMTG said in a June 5 filing.

          风险提示及免责条款
          市场有风险,投资需谨慎。本文内容仅供参考,不构成个人投资建议,也未考虑到某些用户特殊的投资目标、财务状况或其他需要。据此投资,责任自负。
          收藏
          分享

          Bitcoin Drops Below $105K as Binance Net Taker Volume Turns Deep Red

          NewsBTC
          1inch/Tether
          -4.37%
          Vaulta/Tether
          -1.58%
          AAVE/Tether
          -2.05%

          Bitcoin’s recent rally appears to have paused as the asset declined to just above $104,000 following a 2.1% drop over the past 24 hours. This latest movement signals a potential shift in short-term market momentum, with traders increasingly opting to exit positions.

          While the broader cryptocurrency market has experienced similar pullbacks, Bitcoin’s trajectory is attracting closer scrutiny due to its influence on overall sentiment and market structure.

          Analysts are looking into how external factors, particularly geopolitical developments, are impacting trading behavior. One such development is the reported military engagement between Israel and Iran on June 13, which triggered sell pressure across high-risk assets, including digital currencies.

          Amid these events, key metrics on Binance, particularly Net Taker Volume, are showing increased sell-side dominance, suggesting short-term volatility may continue.

          Binance Net Taker Volume Hits Multi-Week Low Amid Bitcoin Panic Selling

          According to on-chain analyst Amr Taha on CryptoQuant’s QuickTake platform, Bitcoin’s Net Taker Volume on Binance fell to -$197 million, the most negative reading since June 6.

          This metric, which compares aggressive selling to aggressive buying, indicates heightened urgency among traders to sell at market prices, bypassing limit orders. The seven-hour moving average (7HMA) has remained in negative territory since June 12, reinforcing the current downward pressure.

          Bitcoin Net Taker Volume on Binance.

          Historically, such extremes in net taker volume have been linked to local price bottoms, as they often signal panic-induced capitulation by retail and overleveraged traders.

          Taha highlighted that a similar event occurred on June 6, followed by a 4% rebound in Bitcoin’s price within 24 hours. The implication is that, while aggressive selling may signal weakness, it also presents conditions that have previously preceded price reversals.

          Geopolitical Shock Triggers Liquidation Cascade, May Signal Local Bottom

          Taha also pointed to the geopolitical backdrop, specifically the sudden escalation between Israel and Iran, as a major catalyst for recent market behavior. News of the strike led to a surge in liquidation activity, especially among long-leveraged positions.

          The correlation between the timing of the conflict and the spike in Binance sell volume suggests that traders are reacting to broader market uncertainty, contributing to downward momentum.

          Despite this, Taha still views these conditions as potentially bullish in the medium term. Heavy selling often flushes out weaker hands, creating opportunities for long-term holders or institutional participants to accumulate positions at lower prices.

          Taha suggests that while the short-term outlook remains volatile, the current setup resembles previous recovery phases, marked by contrarian buying and reduced selling pressure.

          Featured image created with DALL-e, Chart from TradingView

          风险提示及免责条款
          市场有风险,投资需谨慎。本文内容仅供参考,不构成个人投资建议,也未考虑到某些用户特殊的投资目标、财务状况或其他需要。据此投资,责任自负。
          收藏
          分享

          Bitcoin Following ABCD Pattern? Analyst Sees Path To $137,000

          NewsBTC
          1inch/Tether
          -4.37%
          Vaulta/Tether
          -1.58%
          AAVE/Tether
          -2.05%

          Brewing tensions between Israel and Iran have triggered global de-risking across risk-on assets, including Bitcoin (BTC). The top cryptocurrency by market cap is down 1.7% over the past 24 hours. That said, technical indicators still point toward a potential new all-time high (ATH) for BTC in the coming months.

          Bitcoin Tracing The ABCD Pattern

          According to a recent post on X by crypto analyst Titan of Crypto, BTC appears to be following the ABCD pattern. The analyst noted that Bitcoin is currently trading within a wedge formation and could target as high as $137,000 if it breaks out.

          titan

          For the uninitiated, the ABCD pattern is a classic chart setup with four points and three legs – AB, BC, and CD – where AB and CD are typically equal in length, and BC serves as the retracement. It helps identify potential reversal zones and signals when a price move may be losing momentum.

          Several other technical indicators also point to a potential new ATH for BTC. For instance, crypto analyst Crypto Caesar shared the following 4-hour Bitcoin chart highlighting a bullish double bottom pattern that suggests BTC is primed for recovery.

          caesar

          Fellow crypto commentator Jelle identified a cup and handle pattern on the daily BTC chart. Jelle shared the following chart showing that BTC has already formed the “cup” and is now beginning to shape the “handle,” which typically precedes a sharp upward move.

          jelle

          Meanwhile, crypto trader Merlijn the Trader pointed to the Hash Ribbons – an on-chain indicator historically associated with major rallies. Merlijn shared the following BTC daily chart, noting that the last four appearances of this signal preceded strong Bitcoin uptrends.

          merlijn

          To explain, Hash Ribbons is an on-chain indicator that uses Bitcoin’s 30-day and 60-day hash rate moving averages (MA) to spot miner capitulation and recovery. A bullish signal appears when the short-term average crosses above the long-term one.

          Are BTC Bears Regaining Ground?

          Although BTC remains above the psychologically important $100,000 mark, some concerning signs are beginning to emerge. The cryptocurrency was recently rejected from the $110,000 resistance level again, giving bears temporary control.

          Similarly, on-chain data shows that long-term holders are beginning to exit the Bitcoin market which retail investors are starting to join in. Such dynamics are typically observed during the late phase of a bull cycle.

          In parallel, short-term holders are showing signs of declining confidence in BTC, as reflected in recent on-chain activity. At the time of writing, BTC trades at $105,568, down 1.7% over the past 24 hours.

          bitcoin
          风险提示及免责条款
          市场有风险,投资需谨慎。本文内容仅供参考,不构成个人投资建议,也未考虑到某些用户特殊的投资目标、财务状况或其他需要。据此投资,责任自负。
          收藏
          分享

          A Rare Bitcoin Signal Is Flashing: Could the Bull Run Just Be Getting Started?

          NewsBTC
          1inch/Tether
          -4.37%
          Vaulta/Tether
          -1.58%
          AAVE/Tether
          -2.05%

          Bitcoin’s market price has experienced renewed downward pressure, falling to just under $106,000 in the last 24 hours. This marks a 1.8% dip over the past day and places the asset approximately 6% below its all-time high of over $111,000 reached last month.

          While the correction is not severe compared to historical volatility, it highlights ongoing uncertainty in the market as BTC consolidates near record highs without sustained upward momentum.

          One metric drawing attention amid this price movement is the Puell Multiple, a tool used to evaluate whether Bitcoin is overvalued or undervalued relative to miner income.

          Bitcoin Puell Multiple Suggests Miner Revenues Have Yet to Catch Up

          CryptoQuant analyst Gaah highlighted that while prices recently surged above $108,000, the Puell Multiple remains below 1.40, a level typically associated with discounted or non-euphoric market phases.

          This decoupling between BTC price and miner revenue offers insight into how recent gains may be more demand-driven than organically supported by on-chain mining fundamentals.

          The Puell Multiple measures the daily issuance of BTC in USD terms relative to its 365-day moving average. Historically, readings below 1.0 are seen during market bottoms or accumulation phases, indicating undervaluation.

          Bitcoin puell multiple indicator. |

          Gaah points out that current readings hovering around 1.40 suggest miner profitability is still lagging, even as the asset trades near historic highs. This pattern contrasts with previous bull cycles where high prices were often accompanied by elevated miner earnings, driven by both network activity and block rewards.

          This disparity may be due in part to the April 2024 Bitcoin halving event, which reduced block rewards from 6.25 BTC to 3.125 BTC per block. While halving events typically drive price appreciation through reduced supply, they simultaneously put downward pressure on miner revenue.

          In this case, despite a climb in market price, the halving’s impact continues to suppress income for miners, implying that the price increase has not yet been accompanied by the kind of broader economic expansion that would traditionally drive a full-fledged bull market.

          Potential for Continued Growth as Institutional Forces Drive Demand

          Gaah also points to the possibility that external factors may be playing a more dominant role in driving recent price action. These include increasing institutional inflows through spot Bitcoin ETFs, as well as a tighter circulating supply as long-term holders reduce active selling.

          These forces could be supporting price without necessarily boosting miner profitability in the short term, especially if the uptick is concentrated in secondary market demand rather than new BTC issuance.

          The current environment may signal a unique window for participants analyzing Bitcoin’s valuation. A high market price combined with conservative fundamentals suggests the market is not yet in a speculative excess phase.

          If miner revenues eventually rise in line with growing demand, driven by either increased transaction fees or broader network usage, it could support further upside. As such, both technical and fundamental indicators may continue to evolve in the coming months, offering a clearer view of whether the current cycle has more room to run.

          Featured image created with DALL-E, Chart from TradingView

          风险提示及免责条款
          市场有风险,投资需谨慎。本文内容仅供参考,不构成个人投资建议,也未考虑到某些用户特殊的投资目标、财务状况或其他需要。据此投资,责任自负。
          收藏
          分享

          7 Solana ETF hopefuls file S-1s, but more ‘back and forth’ with SEC ahead

          Cointelegraph
          1inch/Tether
          -4.37%
          Vaulta/Tether
          -1.58%
          AAVE/Tether
          -2.05%
          风险提示及免责条款
          市场有风险,投资需谨慎。本文内容仅供参考,不构成个人投资建议,也未考虑到某些用户特殊的投资目标、财务状况或其他需要。据此投资,责任自负。
          收藏
          分享

          Shiba Inu (SHIB): Broke Now, Massive Bitcoin (BTC) Jump, XRP: Recipe for $3 Bounce

          U.Today
          1inch/Tether
          -4.37%
          Vaulta/Tether
          -1.58%
          AAVE/Tether
          -2.05%

          Short-term holders may face serious repercussions after Shiba Inu recently broke through a crucial support level. SHIB has dropped by almost 3% today and is currently trading at about $0.00001187, well below the crucial technical barrier of $0.00001231, which served as a launching pad for rallies in April and May. 

          Following several unsuccessful attempts to break above resistance close to the 50-day and 100-day EMAs, which are both presently convergent around $0.0000138-$0.0000140, the market broke through this floor. The asset has sunk so far into bearish territory that the 200-day EMA, which is situated further above at $0.00001546, has remained unchanged for weeks. The volume of this breakdown spike is also concerning because there is not any obvious buying support to intervene, leaving SHIB open to further declines.  Chart by TradingView">

          The RSI at 32.79 indicates that the token is almost oversold, but it is too soon to consider this a dip-buying opportunity in the absence of any obvious reversal signals. As of right now, investors should not anticipate a recovery rally unless SHIB can swiftly and heavily retake the $0.0000123 zone.

          If not, momentum will probably push the asset lower toward the psychological $0.00001000 level, which is a significant round number and the last line of defense before panic-selling gets worse. The general sentiment of the market exacerbates the situation. In times of declining risk appetite, meme-based assets like SHIB are typically the first to be dumped. It is reasonable to anticipate further declines or at most stagnation unless there is an unexpected catalyst (a burn event, whale movement or integration news, for example).

          Bitcoin's direct hit

          Following a textbook recovery, all eyes are on what will happen next with Bitcoin . Directly off the 50-day EMA, Bitcoin experienced a rapid reversal back toward $105,000, following a precipitous decline to $102,816. Such a response at a crucial technical support level indicates the existence of aggressive interest in dip buying as well as potentially algorithmic activity in the vicinity of moving averages.

          The action was taken shortly after a significant liquidation cascade that we previously reported on, which consisted of a series of lengthy liquidations that went above and beyond expectations and cleared out overly leveraged positions. As the sell pressure subsided and buyers intervened at support, that aggressive flush set the stage for a countermove. One factor, though, cannot be disregarded: descending volume. The volume did not rise proportionately to the strong candle recovery. 

          Bulls' lack of conviction could indicate that this is a temporary relief bounce rather than a return to the trend. It makes sense that market participants would be cautious. Although there may still be room to run without crossing overbought territory, the RSI, which is currently at 53.75, indicates that momentum is not as strong as it was when Bitcoin tested its all-time high of $112,000 in early June. 

          That level is still the main psychological barrier, and a retest might take longer to occur if there is not a clear trigger. In the short term, bulls are likely to keep control if Bitcoin stays above the 50 EMA (~$103,000) and does not fall below $102,000. The 100-day EMA may provide the next line of defense if risk shifts back toward $98,000.

          XRP's last chance

          Even though XRP is holding onto its last line of defense, bulls may need it to engineer a dramatic reversal. The asset has retreated toward the 200-day moving average, which now serves as a crucial turning point for any possible recovery and is currently trading close to $2.14. Despite recent rejection in the $2.40-2.50 range, XRP has not yet made a clear break. 

          Moving averages, especially the 50, 100 and 200-day EMAs, are converging and compressing the price into a tight structure, indicating that a high-volatility move may be imminent. Red candles notwithstanding, this consolidation might be a traditional springboard configuration. Since the RSI is still neutral at about 45, neither side has yet to experience severe exhaustion. 

          A bounce toward $2.60 and ultimately a retest of $3 is still possible if bulls defend the 200 EMA and the price stays above $2.09. But at the moment, bears are gaining momentum. Over the past few sessions, the volume has been decreasing, suggesting that neither side is very convinced. On a red day, if volume increases and XRP closes below the 200 EMA, a steeper sell-off toward $1.85 or less is probably in store. 

          However, for traders and long-term investors, considering an entry this might be a unique chance. As there is currently no structural breakdown and a slow bleed into key support, the current setup is similar to past XRP price action that has preceded significant reversals.

          风险提示及免责条款
          市场有风险,投资需谨慎。本文内容仅供参考,不构成个人投资建议,也未考虑到某些用户特殊的投资目标、财务状况或其他需要。据此投资,责任自负。
          收藏
          分享
          FastBull
          Copyright © 2025 FastBull Ltd

          728 RM B 7/F GEE LOK IND BLDG NO 34 HUNG TO RD KWUN TONG KLN HONG KONG

          TelegramInstagramTwitterfacebooklinkedin
          App Store Google Play Google Play
          产品
          图表

          聊天

          专家问答
          筛选器
          财经日历
          数据
          工具
          会员
          功能特色
          功能
          行情
          跟单交易
          最新信号
          比赛
          新闻
          分析
          快讯
          专栏
          学习
          公司
          招聘
          关于我们
          联系我们
          广告合作
          帮助中心
          意见反馈
          用户协议
          隐私政策
          商业

          白标

          数据API

          网页插件

          海报制作

          代理计划

          风险披露

          交易股票、货币、商品、期货、债券、基金等金融工具或加密货币属高风险行为,这些风险包括损失您的部分或全部投资金额,所以交易并非适合所有投资者。

          做出任何财务决定时,应该进行自己的尽职调查,运用自己的判断力,并咨询合格的顾问。本网站的内容并非直接针对您,我们也未考虑您的财务状况或需求。本网站所含信息不一定是实时提供的,也不一定是准确的。本站提供的价格可能由做市商而非交易所提供。您做出的任何交易或其他财务决定均应完全由您负责,并且您不得依赖通过网站提供的任何信息。我们不对网站中的任何信息提供任何保证,并且对因使用网站中的任何信息而可能造成的任何交易损失不承担任何责任。

          未经本站书面许可,禁止使用、存储、复制、展现、修改、传播或分发本网站所含数据。提供本网站所含数据的供应商及交易所保留其所有知识产权。

          未登录

          登录查看更多功能

          FastBull会员

          未开通

          开通

          成为信号提供者
          帮助中心
          客服
          暗黑模式
          涨跌颜色

          登录

          注册

          停靠侧
          布局
          全屏
          默认进入图表
          访问 fastbull.com 时,默认进入图表页面