• 交易
  • 行情
  • 跟单
  • 比赛
  • 资讯
  • 快讯
  • 日历
  • 问答
  • 聊天
热门
筛选器
资产
最新价
买价
卖价
最高
最低
涨跌额
涨跌幅
点差
SPX
标普 500 指数
6827.42
6827.42
6827.42
6899.86
6801.80
-73.58
-1.07%
--
DJI
道琼斯工业平均指数
48458.04
48458.04
48458.04
48886.86
48334.10
-245.98
-0.51%
--
IXIC
纳斯达克综合指数
23195.16
23195.16
23195.16
23554.89
23094.51
-398.69
-1.69%
--
USDX
美元指数
97.980
98.060
97.980
98.020
97.980
+0.030
+ 0.03%
--
EURUSD
欧元/美元
1.17389
1.17397
1.17389
1.17402
1.17285
-0.00005
0.00%
--
GBPUSD
英镑/美元
1.33683
1.33696
1.33683
1.33732
1.33580
-0.00024
-0.02%
--
XAUUSD
黄金/美元
4302.71
4303.15
4302.71
4307.76
4294.68
+3.32
+ 0.08%
--
WTI
轻质原油
57.404
57.441
57.404
57.405
57.194
+0.171
+ 0.30%
--

社区账户

信号账户 (个)
--
盈利账户 (个)
--
亏损账户 (个)
--
查看更多

成为信号提供者

出售交易信号,享受跟单收入

查看更多

跟单功能指引

轻松无忧,即刻开始

查看更多

VIP跟单

所有跟单

收益最佳
  • 收益最佳
  • 盈亏最佳
  • 回撤最佳
近一周
  • 近一周
  • 近一月
  • 近一年

所有比赛

  • 全部
  • 推荐
  • 股票
  • 加密货币
  • 央行
  • 特朗普动态
  • 专题关注
只看重要
分享

消息人士和数据:委内瑞拉石油出口在美国扣押油轮后大幅下降。

分享

【行情】澳大利亚标普200指数早盘下跌0.6%,报8647.60点。

分享

日本野村证券CEO:计划在日本培育直接贷款市场。

分享

日本野村证券CEO:计划从海外引入私人债务方面的专业知识。

分享

汇丰银行:方案考虑指有关恒生银行私有化的建议。

分享

【报道:Spacex启动华尔街投行竞标,为潜在Ipo甄选承销商】据知情人士透露,Spacex高管已启动华尔街投行甄选程序,为公司首次公开募股(Ipo)提供顾问服务。知情人士表示,多家投行定于本周进行首轮提案,这一过程被称为 “竞标角逐”(Bake-Off),是这家火箭制造商朝着可能成为 “重磅Ipo” 迈出的最具体步骤。

分享

新西兰联储:奥克兰储蓄银行已配合新西兰联储的工作,并承认对所有七项诉讼缘由负有责任。

分享

新西兰联储:因违反《反洗钱和反恐怖融资法》核心要求而提起的法院诉讼自至少2019年12月开始。

分享

官方计票结果显示,智利总统选举第二轮投票中,Jose Antonio Kast领先,已清点4.46%的选票。

分享

俄罗斯莫斯科市长:俄罗斯防空部队摧毁了一架飞往莫斯科的无人机。

分享

澳大利亚证券投资委员会:澳大利亚证券投资委员会和澳联储将加强审查,以提升其联合监管模式。

分享

美国中东特使威特科夫:在柏林举行的俄罗斯/乌克兰战争问题会谈上取得了许多进展。

分享

叙利亚总统沙拉就美国士兵在叙利亚阵亡向美国总统特朗普表示慰问。

分享

西非国家经济共同体委员会主席:西非经共体拒绝几内亚比绍军政府的过渡计划,要求恢复宪法秩序。

分享

【行情】周日(12月14日),孟加拉DSE广义指数收跌0.62%,报4932.97点。

分享

美国总统特朗普:很快就会选择新的美联储主席。

分享

美国总统特朗普:通胀“完全被抵消了”,你们不希望看到通缩。

分享

美国总统特朗普:袭击叙利亚境内美军的势力将付出惨重代价。

分享

美国总统特朗普:邦迪海滩发生了一起可怕的袭击事件。

分享

叙利亚内政部:逮捕帕尔米拉美国和叙利亚军队枪击案的五名嫌疑人。

时间
公布值
预测值
前值
英国贸易账 (10月)

公:--

预: --

前: --

英国服务业指数月率

公:--

预: --

前: --

英国建筑业产出月率 (季调后) (10月)

公:--

预: --

前: --

英国工业产出年率 (10月)

公:--

预: --

前: --

英国贸易账 (季调后) (10月)

公:--

预: --

前: --

英国对欧盟贸易账 (季调后) (10月)

公:--

预: --

前: --

英国制造业产出年率 (10月)

公:--

预: --

前: --

英国GDP月率 (10月)

公:--

预: --

前: --

英国GDP年率 (季调后) (10月)

公:--

预: --

前: --

英国工业产出月率 (10月)

公:--

预: --

前: --

英国建筑业产出年率 (10月)

公:--

预: --

前: --

法国HICP月率终值 (11月)

公:--

预: --

前: --

中国大陆未偿还贷款增长年率 (11月)

公:--

预: --

前: --

中国大陆M2货币供应量年率 (11月)

公:--

预: --

前: --

中国大陆M0货币供应量年率 (11月)

公:--

预: --

前: --

中国大陆M1货币供应量年率 (11月)

公:--

预: --

前: --

印度CPI年率 (11月)

公:--

预: --

前: --

印度存款增长年率

公:--

预: --

前: --

巴西服务业增长年率 (10月)

公:--

预: --

前: --

墨西哥工业产值年率 (10月)

公:--

预: --

前: --

俄罗斯贸易账 (10月)

公:--

预: --

前: --

费城联储主席保尔森发表讲话
加拿大营建许可月率 (季调后) (10月)

公:--

预: --

前: --

加拿大批发销售年率 (10月)

公:--

预: --

前: --

加拿大批发库存月率 (10月)

公:--

预: --

前: --

加拿大批发库存年率 (10月)

公:--

预: --

前: --

加拿大批发销售月率 (季调后) (10月)

公:--

预: --

前: --

德国经常账 (未季调) (10月)

公:--

预: --

前: --

美国当周钻井总数

公:--

预: --

前: --

美国当周石油钻井总数

公:--

预: --

前: --

日本短观大型非制造业景气判断指数 (第四季度)

--

预: --

前: --

日本短观小型制造业前景指数 (第四季度)

--

预: --

前: --

日本短观大型非制造业前景指数 (第四季度)

--

预: --

前: --

日本短观大型制造业前景指数 (第四季度)

--

预: --

前: --

日本短观小型制造业景气判断指数 (第四季度)

--

预: --

前: --

日本短观大型制造业景气判断指数 (第四季度)

--

预: --

前: --

日本短观大型企业资本支出年率 (第四季度)

--

预: --

前: --

英国Rightmove住宅销售价格指数年率 (12月)

--

预: --

前: --

中国大陆工业产出年率 (年初至今) (11月)

--

预: --

前: --

中国大陆城镇失业率 (11月)

--

预: --

前: --

沙特阿拉伯CPI年率 (11月)

--

预: --

前: --

欧元区工业产出年率 (10月)

--

预: --

前: --

欧元区工业产出月率 (10月)

--

预: --

前: --

加拿大成屋销售月率 (11月)

--

预: --

前: --

欧元区储备资产总额 (11月)

--

预: --

前: --

英国通胀预期

--

预: --

前: --

加拿大全国经济信心指数

--

预: --

前: --

加拿大新屋开工 (11月)

--

预: --

前: --

美国纽约联储制造业就业指数 (12月)

--

预: --

前: --

美国纽约联储制造业指数 (12月)

--

预: --

前: --

加拿大核心CPI年率 (11月)

--

预: --

前: --

加拿大制造业未完成订单月率 (10月)

--

预: --

前: --

加拿大制造业新订单月率 (10月)

--

预: --

前: --

加拿大核心CPI月率 (11月)

--

预: --

前: --

加拿大制造业库存月率 (10月)

--

预: --

前: --

加拿大CPI年率 (11月)

--

预: --

前: --

加拿大CPI月率 (11月)

--

预: --

前: --

加拿大CPI年率 (季调后) (11月)

--

预: --

前: --

加拿大核心CPI月率 (季调后) (11月)

--

预: --

前: --

加拿大CPI月率 (季调后) (11月)

--

预: --

前: --

专家问答
    • 全部
    • 聊天室
    • 群聊
    • 好友
    正在连接聊天室
    .
    .
    .
    请输入...
    添加资产名称或代码

      无匹配数据

      全部
      推荐
      股票
      加密货币
      央行
      特朗普动态
      专题关注
      • 全部
      • 俄乌冲突
      • 中东焦点
      • 全部
      • 俄乌冲突
      • 中东焦点
      搜索
      产品

      图表 永久免费

      聊天 专家问答
      筛选器 财经日历 数据 工具
      会员 功能特色
      数据中心 市场动向 机构数据 央行利率 宏观经济

      市场动向

      投机情绪 挂单持仓 品种相关性

      热门指标

      图表 永久免费
      市场

      资讯

      新闻 分析 快讯 专栏 学习
      机构观点 分析师观点
      专栏话题 专栏作家

      最新观点

      最新观点

      热门话题

      热门作家

      最近更新

      信号

      跟单 排行榜 最新信号 成为信号提供者 AI评级
      比赛
      Brokers

      概览 交易商 评测 榜单 监管机构 新闻 维权
      交易商列表 交易商对比 实时点差对比 虚假交易商
      问答 投诉 维权一时间 防骗宝典
      更多

      商业
      活动
      招聘 关于我们 广告合作 帮助中心

      白标

      数据API

      网页插件

      代理计划

      红人评选 机构评选 IB研讨会 沙龙活动 展会
      越南 泰国 新加坡 迪拜
      粉丝见面会 投资分享会
      FastBull 峰会 BrokersView 展会
      最近搜索
        热门搜索
          行情
          新闻
          分析
          用户
          快讯
          财经日历
          学习
          数据
          • 名称
          • 最新值
          • 前值

          查看所有搜索结果

          暂无数据

          扫一扫,下载

          Faster Charts, Chat Faster!

          下载APP
          简中
          • English
          • Español
          • العربية
          • Bahasa Indonesia
          • Bahasa Melayu
          • Tiếng Việt
          • ภาษาไทย
          • Français
          • Italiano
          • Türkçe
          • Русский язык
          • 简中
          • 繁中
          开户
          搜索
          产品
          图表 永久免费
          市场
          资讯
          信号

          跟单 排行榜 最新信号 成为信号提供者 AI评级
          比赛
          Brokers

          概览 交易商 评测 榜单 监管机构 新闻 维权
          交易商列表 交易商对比 实时点差对比 虚假交易商
          问答 投诉 维权一时间 防骗宝典
          更多

          商业
          活动
          招聘 关于我们 广告合作 帮助中心

          白标

          数据API

          网页插件

          代理计划

          红人评选 机构评选 IB研讨会 沙龙活动 展会
          越南 泰国 新加坡 迪拜
          粉丝见面会 投资分享会
          FastBull 峰会 BrokersView 展会

          Bitcoin yet to hit $150K because outsiders are ghosting — Michael Saylor

          Cointelegraph
          Jito Staked SOL/Tether
          -0.61%
          1inch/Tether
          -1.31%
          AAVE/Tether
          -1.66%
          Fusionist/Tether
          -1.28%

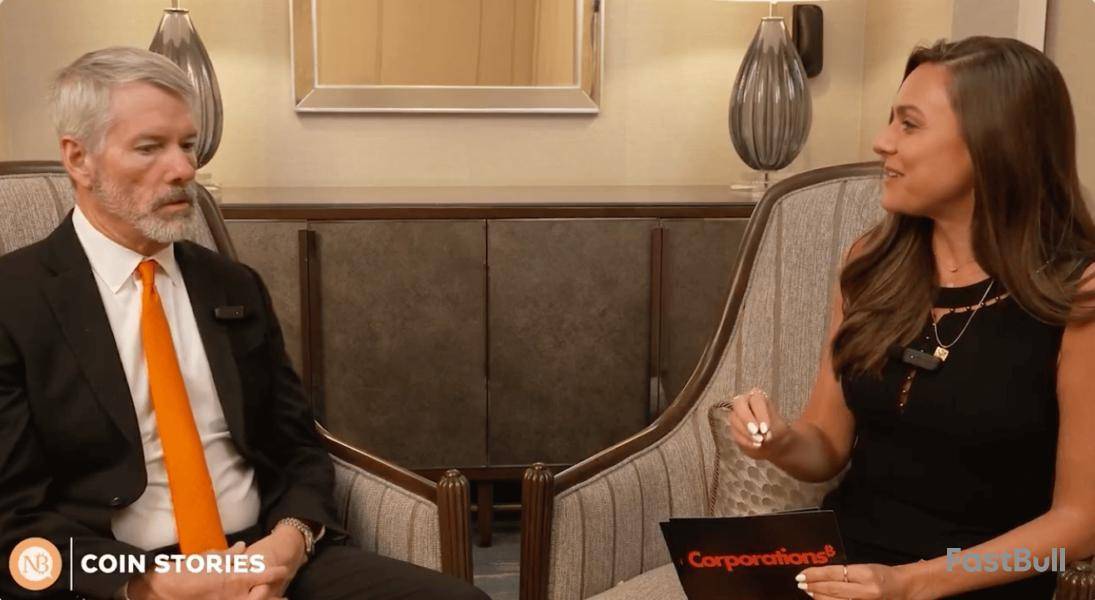
          Strategy founder Michael Saylor says Bitcoin hasn’t reached $150,000 yet because holders without a long-term outlook have been selling off while a new cohort of investors are beginning to enter the market.

          “I think we’re going through a rotation right now,” Saylor said on the Coin Stories podcast with Natalie Brunell on May 9.

          The lack of “10-year investor mindset” led to Bitcoin sell-off

          Saylor said “lots of non-economically interested parties are rotating out of the asset.” However, at the same time, “a new cohort of investors are entering.”

          “A lot of Bitcoin, for whatever reason, was left in the hands of the governments and the hands of lawyers, and in the hands of bankruptcy trustees,” he added.

          Cryptocurrencies, Bitcoin Price, Michael Saylor

          Saylor said that many of these trustees do not have a “10-year investors mindset,” and as Bitcoin’s price began to rally, they took advantage and “thought this is a good exit point to get liquidity.”

          “So I think people less committed to the long term have taken the opportunity to exit the market and a whole new class of investors are entering by way of ETFs and by way of Bitcoin treasury companies.”

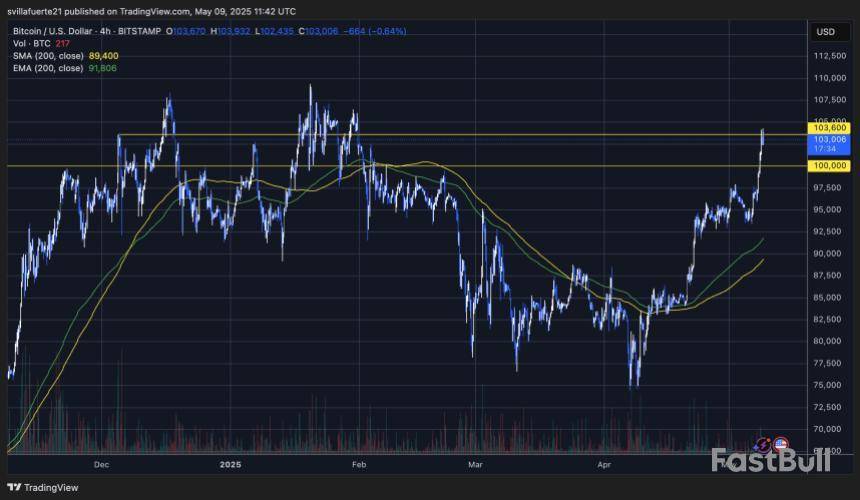
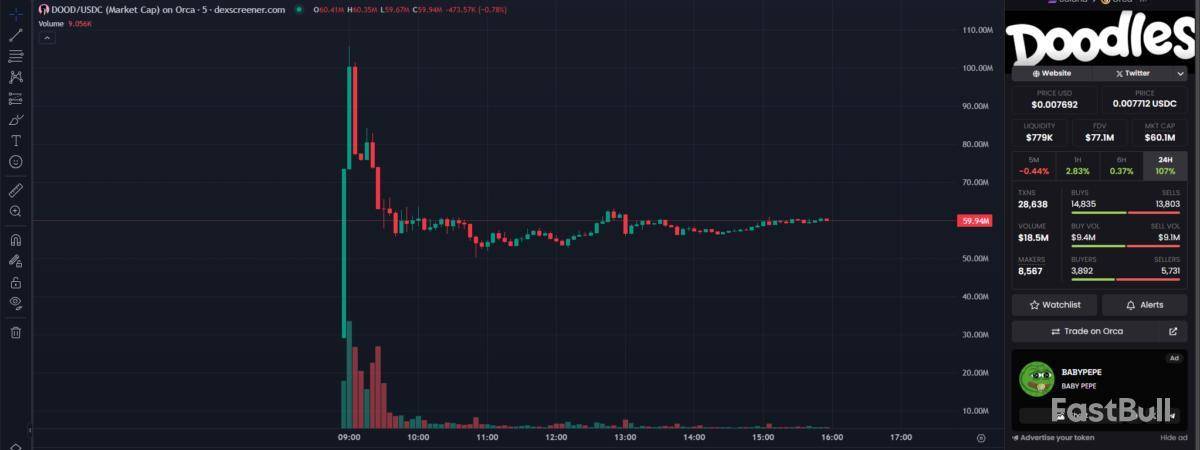
          After Bitcoin reached its all-time high of $109,000 on Jan. 20 just hours before US President Donald Trump’s presidential inauguration, it experienced a downtrend, falling as low as $76,273 on April 9, before starting to show signs of recovery.

          On May 8, Bitcoin reclaimed $100,000 for the first time since Feb. 1 after US President Donald Trump proposed tariffs. The recent price surge has pushed Strategy’s Bitcoin holdings to 50.27% above their average Bitcoin purchase price of $68,569. At the time of publication, the firm holds 555,450 Bitcoin, valued at approximately $57.23 billion, according to Saylor Tracker data.

          Saylor is surprised at US government sentiment shift

          Spot Bitcoin ETFs posted $564.7 in inflows over the past five trading days, according to Farside data.

          Meanwhile, Saylor said he’s not surprised the US government hasn’t yet bought Bitcoin for its Strategic Bitcoin Reserve which Trump signed an executive order for on March 7. The reserve is holding Bitcoin that was forfeited as part of criminal or civil asset forfeiture proceedings.

          However, Saylor didn’t anticipate their stance to change so quickly following Trump’s inauguration.

          “I was surprised that the US embraced Bitcoin as radically as it has over the last six months, I think I didn’t expect all the Cabinet members to be so enthusiastic,” he said.

          风险提示及免责条款
          市场有风险,投资需谨慎。本文内容仅供参考,不构成个人投资建议,也未考虑到某些用户特殊的投资目标、财务状况或其他需要。据此投资,责任自负。
          收藏
          分享

          Tech Expert Predicts $1 Million Bitcoin — ‘Only One More 10x Left’

          NewsBTC
          Jito Staked SOL/Tether
          -0.61%
          1inch/Tether
          -1.31%
          AAVE/Tether
          -1.66%
          Fusionist/Tether
          -1.28%

          Bitcoin was back in the news this week after surging past $104,000 before retracting a bit. The rally, which started around May 7, propelled the world’s largest cryptocurrency from $93,000 to as much as $104,000 by May 9.

          After retreating 4% in the following 24 hours, Bitcoin still maintained a weekly gain of around 6%. That short-term action is now driving larger predictions, including one that forecasts Bitcoin will increase another 10 times in value.

          Another 10x Jump ‘Inevitable,’ Expert Says

          Muneeb Ali, the brains behind the Bitcoin Layer 2 solution Starks, thinks the next giant leap is imminent. In his opinion, Bitcoin has already taken three distinct steps in its price trajectory: from $100 to $1,000, then to $10,000, and then to over $100,000.

          muneeb.btc
          @muneeb

          i’ve seen bitcoin go:

          – from $100 to $1,000. – from $1,000 to $10,000. – from $10,000 to $100,000.

          one more 10x to $1,000,000 is inevitable.

          May 08, 2025

          Ali pointed out how each move took more time but followed a familiar pattern. In 2013, Bitcoin climbed from $100 to $1,000 in four months. Four years later, in 2017, it reached $10,000. By December 2024, it had crossed the $100,000 mark. Based on that path, Ali said another 10x jump to $1 million isn’t just likely — it’s “inevitable”. However, he didn’t explain what would actually drive that kind of rise.

          New Projection Sees $116K Next Month

          The latest Bitcoin price forecast by CoinCodex has the price increasing by 13% and hitting $116,600 on June 8, 2025. Technical analysis indicates a positive trend, with 20 of the past 30 days (67%) closing in the positive. During the same timeframe, Bitcoin recorded 6.50% price volatility.

          The Fear & Greed Index is currently at 73, which is Greed. Though this prediction is not quite hinting at reaching $1 million yet, it validates the notion that there is still space for Bitcoin to rise in the near future.A US Government Buy-In Could Speed Things Up

          Zack Shapiro, a Bitcoin Policy Institute lawyer, also thinks that Bitcoin has a lot of potential — and quick. He studied a bill called the Bitcoin Act, which was reintroduced last March. The bill proposes the US government to purchase 1 million BTC within five years. That represents 5% of the total supply.

          If passed, the bill would fund the acquisition using profits from gold revaluation. Shapiro indicated that a plan like that would fuel demand so high it drives Bitcoin to $1 million earlier than anticipated. That’s provided that the bill gains momentum and secures the financing it requires.

          Featured image from Gemini Imagen, chart from TradingView

          风险提示及免责条款
          市场有风险,投资需谨慎。本文内容仅供参考,不构成个人投资建议,也未考虑到某些用户特殊的投资目标、财务状况或其他需要。据此投资,责任自负。
          收藏
          分享

          Bitcoin Whale Entry Prices Diverge Sharply – Confidence Builds At Higher Levels

          NewsBTC
          Jito Staked SOL/Tether
          -0.61%
          1inch/Tether
          -1.31%
          AAVE/Tether
          -1.66%
          Fusionist/Tether
          -1.28%

          Bitcoin has surged to $104,300, confirming the uptrend and reinforcing the bullish outlook that many analysts projected for 2025. This move places BTC deep into range-highs territory, with the next major challenge now clearly in sight: the all-time high at $109,000. The market’s strength comes on the back of strong technical performance and increasingly optimistic sentiment, as BTC continues to lead the crypto rally and altcoins follow suit.

          On-chain data from CryptoQuant adds further weight to the bullish narrative. One standout metric highlights the growing confidence among large holders: the absolute difference between the Realized Price of new whales and old whales now stands at $59.7K. Specifically, new whales have entered the market at an average price of $91.9K, while old whales’ basis remains at $32.2K. This translates to a 185% relative spread to the long-term holder (LTH) basis—a massive divergence.

          This wide gap signals that a new wave of high-conviction buyers is entering the market at significantly elevated prices. Unlike the cautious whale accumulation during previous cycle lows, this phase reflects strong belief in continued upside, even at premium levels. It’s a clear sign that institutional FOMO may be kicking in.

          Bitcoin Faces Resistance At $104K As Whale Activity Signals Growing FOMO

          Bitcoin is currently encountering resistance around the $104,000 mark—a level that may take time to break as it represents a critical barrier before entering price discovery above the all-time high near $109,000. The recent rally has shown remarkable strength, but as BTC consolidates just below its ATH, some selling pressure is expected. A successful breakout could lead to a swift surge beyond $109K; however, failure to do so may result in short-term consolidation or retracement.

          Top analyst Axel Adler shared key on-chain insights on X that highlight the evolving psychology of Bitcoin’s largest holders. According to Adler, the absolute difference between the Realized Price of new whales ($91.9K) and old whales ($32.2K) is $59.7K, representing a 185% relative spread to the long-term holder (LTH) basis. This sharp divergence reveals that new “whales” are entering the market at nearly three times the price of early entrants.

          Bitcoin Realized Price New Whales STH vs Old Whale LTH | Source: Axel Adler on X

          In comparison, the same spread in November 2022 was only 62%, indicating more cautious accumulation near the market bottom. The current surge to 185% reflects rising confidence and FOMO, with large buyers willing to accumulate even at elevated prices. For context, during the 2021 cycle peak at $63K, the spread widened to 437%.

          This trend suggests that the market is entering a more aggressive accumulation phase, where belief in higher prices is driving demand despite the premium. If bulls manage to absorb the resistance around $104K, it could mark the start of a parabolic move—fueled not just by momentum, but by conviction from both retail and institutional players betting on a new Bitcoin all-time high.

          BTC Price Analysis: Key Levels To Watch

          Bitcoin is trading around $103,000 after reaching a high of $104,300 earlier today. The 4-hour chart shows BTC facing resistance at the $103,600 level, which aligns with a key supply zone from late December 2024 and early January 2025. This area acted as a previous rejection point during the last major rally and is now being tested again as potential resistance.

          BTC testing critical supply | Source: BTCUSDT chart on TradingView

          BTC’s recent surge from the $87K–$90K consolidation zone has been aggressive, breaking above both the 200 EMA and 200 SMA (currently at $91,806 and $89,400, respectively) with strong volume. This confirms bullish strength and trend continuation, suggesting that buyers are still in control. However, the current range between $103K and $104K is historically significant, and bulls may need to absorb selling pressure before attempting a move toward the all-time high near $109K.

          If BTC consolidates above $100K and holds this level as new support, it would strengthen the case for continued upside. On the flip side, failure to break above $103,600 cleanly could lead to a short-term pullback. Market structure remains bullish overall, but this resistance zone will be critical in determining whether Bitcoin enters price discovery or pauses for accumulation.

          Featured image from Dall-E, chart from TradingView

          风险提示及免责条款
          市场有风险,投资需谨慎。本文内容仅供参考,不构成个人投资建议,也未考虑到某些用户特殊的投资目标、财务状况或其他需要。据此投资,责任自负。
          收藏
          分享

          Ethereum (ETH) at 31% Skyrocketing in Hours: What's Next? Shiba Inu (SHIB) Ready for $0.00002, Bitcoin (BTC): Don't Get Too Bullish for $100,000

          U.Today
          Jito Staked SOL/Tether
          -0.61%
          1inch/Tether
          -1.31%
          AAVE/Tether
          -1.66%
          Fusionist/Tether
          -1.28%

          Ethereum just blew through several resistance levels in a matter of hours, igniting the cryptocurrency market with a stunning 31% surge. The 200-day moving average, which frequently distinguishes between bullish momentum and bearish continuation, is just below the $2,300 mark, which the rally has propelled ETH above.

          According to the price action, as of right now, this may be the start of a significant structural reversal rather than merely a random spike. With robust volume supporting the move, Ethereum has technically broken through the 50 EMA, 100 EMA and even 150 EMA in a single sweep. Although RSI is currently just above 81, which would typically indicate caution as it is entering overbought territory. However, explosive moves such as these RSI extremes can last longer than usual.  Chart by TradingView">

          The enormous candle not only breaks the previous downward trend but also makes way for a move toward $2,600 and higher, with the psychological $3,000 zone as the potential next macro resistance level. When Ethereum showed this kind of rally behavior previously, it resulted in months of steady upward movement.

          In general, investor sentiment toward Ethereum is rapidly improving, particularly as institutional interest in the post-ETF narratives grows and ETH/BTC parity is given renewed attention. Ethereum is probably going to follow Bitcoin's lead as it gets closer to $100,000, taking advantage of positive market sentiment.

          In the short term, it would not be shocking to see a slight decline or consolidation around $2,300 to $2,400. Nonetheless, Ethereum would validate the breakout and change the overall trend to a bullish one if it closed several daily candles above the 200 EMA. For traders hoping to ride this wave, cautious accumulation and scaling into strength may be the best course of action.

          Shiba Inu revitalized

          Based on its most recent price action, Shiba Inu is displaying renewed strength on the charts with a potential breakout toward the $0.00002 level. The asset has effectively surpassed significant resistance levels, breaching the $0.000014 zone and advancing toward the 200-day exponential moving average (EMA), which is presently hovering around $0.000016. 

          Throughout its downward trajectory, this long-term EMA has served as a resolute ceiling for SHIB, and it will be difficult to break through. The recent increase in purchasing volume, however, suggests that the meme coin is gaining traction and interest. This most recent price move is consistent with increases in on-chain and market volume, suggesting that it is backed by market activity and not just a speculative bounce. 

          The move to $0.00002 is much more likely if SHIB can close a daily candle above the 200 EMA with sustained volume support. Given the historical price congestion and relative thinness in the $0.000016-$0.00002 zone, SHIB may move swiftly closer to its target if the 200 EMA breaks.

          Since momentum indicators like the RSI are still rising and have not yet entered extremely overbought territory, there is still opportunity for additional growth before a significant decline is anticipated. Although the psychological $0.000018 level has served as both support and resistance in the past, traders should continue to monitor possible resistance there.

          In other words, Shiba Inu is preparing for a significant run, but it is facing one of its most difficult technical obstacles. The price of $0.00002 is not only feasible but may arrive quickly if bulls can maintain pressure and break the 200 EMA. If this breakout is confirmed or another rejection is indicated, the next few trading sessions will be critical. 

          Bitcoin recovers

          Unquestionably, bulls enjoyed a significant psychological victory, with Bitcoin's recent breakout above $100,000, but do not celebrate just yet — this move could be a temporary overextension rather than the start of an unstoppable rally. On the price chart, Bitcoin taps out close to $104,000 after cleanly breaking through the $98,000 resistance.

          For Bitcoin, this pattern is not uncommon and frequently comes before consolidation or significant declines. This is a warning sign for volume. The volume should be increasing rather than decreasing for a move of this magnitude. The Relative Strength Index (RSI), which typically identifies local peaks at 75, is likewise well into overbought territory.

          Furthermore, the current range of important support zones is $98,000 to $95,000. A swift decline back to the $92,000 or even $90,000 region might occur if Bitcoin is unable to maintain above this range. Bulls must defend the 50 EMA, which is approximately $93,000. Long term, the route to $100,000+ is still open, but maintaining a strong rally will probably require more time consolidation and volume.

          风险提示及免责条款
          市场有风险,投资需谨慎。本文内容仅供参考,不构成个人投资建议,也未考虑到某些用户特殊的投资目标、财务状况或其他需要。据此投资,责任自负。
          收藏
          分享

          Dogecoin Price Continuation Shows Rebound, But Resistance Is Mounting At $0.205

          NewsBTC
          Jito Staked SOL/Tether
          -0.61%
          1inch/Tether
          -1.31%
          AAVE/Tether
          -1.66%
          Fusionist/Tether
          -1.28%

          The Dogecoin price appears to be on a continued rebound, with bulls regaining some control over the market after weeks of sideways trading and downward pressure. However, the momentum is being tested as strong resistance builds around the $0.205 level. A recent analysis highlights this crucial zone and outlines the roadmap for Dogecoin’s next move. 

          Dogecoin Price Recovery Faces Critical Resistance

          TradingView crypto analyst Lingrid recently shared a technical analysis featuring a classic continuation pattern unfolding for Dogecoin. The analyst revealed that the Dogecoin price is attempting a recovery after rebounding from a key ascending trendline and breaking out of a Falling Wedge pattern. 

          Following this, Dogecoin is now retesting the breakout level around $0.175, where both the wedge resistance and ascending trendline converge. The cryptocurrency has also formed a higher low structure on its price chart. Notably, this breakout zone is critical, as holding above it would confirm the breakout and set the stage for potential gains. 

          Lingrid has revealed that traders are currently watching closely for continuation toward the next resistance area. The $0.19 level has been set as the next immediate breakout target, aligning with the top of the previous range and the midpoint of the broader resistance area. 

          A push beyond $0.19 would open the door for a run toward the range between $0.2 – $0.21, a key resistance area where selling pressures could intensify. While Dogecoin’s structure remains relatively bullish with higher lows forming, Lingrid has also cautioned that overhead resistance near $0.19 and $0.2 could slow down the momentum. 

          Notably, Dogecoin’s trading volume will also play a key role in its price action and future moves. As the price approaches the wedge apex, fluctuations in volume could either sustain the strength of the rally or weaken it.

          DOGE To Decline Further If Support Fails

          Since the beginning of this year, the Dogecoin price has recorded its fair share of unexpected price declines and volatility. While Lingrid’s analysis shares encouraging signs of a potential price recovery and bull rally, Dogecoin’s breakout remains at risk.

          If its price fails to hold the critical support zone at $0.175, especially with a strong candle close below this level, the projected breakout could be invalidated. This would, in turn, potentially lead to a steeper price breakdown toward $0.15, representing a 25% decrease from its current market value of $0.2. 

          Lingrid also mentions that a failure to maintain buyer interest near the wedge apex and weakening volume could also contribute to market indecision, making a swift recovery less likely. As a result, traders are advised to watch the $0.175 zone closely as a key breakout point that will determine whether Dogecoin resumes its climb or faces renewed downward pressure.

          风险提示及免责条款
          市场有风险,投资需谨慎。本文内容仅供参考,不构成个人投资建议,也未考虑到某些用户特殊的投资目标、财务状况或其他需要。据此投资,责任自负。
          收藏
          分享

          $69,536,183 XRP Transfer Stuns Major U.S. Crypto Exchange

          U.Today
          Jito Staked SOL/Tether
          -0.61%
          1inch/Tether
          -1.31%
          AAVE/Tether
          -1.66%
          Fusionist/Tether
          -1.28%

          On May 9, blockchain monitoring firm Whale Alert identified a massive transfer of 29,532,534 XRP, worth $69,536,183, to leading U.S.-based crypto exchange Coinbase.

          This large transaction has raised eyebrows as it coincides with the ongoing bull market run, prompting investors to closely monitor on-chain activities.

          Whales already dumping?

          According to the data, the massive transfer was executed by an unknown wallet address in a single transaction, suggesting a possible sell-off attempt.

          Although the exact motive behind the transaction remains unclear, it has sparked concern within the XRP community, especially as it aligns with a period of bullish momentum for the token.

          Despite the transfer, XRP continues to exhibit strong bullish indicators. Over the past 24 hours, CoinMarketCap data shows that XRP has experienced a 3% daily surge, following an 8% gain the day prior. As of press time, XRP is trading at $2.35.

          CoinMarketCap">

          In addition to the price uptick, XRP has also recorded a 60.35% surge in trading volume, reflecting heightened activity among both retail and institutional traders.

          While large transfers to exchanges are often associated with intent to sell, this specific transfer has the XRP community questioning whether whales are starting to take profits after the recent bull run.

          What next for XRP?

          XRP’s current positive price trend has fueled investor optimism, with expectations that the token could reach the $3 mark soon. Longer-term, some believe XRP could hit a new all-time high (ATH) before the onset of the next bear cycle.

          However, if large holders begin to sell off holdings, this could stall XRP’s bullish trajectory. Whale profit-taking can lead to a spike in supply, outpacing demand and potentially driving prices down.

          Such actions might also trigger panic selling among smaller, less experienced investors, leading to further downward pressure on the token’s price.

          风险提示及免责条款
          市场有风险,投资需谨慎。本文内容仅供参考,不构成个人投资建议,也未考虑到某些用户特殊的投资目标、财务状况或其他需要。据此投资,责任自负。
          收藏
          分享

          Doodles NFT token stalls after airdrop

          Cointelegraph
          Jito Staked SOL/Tether
          -0.61%
          1inch/Tether
          -1.31%
          AAVE/Tether
          -1.66%
          Fusionist/Tether
          -1.28%

          The newly launched DOOD token from Ethereum-based NFT project Doodles has seen a steep drop in market capitalization following its May 9 airdrop on the Solana network.

          According to data from DEX Screener, DOOD’s market cap fell from over $100 million shortly after launch to around $60 million at the time of writing.

          Overall, the much-anticipated airdrop was “[d]efinitely underwhelming,” a crypto commentator said in a May 9 X post.

          Falling NFT values

          Joining the trend, NFTs in Doodle’s flagship collection sharply dropped in value on May 9.

          The collectibles are down roughly 60% to less than 1.5 Ether per NFT from about 3.5 ETH on May 8, according to OpenSea. As of May 9, the NFTs are collectively worth around $31 million, according to data from CoinGecko.

          NFT prices often dip immediately after an airdrop, as holders look to capitalize on their allocations by selling into the market. For instance, sales of Doodles’ NFTs surged by some 97% on May 8 in anticipation of the airdrop.

          Over the past week, Doodles clocked roughly $2.6 million in total sales volume, up more than 350% from the week prior, according to data from CryptoSlam.

          Doodles announced its token launch in February, outlining plans to mint 10 billion DOOD tokens on Solana and to eventually bridge them to Base, an Ethereum layer-2.

          Doodles is the latest Ethereum-native NFT brand to list a token on the Solana network. It follows Pudgy Penguins, an even larger NFT project that airdropped its PENGU token on Solana in December.

          Similarly to Doodles, Pudgy Penguin’s token dropped by around 50% on the day of its airdrop.

          The PENGU token’s market cap reached an all-time high of roughly $2.8 billion and has since traded down to roughly $900 million, according to CoinGecko.

          风险提示及免责条款
          市场有风险,投资需谨慎。本文内容仅供参考,不构成个人投资建议,也未考虑到某些用户特殊的投资目标、财务状况或其他需要。据此投资,责任自负。
          收藏
          分享
          FastBull
          Copyright © 2025 FastBull Ltd

          728 RM B 7/F GEE LOK IND BLDG NO 34 HUNG TO RD KWUN TONG KLN HONG KONG

          TelegramInstagramTwitterfacebooklinkedin
          App Store Google Play Google Play
          产品
          图表

          聊天

          专家问答
          筛选器
          财经日历
          数据
          工具
          会员
          功能特色
          功能
          行情
          跟单交易
          最新信号
          比赛
          新闻
          分析
          快讯
          专栏
          学习
          公司
          招聘
          关于我们
          联系我们
          广告合作
          帮助中心
          意见反馈
          用户协议
          隐私政策
          商业

          白标

          数据API

          网页插件

          海报制作

          代理计划

          风险披露

          交易股票、货币、商品、期货、债券、基金等金融工具或加密货币属高风险行为,这些风险包括损失您的部分或全部投资金额,所以交易并非适合所有投资者。

          做出任何财务决定时,应该进行自己的尽职调查,运用自己的判断力,并咨询合格的顾问。本网站的内容并非直接针对您,我们也未考虑您的财务状况或需求。本网站所含信息不一定是实时提供的,也不一定是准确的。本站提供的价格可能由做市商而非交易所提供。您做出的任何交易或其他财务决定均应完全由您负责,并且您不得依赖通过网站提供的任何信息。我们不对网站中的任何信息提供任何保证,并且对因使用网站中的任何信息而可能造成的任何交易损失不承担任何责任。

          未经本站书面许可,禁止使用、存储、复制、展现、修改、传播或分发本网站所含数据。提供本网站所含数据的供应商及交易所保留其所有知识产权。

          未登录

          登录查看更多功能

          FastBull会员

          未开通

          开通

          成为信号提供者
          帮助中心
          客服
          暗黑模式
          涨跌颜色

          登录

          注册

          停靠侧
          布局
          全屏
          默认进入图表
          访问 fastbull.com 时,默认进入图表页面