• Trade
  • Markets
  • Copy
  • Contests
  • 24/7
  • Calendar
  • Q&A
  • Chats
Screeners
SYMBOL
LAST
BID
ASK
HIGH
LOW
NET CHG.
%CHG.
SPREAD
SOURCE
SPX
S&P 500 Index
7720.39
7720.39
7720.39
7732.21
7690.94
-23.59
-0.30%
--
--
DJI
Dow Jones Industrial Average
52342.56
52342.56
52342.56
52405.88
52086.13
-132.54
-0.25%
--
--
IXIC
NASDAQ Composite Index
26184.71
26184.71
26184.71
26286.46
26053.16
-365.13
-1.38%
--
--
USDX
US Dollar Index
101.497
101.497
101.577
101.725
101.400
-0.206
-0.20%
--
--
EURUSD
Euro / US Dollar
1.11911
1.11911
1.11918
1.12144
1.11700
+0.00120
+ 0.11%
--
--
GBPUSD
Pound Sterling / US Dollar
1.34274
1.34274
1.34286
1.34334
1.33702
+0.00509
+ 0.38%
--
--
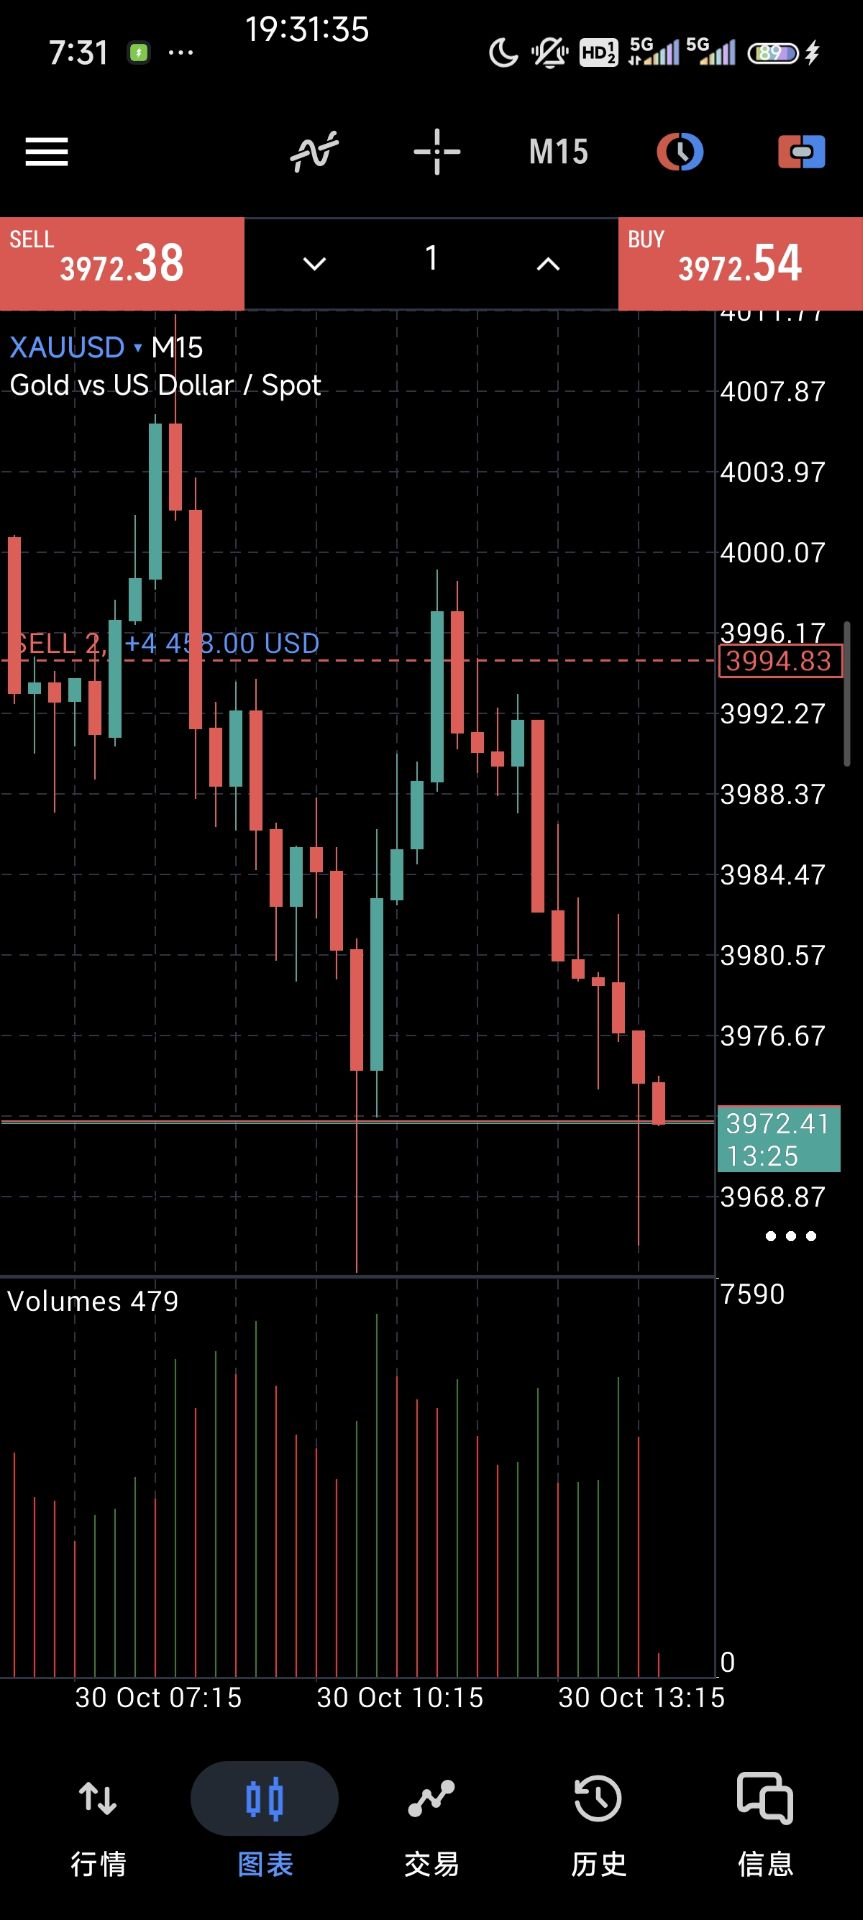
XAUUSD
Gold / US Dollar
3964.65
3964.65
3965.08
4026.26
3959.05
-56.30
-1.40%
--
--
WTI
Light Sweet Crude Oil
103.085
103.085
103.115
103.982
101.471
+1.112
+ 1.09%
--
--

Community Accounts

Signal Accounts
--
Profit Accounts
--
Loss Accounts
--
View More

Become a signal provider

Sell trading signals to earn additional income

View More

Guide to Copy Trading

Get started with ease and confidence

View More

Signal Accounts for Members

All Signal Accounts

Best Return
  • Best Return
  • Best P/L
  • Best MDD
Past 1W
  • Past 1W
  • Past 1M
  • Past 1Y

All Contests

  • All
  • Recommend
  • Stocks
  • Cryptocurrencies
  • Central Banks
  • Trump Updates
  • Featured News
Top News Only
Share

ExxonMobil CEO: The Current High Energy Prices Are Due To Insufficient Supply

Share

Xinhua Insurance Responded To Life Insurance Regulatory Indicators: All Four Indicators Have Been Met, And The Company Is Expected To Be At A Relatively Good Level In The Industry

Share

Spot Palladium Fell More Than 3.5% To $969.38 Per Ounce, Marking Its Ninth Consecutive Day Of Decline

Share

Spot Gold Fell Below $3,960 Per Ounce, Down 1.53% On The Day

Share

Oman Says 25 People Have Been Evacuated From The “RITI” Ship After The Attack

Share

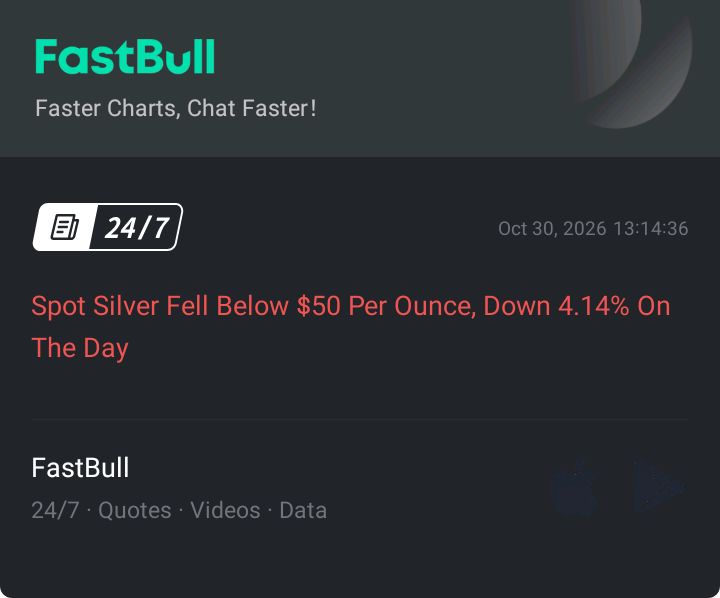
Spot Silver Fell Below $50 Per Ounce, Down 4.14% On The Day

Share

New York Gold Futures Fell Below $3,970 Per Ounce, Down 1.53% On The Day

Share

BP's Chief Financial Officer Said That We Have Seen Freight Rates Rise, Particularly In The Crude Oil Sector, While Product Tanker Freight Rates Have Remained Relatively Stable And LNG Carrier Freight Rates Have Recovered To Pre-conflict Levels

Share

Spot Silver Fell 4.00% Intraday, Approaching $50 Per Ounce, Hitting A New Low Since November 2025

Share

Russian Presidential Aide Ushakov: Without European Support, Kyiv Is Unlikely To Launch An Attack On Russian Oil Refineries

Share

India's Service Exports Reached $39.3 Billion And Imports Reached $20.1 Billion In September: Reserve Bank Of India

Share

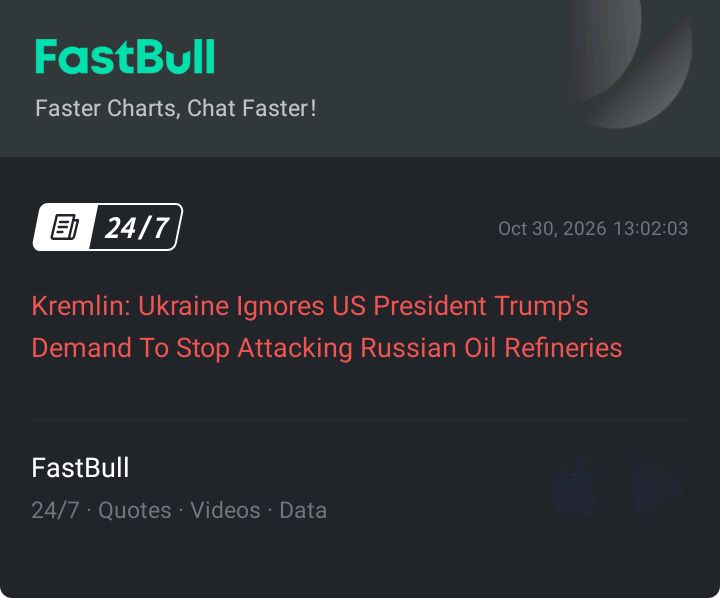
Kremlin: Ukraine Ignores US President Trump's Demand To Stop Attacking Russian Oil Refineries

Share

The Yield Spread Between French And German 10-year Government Bonds Widened By 8 Basis Points To 164 Basis Points

Share

Mexico's Preliminary GDP Figures For The Third Quarter Show A Year-on-Year Growth Of 3.2%; The Expected Growth Rate Is 3.0%

Share

Trump: The Democrats' Actions In The Alaska Senate Race Are "criminal."

Share

New York Silver Futures Fell 4% On The Day, Currently Trading At $50.28 Per Ounce

Share

Former Federal Reserve Vice Chairman Roger Ferguson Predicts That The Fed Will Raise Interest Rates In December, And May Raise Them One Or Two More Times In 2027

Share

Apple Shares Fell More Than 2% In Pre-market Trading

Share

NATO Says The Delivery Of Patriot Missiles To Ukraine Has Not Been Delayed

Share

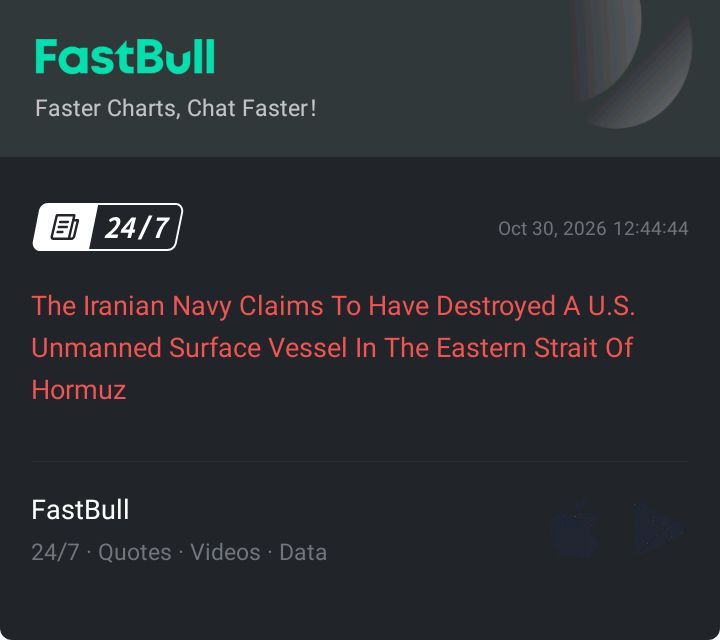
The Iranian Navy Claims To Have Destroyed A U.S. Unmanned Surface Vessel In The Eastern Strait Of Hormuz

TIME
ACT
FCST
PREV
IMPACT
Japan Retail Sales MoM (SA) (Sept)

A:--

F: --

P: --
USDJPY
  • USDJPY
  • XAUUSD
  • XAGUSD
  • WTI
  • USDX
Japan Retail Sales YoY (Sept)

A:--

F: --

P: --
USDJPY
  • USDJPY
  • XAUUSD
  • XAGUSD
  • WTI
  • USDX
Japan Industrial Output Prelim MoM (Sept)

A:--

F: --

P: --

USDJPY
  • USDJPY
  • XAUUSD
  • XAGUSD
  • WTI
Japan Industrial Output Prelim YoY (Sept)

A:--

F: --

P: --

USDJPY
  • USDJPY
  • XAUUSD
  • XAGUSD
  • WTI
Japan Industrial Inventory MoM (Sept)

A:--

F: --

P: --

USDJPY
  • USDJPY
  • XAUUSD
  • XAGUSD
  • WTI
  • USDX
Japan Retail Sales (Sept)

A:--

F: --

P: --

USDJPY
  • USDJPY
  • XAUUSD
  • XAGUSD
  • WTI
  • USDX
Australia PPI YoY (Q3)

A:--

F: --

P: --

AUDUSD
  • AUDUSD
  • XAUUSD
  • XAGUSD
  • WTI
Australia PPI QoQ (Q3)

A:--

F: --

P: --

AUDUSD
  • AUDUSD
  • XAUUSD
  • XAGUSD
  • WTI
BOJ Monetary Policy Statement
Japan Benchmark Interest Rate

A:--

F: --

P: --

USDJPY
  • USDJPY
  • XAUUSD
  • XAGUSD
  • WTI
  • USDX
Japan Construction Orders YoY (Sept)

A:--

F: --

P: --
USDJPY
  • USDJPY
  • XAUUSD
  • XAGUSD
  • WTI
  • USDX
Japan New Housing Starts YoY (Sept)

A:--

F: --

P: --

USDJPY
  • USDJPY
  • XAUUSD
  • XAGUSD
  • WTI
  • USDX
France GDP Prelim YoY (SA) (Q3)

A:--

F: --

P: --

BOJ Press Conference
Turkey Economic Sentiment Indicator (Oct)

A:--

F: --

P: --

XAUUSD
  • XAUUSD
  • XAGUSD
  • WTI
  • USDX
U.K. Nationwide House Price Index MoM (Oct)

A:--

F: --

P: --
GBPUSD
  • GBPUSD
  • XAUUSD
  • XAGUSD
  • WTI
  • USDX
U.K. Nationwide House Price Index YoY (Oct)

A:--

F: --

P: --

GBPUSD
  • GBPUSD
  • XAUUSD
  • XAGUSD
  • WTI
  • USDX
France PPI MoM (Sept)

A:--

F: --

P: --

EURUSD
  • EURUSD
  • XAUUSD
  • XAGUSD
  • WTI
  • USDX
Germany Unemployment Rate (SA) (Oct)

A:--

F: --

P: --

EURUSD
  • EURUSD
  • XAUUSD
  • XAGUSD
  • WTI
  • USDX
Germany GDP Prelim YoY (Working-day Adjusted) (Q3)

A:--

F: --

P: --

EURUSD
  • EURUSD
  • XAUUSD
  • XAGUSD
  • WTI
  • USDX
Germany GDP Prelim YoY (Not SA) (Q3)

A:--

F: --

P: --

EURUSD
  • EURUSD
  • XAUUSD
  • XAGUSD
  • WTI
  • USDX
Germany GDP Prelim QoQ (SA) (Q3)

A:--

F: --

P: --

EURUSD
  • EURUSD
  • XAUUSD
  • XAGUSD
  • WTI
  • USDX
Italy GDP Prelim YoY (SA) (Q3)

A:--

F: --

P: --

EURUSD
  • EURUSD
  • XAUUSD
  • XAGUSD
  • WTI
  • USDX
Euro Zone GDP Prelim QoQ (SA) (Q3)

A:--

F: --

P: --

EURUSD
  • EURUSD
  • XAUUSD
  • XAGUSD
  • WTI
  • USDX
Italy HICP Prelim YoY (Oct)

A:--

F: --

P: --

EURUSD
  • EURUSD
  • XAUUSD
  • XAGUSD
  • WTI
  • USDX
Euro Zone Unemployment Rate (Sept)

A:--

F: --

P: --
EURUSD
  • EURUSD
  • XAUUSD
  • XAGUSD
  • WTI
  • USDX
Euro Zone GDP Prelim YoY (SA) (Q3)

A:--

F: --

P: --

EURUSD
  • EURUSD
  • XAUUSD
  • XAGUSD
  • WTI
  • USDX
Italy Average Hourly Wage MoM (Sept)

A:--

F: --

P: --

EURUSD
  • EURUSD
  • XAUUSD
  • XAGUSD
  • WTI
  • USDX
Brazil Unemployment Rate (Sept)

A:--

F: --

P: --

XAUUSD
  • XAUUSD
  • XAGUSD
  • WTI
  • USDX
South Africa Trade Balance (Sept)

A:--

F: --

P: --

XAUUSD
  • XAUUSD
  • XAGUSD
  • WTI
  • USDX
U.S. Labor Cost Index QoQ (Q3)

--

F: --

P: --

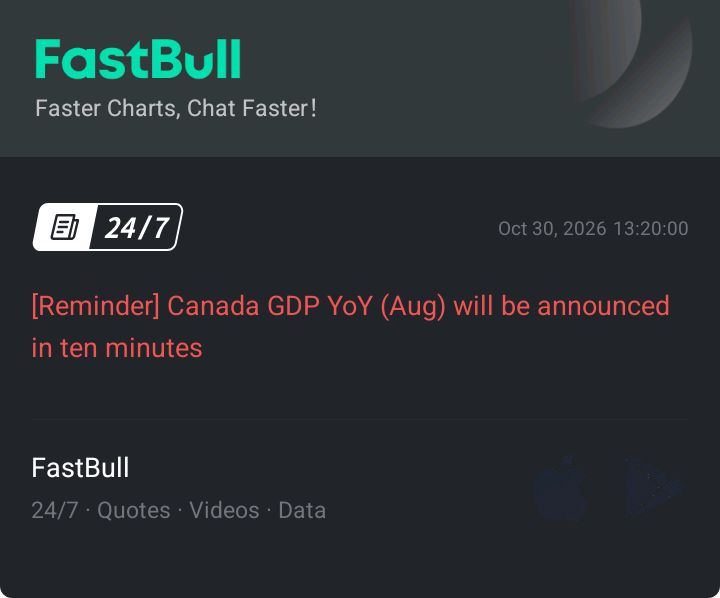
Canada GDP YoY (Aug)

--

F: --

P: --

Canada GDP MoM (SA) (Aug)

--

F: --

P: --

Germany HICP Prelim MoM (Oct)

--

F: --

P: --

Germany HICP Prelim YoY (Oct)

--

F: --

P: --

Germany CPI Final MoM (Oct)

--

F: --

P: --

Germany GDP Final QoQ (SA) (Oct)

--

F: --

P: --

U.S. Chicago PMI (Oct)

--

F: --

P: --

Canada Federal Government Budget Balance (Aug)

--

F: --

P: --

U.S. Weekly Total Rig Count

--

F: --

P: --

U.S. Weekly Total Oil Rig Count

--

F: --

P: --

China, Mainland NBS Non-manufacturing PMI (Oct)

--

F: --

P: --

China, Mainland NBS Manufacturing PMI (Oct)

--

F: --

P: --

China, Mainland Composite PMI (Oct)

--

F: --

P: --

South Korea Trade Balance Prelim (Oct)

--

F: --

P: --
Indonesia IHS Markit Manufacturing PMI (Oct)

--

F: --

P: --

South Korea IHS Markit Manufacturing PMI (SA) (Oct)

--

F: --

P: --

China, Mainland Caixin Manufacturing PMI (SA) (Oct)

--

F: --

P: --

Indonesia Inflation Rate YoY (Oct)

--

F: --

P: --

Indonesia Trade Balance (Sept)

--

F: --

P: --

Indonesia Core Inflation YoY (Oct)

--

F: --

P: --

India HSBC Manufacturing PMI Final (Oct)

--

F: --

P: --

Australia Commodity Price YoY (Oct)

--

F: --

P: --

Russia IHS Markit Manufacturing PMI (Oct)

--

F: --

P: --

Turkey Manufacturing PMI (Oct)

--

F: --

P: --

Italy Manufacturing PMI (SA) (Oct)

--

F: --

P: --

South Africa Manufacturing PMI (Oct)

--

F: --

P: --

Euro Zone Manufacturing PMI Final (Oct)

--

F: --

P: --

U.K. Manufacturing PMI Prelim (Oct)

--

F: --

P: --

Canada National Economic Confidence Index

--

F: --

P: --

Q&A with Experts
    • All
    • Chatrooms
    • Groups
    • Friends
    Skylark flag
    fulltimetrader
    @fulltimetraderis this that same account or its another different account from that one
    EuroTrader flag
    fulltimetrader
    @fulltimetraderWow this is a nice catch mate, congratulations friend
    SHIZEN flag
    @EuroTraderGood afternoon sir
    EuroTrader flag
    SHIZEN
    @EuroTraderGood afternoon sir
    @SHIZENGood day mate, welcome to the room, how's your day going?
    Skylark flag
    fulltimetrader
    @fulltimetraderyou've got a good one there Do remember to leave us some cash too don't take it all
    SHIZEN flag
    EuroTrader
    @SHIZENGood day mate, welcome to the room, how's your day going?
    @EuroTraderits going well sir and you?
    Skylark flag
    Skylark flag
    EuroTrader flag
    SHIZEN
    @EuroTraderits going well sir and you?
    @SHIZENI'm doing okay mate, thanks for asking, what are you up to today?
    Skylark flag
    Skylark flag
    Skylark flag
    Size flag
    Sanjeev Ku
    check the low below 4019. haha. who says indicator dont work. ofcourse third grade indicators dont work haha.low exact till now 3959.20
    @Sanjeev KuHaha, looks like your indicators did their job on this one
    SHIZEN flag
    EuroTrader
    @SHIZENI'm doing okay mate, thanks for asking, what are you up to today?
    @EuroTraderJuts came back from a break, what's popping?
    Skylark flag
    Size flag
    Which indicators are you combining to get that kind of confirmation? @Sanjeev Ku
    EuroTrader flag
    SHIZEN
    @EuroTraderJuts came back from a break, what's popping?
    @SHIZENNothing much mate, just scouting the market for a better opportunity
    Size flag
    Sanjeev Ku flag
    Size
    @Sanjeev KuHaha, looks like your indicators did their job on this one
    @Size bro its me who sometimes stray. my indicators does its job every day. yesterday also told to sell below 4969 tgt 4009 but i started acting smart
    Sanjeev Ku flag
    Sanjeev Ku
    @Size bro its me who sometimes stray. my indicators does its job every day. yesterday also told to sell below 4969 tgt 4009 but i started acting smart
    4069
    Type here...
    Add Symbol or Code

      No matching data

      All
      Recommend
      Stocks
      Cryptocurrencies
      Central Banks
      Trump Updates
      Featured News
      • All
      • Russia-Ukraine Conflict
      • Middle East Flashpoint
      • All
      • Russia-Ukraine Conflict
      • Middle East Flashpoint
      Search
      Products

      Charts Free Forever

      Chats Q&A with Experts
      Screeners Economic Calendar Data Tools
      Membership Features
      Data Warehouse Market Trends Institutional Data Policy Rates Macro

      Market Trends

      Market Sentiment Order Book Forex Correlations

      Top Indicators

      Charts Free Forever
      Markets

      News

      24/7 Analysis Education

      Latest Views

      Latest Update

      Signals

      Copy Rankings Latest Signals Become a signal provider AI Rating
      Contests
      Brokers

      Overview Brokers Assessment Rankings Regulators News Claims
      Broker listing Forex Brokers Comparison Tool Live Spread Comparison Scam
      Q&A Complaint Scam Alert Videos Tips to Detect Scam
      More

      Business
      Events
      Careers About Us Advertising Help Center

      White Label

      Broker API

      Data API

      Web Plug-ins

      Affiliate Program

      Awards Institution Evaluation IB Seminar Salon Event Exhibition
      Vietnam Thailand Singapore Dubai
      Fans Party Investment Sharing Session
      FastBull Summit BrokersView Expo
      Recent Searches
        Top Searches
          Markets
          Analysis
          User
          24/7
          Economic Calendar
          Education
          Data
          • Names
          • Latest
          • Prev

          View All

          No data

          Scan to Download

          Faster Charts, Chat Faster!

          Download
          English
          • English
          • Español
          • العربية
          • Bahasa Indonesia
          • Bahasa Melayu
          • Tiếng Việt
          • ภาษาไทย
          • Français
          • Italiano
          • Türkçe
          • Русский язык
          • 简中
          • 繁中
          Open Account
          Search
          Products
          Charts Free Forever
          Markets
          News
          Signals

          Copy Rankings Latest Signals Become a signal provider AI Rating
          Contests
          Brokers

          Overview Brokers Assessment Rankings Regulators News Claims
          Broker listing Forex Brokers Comparison Tool Live Spread Comparison Scam
          Q&A Complaint Scam Alert Videos Tips to Detect Scam
          More

          Business
          Events
          Careers About Us Advertising Help Center

          White Label

          Broker API

          Data API

          Web Plug-ins

          Affiliate Program

          Awards Institution Evaluation IB Seminar Salon Event Exhibition
          Vietnam Thailand Singapore Dubai
          Fans Party Investment Sharing Session
          FastBull Summit BrokersView Expo

          Italy Manufacturing PMI (SA) (Oct)

          Add Alert
          Alert added

          Act:--

          Fcst:--

          Prev:--

          Release Time:

          Release Schedule:Monthly

          Data Source:IHS Markit

          Data Interpretation: Purchasing Managers' Index (PMI) is an index compiled through monthly surveys of purchasing managers, which can reflect economic trends; Manufacturing PMI reflects the activity level of the country's manufacturing purchasing managers, provides operational information covering the entire manufacturing industry, and is also regarded as a leading indicator of business activity and inflation. Actual Data>Forecast Data, Bullish for EUR; Actual Data<Forecast Data, Bearish for EUR.
          1 Year 2 Years 5 Years All
          RELEASE TIME ACT PREV FCST

          No data

          Impact

            4 Hours After Event
            • 4 Hours After Event
            • 1 Hour After Event
            • 30 Minutes After Event
            • 15 Minutes After Event
            • 5 Minutes After Event
            Actual < Forecast
            Probability of Rise: --
            Number of Rises: --
            Probability of Fall: --
            Number of Falls: --
            Avg. Volatility: --
            Actual = Forecast
            Probability of Rise: --
            Number of Rises: --
            Probability of Fall: --
            Number of Falls: --
            Avg. Volatility: --
            Actual > Forecast
            Probability of Rise: --
            Number of Rises: --
            Probability of Fall: --
            Number of Falls: --
            Avg. Volatility: --
            Price Chart

            No data

            Impact 4 Hours After Event

            No data

            Relevant Indicators

            No data

            Create Alert
            Create
            FastBull
            Copyright © 2026 FastBull Ltd

            728 RM B 7/F GEE LOK IND BLDG NO 34 HUNG TO RD KWUN TONG KLN HONG KONG

            TelegramInstagramTwitterfacebooklinkedin
            App Store Google Play Android Windows
            Products
            Charts

            Chats

            Q&A with Experts
            Screeners
            Economic Calendar
            Data
            Tools
            Membership
            Features
            Function
            Markets
            Copy Trading
            Latest Signals
            Contests
            24/7
            Analysis
            Education
            Company
            Careers
            About Us
            Contact Us
            Advertising
            Download FastBull
            Help Center
            Feedback
            User Agreement
            Privacy Policy
            Personal Information Protection Statement
            Business

            White Label

            Broker API

            Data API

            Web Plug-ins

            Poster Maker

            Affiliate Program

            Risk Disclosure

            The risk of loss in trading financial instruments such as stocks, FX, commodities, futures, bonds, ETFs and crypto can be substantial. You may sustain a total loss of the funds that you deposit with your broker. Therefore, you should carefully consider whether such trading is suitable for you in light of your circumstances and financial resources.

            No decision to invest should be made without thoroughly conducting due diligence by yourself or consulting with your financial advisors. Our web content might not suit you since we don't know your financial conditions and investment needs. Our financial information might have latency or contain inaccuracy, so you should be fully responsible for any of your trading and investment decisions. The company will not be responsible for your capital loss.

            Without getting permission from the website, you are not allowed to copy the website's graphics, texts, or trademarks. Intellectual property rights in the content or data incorporated into this website belong to its providers and exchange merchants.

            Not Logged In

            Log in to access more features

            Connect Broker
            Become a signal provider
            Help Center
            Customer Service
            Dark Mode
            Price Up/Down Colors

            Log In

            Sign Up

            Position
            Layout
            Fullscreen
            Default to Chart
            The chart page opens by default when you visit fastbull.com