• Trade
  • Markets
  • Copy
  • Contests
  • 24/7
  • Calendar
  • Q&A
  • Chats
Screeners
SYMBOL
LAST
BID
ASK
HIGH
LOW
NET CHG.
%CHG.
SPREAD
SOURCE
SPX
S&P 500 Index
7520.93
7520.93
7520.93
7543.92
7470.43
-29.01
-0.38%
--
--
DJI
Dow Jones Industrial Average
52231.89
52231.89
52231.89
52316.89
51977.08
-157.86
-0.30%
--
--
IXIC
NASDAQ Composite Index
25065.86
25065.86
25065.86
25286.83
24816.10
-187.26
-0.74%
--
--
USDX
US Dollar Index
102.535
102.535
102.615
102.563
102.073
+0.415
+ 0.41%
--
--
EURUSD
Euro / US Dollar
1.11177
1.11177
1.11187
1.11697
1.11142
-0.00459
-0.41%
--
--
GBPUSD
Pound Sterling / US Dollar
1.32977
1.32977
1.32989
1.33552
1.32955
-0.00454
-0.34%
--
--
XAUUSD
Gold / US Dollar
4036.52
4036.52
4036.86
4066.84
4026.43
+4.25
+ 0.11%
--
--
WTI
Light Sweet Crude Oil
86.142
86.142
86.172
86.391
84.820
+0.702
+ 0.82%
--
--

Community Accounts

Signal Accounts
--
Profit Accounts
--
Loss Accounts
--
View More

Become a signal provider

Sell trading signals to earn additional income

View More

Guide to Copy Trading

Get started with ease and confidence

View More

Signal Accounts for Members

All Signal Accounts

Best Return
  • Best Return
  • Best P/L
  • Best MDD
Past 1W
  • Past 1W
  • Past 1M
  • Past 1Y

All Contests

  • All
  • Recommend
  • Stocks
  • Cryptocurrencies
  • Central Banks
  • Trump Updates
  • Featured News
Top News Only
Share

According To Iranian Sources, Iranian President Masoud Pezechzian And Armenian Prime Minister Nikol Pashinyan Met In Turkey During The 31st United Nations Climate Change Conference (COP31) To Discuss The Prospects For Bilateral Relations And The Situation In The Caucasus Region

Share

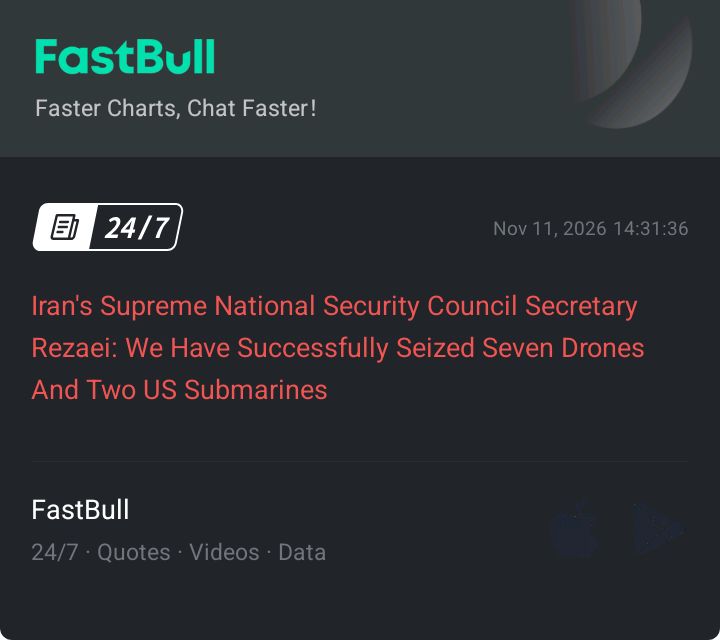
Iran's Supreme National Security Council Secretary Rezaei: We Have Successfully Seized Seven Drones And Two US Submarines

Share

German Economic Advisors Predict Inflation Of 2.8% In Germany In 2026 And 3.3% In 2027. They Also Forecast Economic Growth Of 1.3% In 2026 And 1% In 2027. The Advisors Warn That Defense Borrowing Will Create Fiscal Pressure

Share

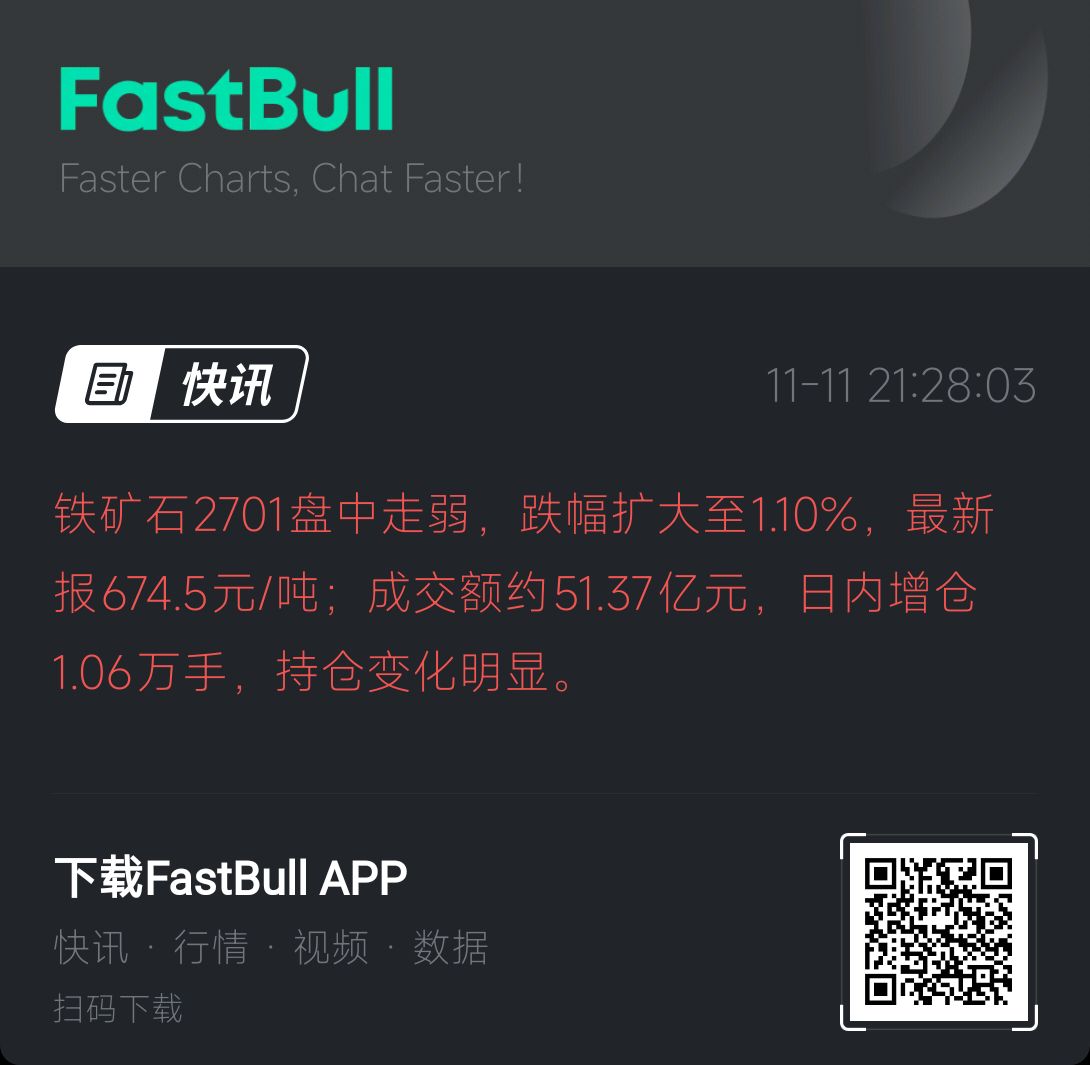
Iron Ore Futures Contract 2701 Weakened During The Session, With The Decline Widening To 1.10%, And Last Quoted At 674.5 Yuan/ton; The Trading Volume Was Approximately 5.137 Billion Yuan, With An Increase Of 10,600 Lots In Open Interest During The Day, Indicating A Significant Change In Open Interest

Share

Ecuadorian President Noboa Stated That Ecuador Maintains Bipartisan Engagement With Members Of The U.S. Congress

Share

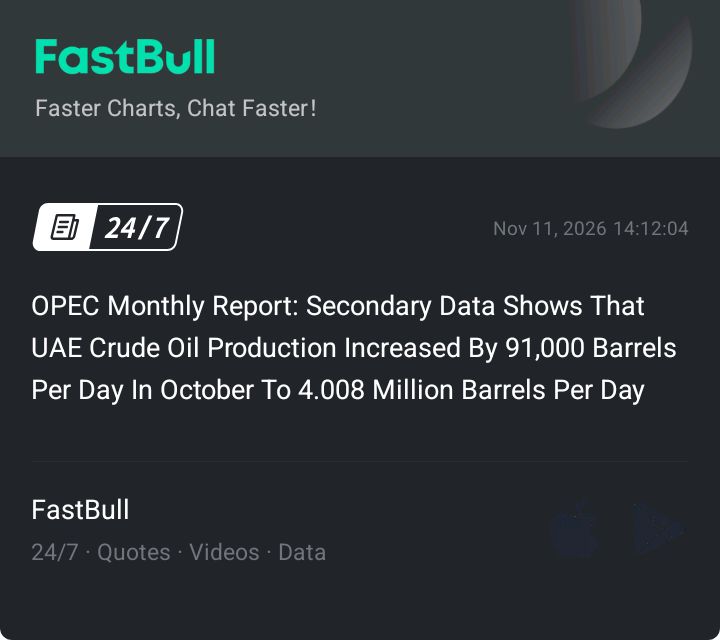
OPEC Monthly Report: Secondary Data Shows That UAE Crude Oil Production Increased By 91,000 Barrels Per Day In October To 4.008 Million Barrels Per Day

Share

OPEC Monthly Report: Secondary Data Shows That Iranian Crude Oil Production Fell By 44,000 Barrels Per Day In October To 1.914 Million Barrels Per Day

Share

OPEC Monthly Report: Secondary Data Shows That Kuwaiti Crude Oil Production Increased By 232,000 Barrels Per Day In October To 1.998 Million Barrels Per Day

Share

OPEC Monthly Report: Secondary Data Shows That Iraqi Crude Oil Production Increased By 496,000 Barrels Per Day In October To 4.491 Million Barrels Per Day

Share

A German Government Spokesperson Commented On Future Negotiations In Ukraine: If NATO Member States Cannot Reach A Consensus, Then The Agreements Cannot Be Implemented

Share

OPEC Monthly Report: Secondary Data Shows That Saudi Arabia's Crude Oil Production Increased By 1.182 Million Barrels Per Day In October, To 9.194 Million Barrels Per Day

Share

OPEC Monthly Report: Secondary Data Shows That Algeria's Crude Oil Production Decreased By 2,000 Barrels Per Day In October To 1,002,000 Barrels Per Day

Share

OPEC Monthly Report: Maintains Its 2027 Non-OPEC+ Oil Supply Growth Forecast Unchanged, Expecting An Increase Of 620,000 Barrels Per Day

Share

OPEC Monthly Report: Maintains Its 2026 Non-OPEC+ Oil Supply Growth Forecast Unchanged, Expecting An Increase Of 640,000 Barrels Per Day

Share

OPEC Monthly Report: OPEC+ (including The UAE, Which Has Withdrawn From The Organization) Averaged 41.23 Million Barrels Per Day In Crude Oil Production In October, An Increase Of 2.04 Million Barrels Per Day Compared To September

Share

OPEC Monthly Report: Saudi Arabia Reported That Its Crude Oil Production In October Was 10.563 Million Barrels Per Day, Up From 8.372 Million Barrels Per Day In September

Share

OPEC Monthly Report: OPEC Maintains Its Forecasts For Global Oil Demand Growth In 2026 And 2027

Share

The Most Active Methanol Futures Contract Rose 2% Intraday, Currently Trading At 3177.00 Yuan

Share

Most Domestic Commodity Futures Opened Higher In The Night Session, With Fuel Oil Up 3.32%, Propylene Up 2.33%, Crude Oil Up 2.29%, Ethylene Glycol Up 2.28%, Liquefied Petroleum Gas Up 2.17%, And Shanghai Gold Down 0.13%

Share

Russia's Imports In September Totaled $30.531 Billion

TIME
ACT
FCST
PREV
IMPACT
China, Mainland M1 Money Supply YoY (Oct)

--

F: --

P: --

China, Mainland Social Financing Scale (Oct)

--

F: --

P: --

China, Mainland M2 Money Supply YoY (Oct)

--

F: --

P: --

China, Mainland M0 Money Supply YoY (Oct)

--

F: --

P: --

ECB Chief Economist Lane Speaks
U.S. EIA Short-Term Crude Production Forecast For The Year (Nov)

A:--

F: --

P: --

WTI
  • WTI
  • XAUUSD
  • XAGUSD
  • USDX
U.S. EIA Natural Gas Production Forecast For The Next Year (Nov)

A:--

F: --

P: --

WTI
  • WTI
  • XAUUSD
  • XAGUSD
  • USDX
U.S. EIA Short-Term Crude Production Forecast For The Next Year (Nov)

A:--

F: --

P: --

WTI
  • WTI
  • XAUUSD
  • XAGUSD
  • USDX
EIA Monthly Short-Term Energy Outlook
U.S. 10-Year Note Auction Avg. Yield

A:--

F: --

P: --

XAUUSD
  • XAUUSD
  • XAGUSD
  • WTI
  • USDX
U.S. Cleveland Fed CPI MoM (Oct)

A:--

F: --

P: --

USDX
  • USDX
  • XAUUSD
  • XAGUSD
  • WTI
U.S. API Weekly Refined Oil Stocks

A:--

F: --

P: --

WTI
  • WTI
  • XAUUSD
  • XAGUSD
  • USDX
U.S. API Weekly Cushing Crude Oil Stocks

A:--

F: --

P: --

WTI
  • WTI
  • XAUUSD
  • XAGUSD
  • USDX
U.S. API Weekly Gasoline Stocks

A:--

F: --

P: --

WTI
  • WTI
  • XAUUSD
  • XAGUSD
  • USDX
U.S. API Weekly Crude Oil Stocks

A:--

F: --

P: --

WTI
  • WTI
  • XAUUSD
  • XAGUSD
  • USDX
Japan Reuters Tankan Manufacturers Index (Nov)

A:--

F: --

P: --

USDJPY
  • USDJPY
  • XAUUSD
  • XAGUSD
  • WTI
Japan Reuters Tankan Non-Manufacturers Index (Nov)

A:--

F: --

P: --

USDJPY
  • USDJPY
  • XAUUSD
  • XAGUSD
  • WTI
South Korea Unemployment Rate (SA) (Oct)

A:--

F: --

P: --

XAUUSD
  • XAUUSD
  • XAGUSD
  • WTI
Philadelphia Fed President Henry Paulson delivers a speech
Australia House Loan Permits MoM (SA) (Q3)

A:--

F: --

P: --

AUDUSD
  • AUDUSD
  • XAUUSD
  • XAGUSD
  • WTI
Turkey Retail Sales YoY (Sept)

A:--

F: --

P: --

XAUUSD
  • XAUUSD
  • XAGUSD
  • WTI
  • USDX
Germany GDP Prelim QoQ (SA) (Oct)

A:--

F: --

P: --

EURUSD
  • EURUSD
  • XAUUSD
  • XAGUSD
  • WTI
  • USDX
Germany GDP Prelim YoY (Working-day Adjusted) (Oct)

A:--

F: --

P: --

EURUSD
  • EURUSD
  • XAUUSD
  • XAGUSD
  • WTI
  • USDX
Germany HICP Final MoM (Oct)

A:--

F: --

P: --

EURUSD
  • EURUSD
  • XAUUSD
  • XAGUSD
  • WTI
  • USDX
Germany HICP Final YoY (Oct)

A:--

F: --

P: --

EURUSD
  • EURUSD
  • XAUUSD
  • XAGUSD
  • WTI
  • USDX
Italy Industrial Output YoY (SA) (Sept)

A:--

F: --

P: --
EURUSD
  • EURUSD
  • XAUUSD
  • XAGUSD
  • WTI
  • USDX
Italy 12-Month BOT Auction Avg. Yield

A:--

F: --

P: --

EURUSD
  • EURUSD
  • XAUUSD
  • XAGUSD
  • WTI
  • USDX
U.S. MBA Mortgage Application Activity Index WoW

A:--

F: --

P: --

USDX
  • USDX
  • XAUUSD
  • XAGUSD
  • WTI
Brazil Services Growth YoY (Sept)

A:--

F: --

P: --

XAUUSD
  • XAUUSD
  • XAGUSD
  • WTI
  • USDX
Mexico Industrial Output YoY (Sept)

A:--

F: --

P: --

XAUUSD
  • XAUUSD
  • XAGUSD
  • WTI
  • USDX
Russia Trade Balance (Sept)

A:--

F: --

P: --

WTI
  • WTI
  • XAUUSD
  • XAGUSD
  • USDX
U.S. Refinitiv/Ipsos Primary Consumer Sentiment Index (PCSI) (Nov)

--

F: --

P: --

Japan PPI MoM (Oct)

--

F: --

P: --

Japan Domestic Enterprise Commodity Price Index YoY (Oct)

--

F: --

P: --

Japan Domestic Enterprise Commodity Price Index MoM (Oct)

--

F: --

P: --

Australia Consumer Inflation Expectations (Nov)

--

F: --

P: --

U.K. 3-Month RICS House Price Balance (Oct)

--

F: --

P: --

U.K. Services Index YoY (Sept)

--

F: --

P: --

U.K. Trade Balance (Sept)

--

F: --

P: --

U.K. Construction Output MoM (SA) (Sept)

--

F: --

P: --

U.K. Services Index MoM (Sept)

--

F: --

P: --

U.K. GDP YoY (SA) (Sept)

--

F: --

P: --

U.K. Trade Balance (SA) (Sept)

--

F: --

P: --

U.K. Trade Balance EU (SA) (Sept)

--

F: --

P: --

U.K. Industrial Output YoY (Sept)

--

F: --

P: --

U.K. Trade Balance Non-EU (SA) (Sept)

--

F: --

P: --

U.K. Construction Output YoY (Sept)

--

F: --

P: --

U.K. Manufacturing Output YoY (Sept)

--

F: --

P: --

U.K. Monthly GDP 3M/3M Change (Sept)

--

F: --

P: --

U.K. GDP MoM (Sept)

--

F: --

P: --

U.K. Manufacturing Output MoM (Sept)

--

F: --

P: --

U.K. Industrial Output MoM (Sept)

--

F: --

P: --

South Africa Mining Output YoY (Sept)

--

F: --

P: --

South Africa Gold Production YoY (Sept)

--

F: --

P: --

India CPI YoY (Oct)

--

F: --

P: --

Germany Current Account (Not SA) (Sept)

--

F: --

P: --

U.K. Refinitiv/Ipsos Primary Consumer Sentiment Index (PCSI) (Nov)

--

F: --

P: --

Brazil CPI YoY (Oct)

--

F: --

P: --

U.S. Weekly Initial Jobless Claims (SA)

--

F: --

P: --

U.S. Initial Jobless Claims 4-Week Avg. (SA)

--

F: --

P: --

Canada Building Permits MoM (SA) (Sept)

--

F: --

P: --

Q&A with Experts
    • All
    • Chatrooms
    • Groups
    • Friends
    Skylark flag
    Oscar
    @Skylarkmy target is 1 ratio 3
    @Oscarokay that's a good one mate. that's a agood RRR.
    Skylark flag
    l$0N
    family
    @l$0NHello mate, how are you doing today? And welcome back. How is it going with you and what are you currently trading?
    Osaghae Cephas flag
    FastBuller
    @Sanjeev Ku Stop provoking members and disrupting the room. Keep it respectful and focused on trading, or you'll be muted.
    @Skylarkmy bro fear @Sanjeev Kuhe no dey even respect@FastBuller😹😅
    Skylark flag
    Skylark flag
    Skylark
    @Osaghae CephasCheck this out mate, that's some fast moves in numbers. Crude oil is getting some attention at the moment.
    Skylark flag
    Osaghae Cephas
    @Skylarkmy bro fear @Sanjeev Kuhe no dey even respect@FastBuller😹😅
    @Osaghae Cephas Yeah, I can see that. But I don't think he did anything wrong because he wasn't actually talking to anyone or speaking to anyone directly.
    Oscar flag
    how far buyers
    Skylark flag
    Oscar
    how far buyers
    @OscarHello seller. How is your short going? It seems it's going fine right cause I can see that its going fine.
    Oscar flag
    Skylark
    @OscarHello seller. How is your short going? It seems it's going fine right cause I can see that its going fine.
    @Skylarkof course brother
    Skylark flag
    Gold / US Dollar (XAUUSD)
    4038.6(+0.16% +6.33)
    Markets
    Oscar flag
    Skylark flag
    Skylark
    [Markets] Gold / US Dollar (XAUUSD)
    @OscarFrom this chart on gold, I can definitely see that your positioned is moving pretty fine and you are having a great time with your position.
    Soon jing flag
    Skylark flag
    Oscar
    @Skylarkof course brother
    @Oscar That's a good one, mate. You know, it always feels good to be making some profit. You know, it has this feeling that you don't want it to end.
    Skylark flag
    Oscar
    @OscarI See, just like I said, it's actually moving pretty well.
    Oscar flag
    Skylark
    @OscarFrom this chart on gold, I can definitely see that your positioned is moving pretty fine and you are having a great time with your position.
    @Skylarkyou could have take the trade with me
    Osaghae Cephas flag
    FastBuller
    @Sanjeev Ku Stop provoking members and disrupting the room. Keep it respectful and focused on trading, or you'll be muted.
    @SkylarkI know right that's y I said f**k@FastBuller😌
    Skylark flag
    Skylark flag
    Skylark
    @Osaghae CephasCheck this out mate. What do you think about this?
    Skylark flag
    Oscar
    @Skylarkyou could have take the trade with me
    @OscarOh, about that. I currently took some short on gold at the moment and it's also running.
    Type here...
    Add Symbol or Code

      No matching data

      All
      Recommend
      Stocks
      Cryptocurrencies
      Central Banks
      Trump Updates
      Featured News
      • All
      • Russia-Ukraine Conflict
      • Middle East Flashpoint
      • All
      • Russia-Ukraine Conflict
      • Middle East Flashpoint
      Search
      Products

      Charts Free Forever

      Chats Q&A with Experts
      Screeners Economic Calendar Data Tools
      Membership Features
      Data Warehouse Market Trends Institutional Data Policy Rates Macro

      Market Trends

      Market Sentiment Order Book Forex Correlations

      Top Indicators

      Charts Free Forever
      Markets

      News

      24/7 Analysis Education

      Latest Views

      Latest Update

      Signals

      Copy Rankings Latest Signals Become a signal provider AI Rating
      Contests
      Brokers

      Overview Brokers Assessment Rankings Regulators News Claims
      Broker listing Forex Brokers Comparison Tool Live Spread Comparison Scam
      Q&A Complaint Scam Alert Videos Tips to Detect Scam
      More

      Business
      Events
      Careers About Us Advertising Help Center

      White Label

      Broker API

      Data API

      Web Plug-ins

      Affiliate Program

      Awards Institution Evaluation IB Seminar Salon Event Exhibition
      Vietnam Thailand Singapore Dubai
      Fans Party Investment Sharing Session
      FastBull Summit BrokersView Expo
      Recent Searches
        Top Searches
          Markets
          Analysis
          User
          24/7
          Economic Calendar
          Education
          Data
          • Names
          • Latest
          • Prev

          View All

          No data

          Scan to Download

          Faster Charts, Chat Faster!

          Download
          English
          • English
          • Español
          • العربية
          • Bahasa Indonesia
          • Bahasa Melayu
          • Tiếng Việt
          • ภาษาไทย
          • Français
          • Italiano
          • Türkçe
          • Русский язык
          • 简中
          • 繁中
          Open Account
          Search
          Products
          Charts Free Forever
          Markets
          News
          Signals

          Copy Rankings Latest Signals Become a signal provider AI Rating
          Contests
          Brokers

          Overview Brokers Assessment Rankings Regulators News Claims
          Broker listing Forex Brokers Comparison Tool Live Spread Comparison Scam
          Q&A Complaint Scam Alert Videos Tips to Detect Scam
          More

          Business
          Events
          Careers About Us Advertising Help Center

          White Label

          Broker API

          Data API

          Web Plug-ins

          Affiliate Program

          Awards Institution Evaluation IB Seminar Salon Event Exhibition
          Vietnam Thailand Singapore Dubai
          Fans Party Investment Sharing Session
          FastBull Summit BrokersView Expo

          U.S. Initial Jobless Claims 4-Week Avg. (SA)

          Add Alert
          Alert added

          Act:--

          Fcst:--

          Prev:--

          Release Time:

          Release Schedule:Weekly

          Data Source:U.S. Bureau of Labor Statistics

          Data Interpretation: It is a good gauge of U.S. labor market trends, which measures an average of jobless claims over a four-week period. Actual Data>Forecast Data, Bearish for USD; Actual Data<Forecast Data, Bullish for USD.
          1 Year 2 Years 5 Years All
          RELEASE TIME ACT PREV FCST

          No data

          Impact

            4 Hours After Event
            • 4 Hours After Event
            • 1 Hour After Event
            • 30 Minutes After Event
            • 15 Minutes After Event
            • 5 Minutes After Event
            Actual < Forecast
            Probability of Rise: --
            Number of Rises: --
            Probability of Fall: --
            Number of Falls: --
            Avg. Volatility: --
            Actual = Forecast
            Probability of Rise: --
            Number of Rises: --
            Probability of Fall: --
            Number of Falls: --
            Avg. Volatility: --
            Actual > Forecast
            Probability of Rise: --
            Number of Rises: --
            Probability of Fall: --
            Number of Falls: --
            Avg. Volatility: --
            Price Chart

            No data

            Impact 4 Hours After Event

            No data

            Relevant Indicators

            No data

            Create Alert
            Create
            FastBull
            Copyright © 2026 FastBull Ltd

            728 RM B 7/F GEE LOK IND BLDG NO 34 HUNG TO RD KWUN TONG KLN HONG KONG

            TelegramInstagramTwitterfacebooklinkedin
            App Store Google Play Android Windows
            Products
            Charts

            Chats

            Q&A with Experts
            Screeners
            Economic Calendar
            Data
            Tools
            Membership
            Features
            Function
            Markets
            Copy Trading
            Latest Signals
            Contests
            24/7
            Analysis
            Education
            Company
            Careers
            About Us
            Contact Us
            Advertising
            Download FastBull
            Help Center
            Feedback
            User Agreement
            Privacy Policy
            Personal Information Protection Statement
            Business

            White Label

            Broker API

            Data API

            Web Plug-ins

            Poster Maker

            Affiliate Program

            Risk Disclosure

            The risk of loss in trading financial instruments such as stocks, FX, commodities, futures, bonds, ETFs and crypto can be substantial. You may sustain a total loss of the funds that you deposit with your broker. Therefore, you should carefully consider whether such trading is suitable for you in light of your circumstances and financial resources.

            No decision to invest should be made without thoroughly conducting due diligence by yourself or consulting with your financial advisors. Our web content might not suit you since we don't know your financial conditions and investment needs. Our financial information might have latency or contain inaccuracy, so you should be fully responsible for any of your trading and investment decisions. The company will not be responsible for your capital loss.

            Without getting permission from the website, you are not allowed to copy the website's graphics, texts, or trademarks. Intellectual property rights in the content or data incorporated into this website belong to its providers and exchange merchants.

            Not Logged In

            Log in to access more features

            Connect Broker
            Become a signal provider
            Help Center
            Customer Service
            Dark Mode
            Price Up/Down Colors

            Log In

            Sign Up

            Position
            Layout
            Fullscreen
            Default to Chart
            The chart page opens by default when you visit fastbull.com