• Trade
  • Markets
  • Copy
  • Contests
  • 24/7
  • Calendar
  • Q&A
  • Chats
Screeners
SYMBOL
LAST
BID
ASK
HIGH
LOW
NET CHG.
%CHG.
SPREAD
SOURCE
SPX
S&P 500 Index
7541.40
7541.40
7541.40
7662.23
7539.38
-38.67
-0.51%
--
--
DJI
Dow Jones Industrial Average
51983.98
51983.98
51983.98
52424.91
51981.66
+213.67
+ 0.41%
--
--
IXIC
NASDAQ Composite Index
25164.31
25164.31
25164.31
25799.46
25145.95
-272.68
-1.07%
--
--
USDX
US Dollar Index
101.568
101.568
101.648
101.700
101.545
-0.075
-0.07%
--
--
EURUSD
Euro / US Dollar
1.11921
1.11921
1.11931
1.11972
1.11767
+0.00059
+ 0.05%
--
--
GBPUSD
Pound Sterling / US Dollar
1.34104
1.34104
1.34117
1.34171
1.33957
+0.00051
+ 0.04%
--
--
XAUUSD
Gold / US Dollar
3918.46
3918.46
3918.89
3964.23
3917.46
-28.31
-0.72%
--
--
WTI
Light Sweet Crude Oil
96.487
96.487
96.517
96.494
95.171
+1.157
+ 1.21%
--
--

Community Accounts

Signal Accounts
--
Profit Accounts
--
Loss Accounts
--
View More

Become a signal provider

Sell trading signals to earn additional income

View More

Guide to Copy Trading

Get started with ease and confidence

View More

Signal Accounts for Members

All Signal Accounts

Best Return
  • Best Return
  • Best P/L
  • Best MDD
Past 1W
  • Past 1W
  • Past 1M
  • Past 1Y

All Contests

  • All
  • Recommend
  • Stocks
  • Cryptocurrencies
  • Central Banks
  • Trump Updates
  • Featured News
Top News Only
Share

Brent Crude Oil Rose 1% On The Day, Currently Trading At $105.82 Per Barrel

Share

The International Copper Futures Contract Fell By 1,000.00 Yuan During The Day, Currently Trading At 95,120.00 Yuan/ton, A Decrease Of 1.04%

Share

LME Copper Fell More Than 2.00% Intraday, Currently Trading At $14,057.50 Per Tonne

Share

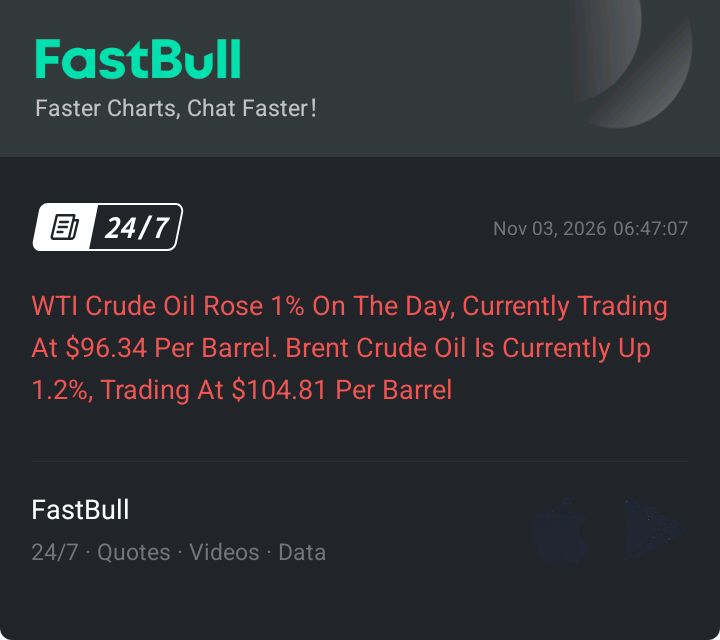
WTI Crude Oil Rose 1% On The Day, Currently Trading At $96.34 Per Barrel. Brent Crude Oil Is Currently Up 1.2%, Trading At $104.81 Per Barrel

Share

The Main Coking Coal Futures Contract Fell By 2.00% During The Day, Currently Trading At 1372.50 Yuan/ton

Share

The Main Silicon Iron Futures Contract Fell By More Than 2.00% Intraday, Currently Trading At 5714.00 Yuan/ton

Share

LME Tin Fell More Than 4.00% Intraday, Currently Trading At $47,800.00 Per Tonne

Share

The War Drove Up Oil Prices, And Saudi Aramco's Profits Increased By 9%

Share

New York Gold Futures Fell Below $3,930 Per Ounce, Down 1.00% On The Day

Share

New York Gold Futures Fell 1% On The Day, Currently Trading At $3,929.80 Per Ounce

Share

Russian Governor: The Yaroslavl Oil Refinery Was Attacked By 124 Drones

Share

Governor: An Oil Refinery In Yaroslavl, Russia, Was Damaged In A Drone Attack

Share

South Korea's Unification Ministry Responds To Allegations That North Korea Orchestrated The Binance Hack: The Situation Should Be Clarified First

Share

Reserve Bank Of Australia Governor Bullock: There Is No Certainty Of Another Rate Hike; The Aim Is To Preserve Policy Options

Share

Reserve Bank Of Australia Governor Bullock: This Rate Hike May Not Be Enough, But That's Not So Obvious

Share

Reserve Bank Of Australia Governor Bullock: The Australian Dollar's Movement Is In Line With Interest Rate Differentials, And It Will Take Time For This To Be Transmitted To Import Prices

Share

Saudi Aramco: We Will Continue To Assess Any Potential Material Impact Of These Events On Its Operations And Financial Results

Share

Saudi Aramco: The Global Energy Market Faces Prolonged Disruptions Due To Ongoing Geopolitical Events, Leading To Price Volatility In The Third Quarter

Share

Saudi Aramco: The Average Realized Price Of Crude Oil In The Third Quarter Was $95.2 Per Barrel

Share

Fitch Ratings Upgraded The Ratings Of Four Mid-sized Chinese Banks Due To Increased Government Support

TIME
ACT
FCST
PREV
IMPACT
Australia Building Permits MoM (SA) (Sept)

A:--

F: --

P: --
AUDUSD
  • AUDUSD
  • XAUUSD
  • XAGUSD
  • WTI
  • USDX
Australia Private Building Permits MoM (SA) (Sept)

A:--

F: --

P: --

AUDUSD
  • AUDUSD
  • XAUUSD
  • XAGUSD
  • WTI
  • USDX
Japan Manufacturing PMI Final (Oct)

A:--

F: --

P: --

USDJPY
  • USDJPY
  • XAUUSD
  • XAGUSD
  • WTI
  • USDX
China, Mainland Caixin Manufacturing PMI (SA) (Oct)

A:--

F: --

P: --

XAUUSD
  • XAUUSD
  • XAGUSD
  • WTI
  • USDX
Indonesia Inflation Rate YoY (Oct)

A:--

F: --

P: --

XAUUSD
  • XAUUSD
  • XAGUSD
  • WTI
  • USDX
Indonesia Trade Balance (Sept)

A:--

F: --

P: --

XAUUSD
  • XAUUSD
  • XAGUSD
  • WTI
  • USDX
Indonesia Core Inflation YoY (Oct)

A:--

F: --

P: --

XAUUSD
  • XAUUSD
  • XAGUSD
  • WTI
  • USDX
India HSBC Manufacturing PMI Final (Oct)

A:--

F: --

P: --

XAUUSD
  • XAUUSD
  • XAGUSD
  • WTI
  • USDX
Australia Commodity Price YoY (Oct)

A:--

F: --

P: --

AUDUSD
  • AUDUSD
  • XAUUSD
  • XAGUSD
  • WTI
  • USDX
Russia IHS Markit Manufacturing PMI (Oct)

A:--

F: --

P: --

WTI
  • WTI
  • XAUUSD
  • XAGUSD
  • USDX
Germany Actual Retail Sales MoM (Sept)

A:--

F: --

P: --
EURUSD
  • EURUSD
  • XAUUSD
  • XAGUSD
  • WTI
  • USDX
Turkey Manufacturing PMI (Oct)

A:--

F: --

P: --

XAUUSD
  • XAUUSD
  • XAGUSD
  • WTI
  • USDX
Italy Manufacturing PMI (SA) (Oct)

A:--

F: --

P: --

EURUSD
  • EURUSD
  • XAUUSD
  • XAGUSD
  • WTI
  • USDX
South Africa Manufacturing PMI (Oct)

A:--

F: --

P: --

XAUUSD
  • XAUUSD
  • XAGUSD
  • WTI
  • USDX
Euro Zone Manufacturing PMI Final (Oct)

A:--

F: --

P: --

EURUSD
  • EURUSD
  • XAUUSD
  • XAGUSD
  • WTI
  • USDX
U.K. Manufacturing PMI Prelim (Oct)

A:--

F: --

P: --

GBPUSD
  • GBPUSD
  • XAUUSD
  • XAGUSD
  • WTI
  • USDX
Canada National Economic Confidence Index

A:--

F: --

P: --

USDCAD
  • USDCAD
  • XAUUSD
  • XAGUSD
  • WTI
  • USDX
Canada Manufacturing PMI (SA) (Oct)

A:--

F: --

P: --

USDCAD
  • USDCAD
  • XAUUSD
  • XAGUSD
  • WTI
  • USDX
U.S. IHS Markit Manufacturing PMI Final (Oct)

A:--

F: --

P: --

USDX
  • USDX
  • XAUUSD
  • XAGUSD
  • WTI
U.S. ISM Inventories Index (Oct)

A:--

F: --

P: --

USDX
  • USDX
  • XAUUSD
  • XAGUSD
  • WTI
U.S. Construction Spending MoM (Sept)

A:--

F: --

P: --
USDX
  • USDX
  • XAUUSD
  • XAGUSD
  • WTI
U.S. ISM Output Index (Oct)

A:--

F: --

P: --

USDX
  • USDX
  • XAUUSD
  • XAGUSD
  • WTI
U.S. ISM Manufacturing Employment Index (Oct)

A:--

F: --

P: --

USDX
  • USDX
  • XAUUSD
  • XAGUSD
  • WTI
U.S. ISM Manufacturing PMI (Oct)

A:--

F: --

P: --

USDX
  • USDX
  • XAUUSD
  • XAGUSD
  • WTI
U.S. ISM Manufacturing New Orders Index (Oct)

A:--

F: --

P: --

USDX
  • USDX
  • XAUUSD
  • XAGUSD
  • WTI
South Korea CPI YoY (Oct)

A:--

F: --

P: --

XAUUSD
  • XAUUSD
  • XAGUSD
  • WTI
Australia Overnight (Borrowing) Key Rate

A:--

F: --

P: --

AUDUSD
  • AUDUSD
  • XAUUSD
  • XAGUSD
  • WTI
  • USDX
RBA Rate Statement
Saudi Arabia IHS Markit Composite PMI (Oct)

A:--

F: --

P: --

WTI
  • WTI
  • XAUUSD
  • XAGUSD
  • USDX
RBA Press Conference
Turkey CPI YoY (Oct)

--

F: --

P: --

Turkey PPI YoY (Oct)

--

F: --

P: --

Brazil IHS Markit Manufacturing PMI (Oct)

--

F: --

P: --

U.S. Weekly Redbook Index YoY

--

F: --

P: --

U.S. JOLTS Job Openings (SA) (Sept)

--

F: --

P: --

U.S. Factory Orders MoM (Sept)

--

F: --

P: --

U.S. Factory Orders MoM (Excl. Transport) (Sept)

--

F: --

P: --

U.S. Factory Orders MoM (Excl. Defense) (Sept)

--

F: --

P: --

Mexico Manufacturing PMI (Oct)

--

F: --

P: --

U.S. API Weekly Crude Oil Stocks

--

F: --

P: --

U.S. API Weekly Cushing Crude Oil Stocks

--

F: --

P: --

U.S. API Weekly Gasoline Stocks

--

F: --

P: --

U.S. API Weekly Refined Oil Stocks

--

F: --

P: --

Australia Services PMI Prelim (Oct)

--

F: --

P: --

Japan Monetary Base YoY (SA) (Oct)

--

F: --

P: --

China, Mainland Caixin Composite PMI (Oct)

--

F: --

P: --

China, Mainland Caixin Services PMI (Oct)

--

F: --

P: --

India HSBC Services PMI Final (Oct)

--

F: --

P: --

India IHS Markit Composite PMI (Oct)

--

F: --

P: --

Italy Services PMI (SA) (Oct)

--

F: --

P: --

Italy Composite PMI (Oct)

--

F: --

P: --

Germany Composite PMI Final (SA) (Oct)

--

F: --

P: --

Euro Zone Services PMI Final (Oct)

--

F: --

P: --

Euro Zone Composite PMI Final (Oct)

--

F: --

P: --

U.K. Services PMI Prelim (Oct)

--

F: --

P: --

U.K. Official Reserves Changes (Oct)

--

F: --

P: --

U.K. Composite PMI Prelim (Oct)

--

F: --

P: --

Euro Zone Core CPI Prelim YoY (Oct)

--

F: --

P: --

Euro Zone Core CPI Prelim MoM (Oct)

--

F: --

P: --

Euro Zone HICP Prelim YoY (Oct)

--

F: --

P: --

Q&A with Experts
    • All
    • Chatrooms
    • Groups
    • Friends
    Size flag
    Skylark flag
    sonam
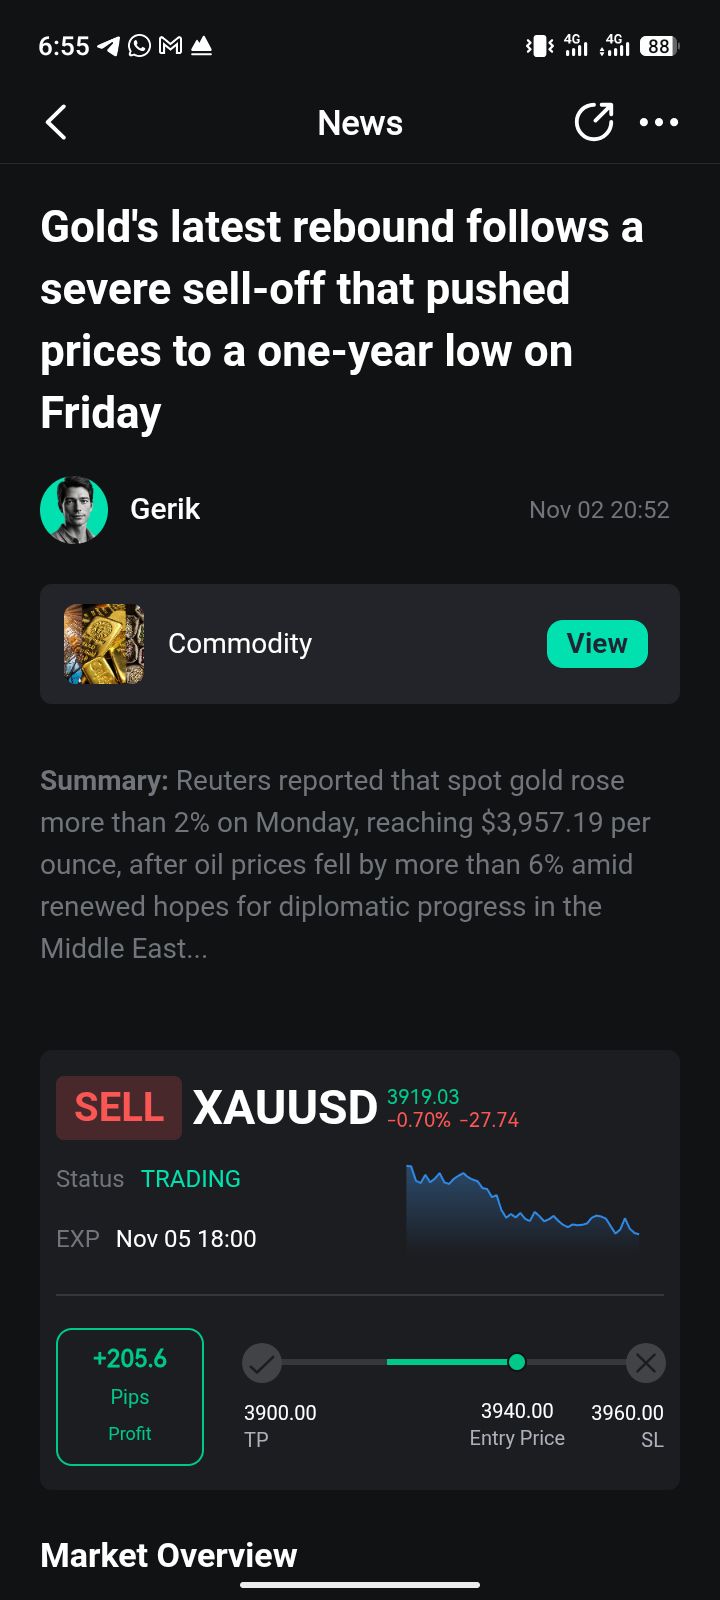
    xauusd sell now 3930-3935 SL 3945 target 3925.3920.3915.3910.3905.open
    @sonamOh, I see you've already dropped some signals. How is it going? Is it in profit or currently in loss? And I didn't see any TP, what's your target? Oh, I just see now, 3945 as TP, stop loss 3935. Well, let's see how it plays out.
    Eon flag
    Skylark
    @EonYeah. can you enlightened me more about the correlation between oil and gold if I may ask and definitely structure matters and inflation also matters when trading gold
    @Skylark oil is a as driving factor for inflation, and inflation drives yields upwards
    Size flag
    Eon
    @Skylark oil is a as driving factor for inflation, and inflation drives yields upwards
    @EonExactly, mate. That's the transmission mechanism worth watching.
    Skylark flag
    Eon
    @Skylark oil is a as driving factor for inflation, and inflation drives yields upwards
    @Eon Oh, I got it. Thanks for more clarification. So oil is a factor for inflation and inflation drives yields upward. Oh, I got it now. Which significantly affects gold. Thank you for more understanding.
    Size flag
    Eon
    @Skylark oil is a as driving factor for inflation, and inflation drives yields upwards
    The interesting part is how the bond market prices those inflation risks.@Eon
    Skylark flag
    Eon
    @Skylark oil is a as driving factor for inflation, and inflation drives yields upwards
    @Eon So automatically if oil is in a downtrend or is going down then gold will go the opposite direction, right?
    Size flag
    Size
    The interesting part is how the bond market prices those inflation risks.@Eon
    It's not always a straightforward relationship, though. @Eon
    Skylark flag
    Matthew
    @EuroTradernfp is this week, i never knew
    @Matthew Hello bro. Morning to you and welcome. How are you doing today? What are you currently trading? What's on your radar? Yeah, we have NFP this week and let's hope for the best and see what and how it's going to affect the market.
    Eon flag
    Skylark
    @Eon So automatically if oil is in a downtrend or is going down then gold will go the opposite direction, right?
    @Skylark its not always a driving factor mate (not automatic), eg yields were falling last week but gold was still bearish
    SlowBear ⛅ flag
    sonam
    xauusd sell now
    @sonamSelling gold now,, could be tricky but definitaely not out of touch
    Eon flag
    Size
    It's not always a straightforward relationship, though. @Eon
    @Size absolutely mate, the data develops over time and with it we experience volatile price movements
    Skylark flag
    Eon
    @Skylark its not always a driving factor mate (not automatic), eg yields were falling last week but gold was still bearish
    @Eon Okay I got it so it's not always a driving factor, It will not be a bad idea to still watch it out right?
    Skylark flag
    Eon
    @Skylark its not always a driving factor mate (not automatic), eg yields were falling last week but gold was still bearish
    @Eon That's some different scenarios. It seems gold at that moment was driven by other factors, not the US yields.
    Size flag
    Eon
    @Size absolutely mate, the data develops over time and with it we experience volatile price movements
    @EonAbsolutely, mate. And that's what makes these macro developments interesting.
    RPGFX flag
    RPGFX flag
    RPGFX
    I shared this trade here yesterday before it triggered, whoever took it will be smiling in nice profits now
    Size flag
    Eon
    @Size absolutely mate, the data develops over time and with it we experience volatile price movements
    The market is constantly repricing expectations as new data comes in, and that can create sharp volatility across assets. @Eon
    RPGFX flag
    Eon
    @Size absolutely mate, the data develops over time and with it we experience volatile price movements
    @Eon That sell you got a confirmation for yesterday actually held through
    Size flag
    The real question is how much of that information is already priced in and how price responds when fresh data hits.@Eon
    Type here...
    Add Symbol or Code

      No matching data

      All
      Recommend
      Stocks
      Cryptocurrencies
      Central Banks
      Trump Updates
      Featured News
      • All
      • Russia-Ukraine Conflict
      • Middle East Flashpoint
      • All
      • Russia-Ukraine Conflict
      • Middle East Flashpoint
      Search
      Products

      Charts Free Forever

      Chats Q&A with Experts
      Screeners Economic Calendar Data Tools
      Membership Features
      Data Warehouse Market Trends Institutional Data Policy Rates Macro

      Market Trends

      Market Sentiment Order Book Forex Correlations

      Top Indicators

      Charts Free Forever
      Markets

      News

      24/7 Analysis Education

      Latest Views

      Latest Update

      Signals

      Copy Rankings Latest Signals Become a signal provider AI Rating
      Contests
      Brokers

      Overview Brokers Assessment Rankings Regulators News Claims
      Broker listing Forex Brokers Comparison Tool Live Spread Comparison Scam
      Q&A Complaint Scam Alert Videos Tips to Detect Scam
      More

      Business
      Events
      Careers About Us Advertising Help Center

      White Label

      Broker API

      Data API

      Web Plug-ins

      Affiliate Program

      Awards Institution Evaluation IB Seminar Salon Event Exhibition
      Vietnam Thailand Singapore Dubai
      Fans Party Investment Sharing Session
      FastBull Summit BrokersView Expo
      Recent Searches
        Top Searches
          Markets
          Analysis
          User
          24/7
          Economic Calendar
          Education
          Data
          • Names
          • Latest
          • Prev

          View All

          No data

          Scan to Download

          Faster Charts, Chat Faster!

          Download
          English
          • English
          • Español
          • العربية
          • Bahasa Indonesia
          • Bahasa Melayu
          • Tiếng Việt
          • ภาษาไทย
          • Français
          • Italiano
          • Türkçe
          • Русский язык
          • 简中
          • 繁中
          Open Account
          Search
          Products
          Charts Free Forever
          Markets
          News
          Signals

          Copy Rankings Latest Signals Become a signal provider AI Rating
          Contests
          Brokers

          Overview Brokers Assessment Rankings Regulators News Claims
          Broker listing Forex Brokers Comparison Tool Live Spread Comparison Scam
          Q&A Complaint Scam Alert Videos Tips to Detect Scam
          More

          Business
          Events
          Careers About Us Advertising Help Center

          White Label

          Broker API

          Data API

          Web Plug-ins

          Affiliate Program

          Awards Institution Evaluation IB Seminar Salon Event Exhibition
          Vietnam Thailand Singapore Dubai
          Fans Party Investment Sharing Session
          FastBull Summit BrokersView Expo

          U.K. Composite PMI Prelim (Oct)

          Add Alert
          Alert added

          Act:--

          Fcst:--

          Prev:--

          Release Time:

          Release Schedule:Monthly

          Data Source:IHS Markit

          Data Interpretation: Purchasing Managers' Index (PMI) is an index compiled through monthly surveys of purchasing managers, which can reflect economic trends. PMI released monthly, is a set of comprehensive economic monitoring system, which is divided into manufacturing PMI and service industry PMI. Some countries have also established construction industry PMI. The 50 point of the PMI index is the dividing line. A reading above 50 indicates that overall economic activity has expanded, below 38 indicates that economic activity has contracted. Actual Data>Forecast Data, Bullish for GBP; Actual Data<Forecast Data, Bearish for GBP.
          1 Year 2 Years 5 Years All
          RELEASE TIME ACT PREV FCST

          No data

          Impact

            4 Hours After Event
            • 4 Hours After Event
            • 1 Hour After Event
            • 30 Minutes After Event
            • 15 Minutes After Event
            • 5 Minutes After Event
            Actual < Forecast
            Probability of Rise: --
            Number of Rises: --
            Probability of Fall: --
            Number of Falls: --
            Avg. Volatility: --
            Actual = Forecast
            Probability of Rise: --
            Number of Rises: --
            Probability of Fall: --
            Number of Falls: --
            Avg. Volatility: --
            Actual > Forecast
            Probability of Rise: --
            Number of Rises: --
            Probability of Fall: --
            Number of Falls: --
            Avg. Volatility: --
            Price Chart

            No data

            Impact 4 Hours After Event

            No data

            Relevant Indicators

            No data

            Create Alert
            Create
            FastBull
            Copyright © 2026 FastBull Ltd

            728 RM B 7/F GEE LOK IND BLDG NO 34 HUNG TO RD KWUN TONG KLN HONG KONG

            TelegramInstagramTwitterfacebooklinkedin
            App Store Google Play Android Windows
            Products
            Charts

            Chats

            Q&A with Experts
            Screeners
            Economic Calendar
            Data
            Tools
            Membership
            Features
            Function
            Markets
            Copy Trading
            Latest Signals
            Contests
            24/7
            Analysis
            Education
            Company
            Careers
            About Us
            Contact Us
            Advertising
            Download FastBull
            Help Center
            Feedback
            User Agreement
            Privacy Policy
            Personal Information Protection Statement
            Business

            White Label

            Broker API

            Data API

            Web Plug-ins

            Poster Maker

            Affiliate Program

            Risk Disclosure

            The risk of loss in trading financial instruments such as stocks, FX, commodities, futures, bonds, ETFs and crypto can be substantial. You may sustain a total loss of the funds that you deposit with your broker. Therefore, you should carefully consider whether such trading is suitable for you in light of your circumstances and financial resources.

            No decision to invest should be made without thoroughly conducting due diligence by yourself or consulting with your financial advisors. Our web content might not suit you since we don't know your financial conditions and investment needs. Our financial information might have latency or contain inaccuracy, so you should be fully responsible for any of your trading and investment decisions. The company will not be responsible for your capital loss.

            Without getting permission from the website, you are not allowed to copy the website's graphics, texts, or trademarks. Intellectual property rights in the content or data incorporated into this website belong to its providers and exchange merchants.

            Not Logged In

            Log in to access more features

            Connect Broker
            Become a signal provider
            Help Center
            Customer Service
            Dark Mode
            Price Up/Down Colors

            Log In

            Sign Up

            Position
            Layout
            Fullscreen
            Default to Chart
            The chart page opens by default when you visit fastbull.com