• Trade
  • Markets
  • Copy
  • Contests
  • 24/7
  • Calendar
  • Q&A
  • Chats
Screeners
SYMBOL
LAST
BID
ASK
HIGH
LOW
NET CHG.
%CHG.
SPREAD
SOURCE
SPX
S&P 500 Index
7482.16
7482.16
7482.16
7543.92
7480.55
-67.78
-0.90%
--
--
DJI
Dow Jones Industrial Average
52015.04
52015.04
52015.04
52291.77
51977.08
-374.71
-0.72%
--
--
IXIC
NASDAQ Composite Index
24935.16
24935.16
24935.16
25286.83
24909.49
-317.97
-1.26%
--
--
USDX
US Dollar Index
102.198
102.198
102.278
102.268
101.337
+0.688
+ 0.68%
--
--
EURUSD
Euro / US Dollar
1.11522
1.11522
1.11531
1.12510
1.11452
-0.00704
-0.63%
--
--
GBPUSD
Pound Sterling / US Dollar
1.33242
1.33242
1.33254
1.34588
1.33117
-0.01162
-0.86%
--
--
XAUUSD
Gold / US Dollar
4021.40
4021.40
4021.74
4146.49
4013.54
-119.08
-2.88%
--
--
WTI
Light Sweet Crude Oil
85.599
85.599
85.629
86.053
83.036
+0.106
+ 0.12%
--
--

Community Accounts

Signal Accounts
--
Profit Accounts
--
Loss Accounts
--
View More

Become a signal provider

Sell trading signals to earn additional income

View More

Guide to Copy Trading

Get started with ease and confidence

View More

Signal Accounts for Members

All Signal Accounts

Best Return
  • Best Return
  • Best P/L
  • Best MDD
Past 1W
  • Past 1W
  • Past 1M
  • Past 1Y

All Contests

  • All
  • Recommend
  • Stocks
  • Cryptocurrencies
  • Central Banks
  • Trump Updates
  • Featured News
Top News Only
Share

The U.S. Energy Information Administration Projects That Crude Oil Inventories Will Rise In 2027 Due To Increased Net Imports And Domestic Oil Production Reaching A Record 14.3 Million Barrels Per Day

Share

The U.S. Energy Information Administration Projects Global Oil Demand At 102.4 Million Barrels Per Day In 2026, Unchanged From Its Previous Forecast; And Projects Demand At 104.4 Million Barrels Per Day In 2027, Up From Its Previous Forecast Of 104.6 Million Barrels Per Day

Share

The U.S. Energy Information Administration Projects Global Oil Production At 101.7 Million Barrels Per Day In 2026, Up From Its Previous Forecast Of 101.1 Million Barrels Per Day; And Projects Production At 108.4 Million Barrels Per Day In 2027, Up From Its Previous Forecast Of 109.6 Million Barrels Per Day

Share

Following The Release Of The U.S. Department Of Agriculture's Global Agricultural Supply And Demand Forecast Report, ICE Cotton Futures Remained Largely Unchanged, Last Quoted At 78.8 Cents Per Pound

Share

The U.S. Department Of Agriculture Maintains Its 2026/2027 Soybean Production Forecast For Argentina At 50 Million Tons And Its 2026/2027 Soybean Production Forecast For Brazil At 186 Million Tons

Share

The U.S. Energy Information Administration (EIA) Projects That U.S. Oil Production Will Average 14.03 Million Barrels Per Day In November, Compared With 13.81 Million Barrels Per Day In October; And That Average Production Will Average 14.14 Million Barrels Per Day In December

Share

The U.S. Energy Information Administration (EIA) Released Its Short-Term Energy Outlook (STEO) Forecast: Brent Crude Oil Prices Are Projected At $97 Per Barrel In 2026 (previously $96 Per Barrel) And $86 Per Barrel In 2027 (previously $84 Per Barrel). U.S. Oil Production Is Projected At 13.9 Million Barrels Per Day In 2026 (previously 13.9 Million Barrels Per Day) And 14.3 Million Barrels Per Day In 2027

Share

Chile's Copper Commission: Copper Production At The Escondida Copper Mine In Chile Fell 20.9% Year-on-Year In September To 93,800 Tons. Copper Production At The Collahuasi Copper Mine In Chile Fell 19.2% Year-on-Year In September To 30,700 Tons

Share

Ahead Of The USDA Monthly Report Release, CBOT Soybeans Rose 0.13%, CBOT Corn Rose 0.68%, CBOT Wheat Rose 0.55%, And CBOT Soybean Meal Fell 0.12%

Share

The Yield On The 2-year U.S. Treasury Note Rose 20 Basis Points To 4.77% On The Day

Share

Spot Platinum Fell 3% To $1,529.31 An Ounce

Share

According To The New York Times, Sources Say Syria Is Considering Sending Troops To Saudi Arabia And Yemen To Help Fight The Houthi Rebels

Share

Market News: Syria Is Considering Sending Troops To Assist Saudi Arabia In Its Fight Against The Houthis

Share

Canadian Prime Minister Carney: Canada Has Drawn A Red Line With The United States On Cultural Issues

Share

Canadian Prime Minister Carney: There Are Still Some Difficult Areas In Trade Negotiations With The United States

Share

Spot Gold Fell Below $4,020 Per Ounce, Down 2.92% On The Day

Share

Canadian Prime Minister Carney: He May Meet With US President Trump At The Asia Summit Later This Month

Share

Canadian Prime Minister Mark Carney Said He Had A Brief Conversation With US President Donald Trump Over The Weekend

Share

New York Gold Futures Fell Below $4,030 Per Ounce, Down 2.06% On The Day

Share

Most Major European Stock Indices Closed Higher, With The UK FTSE 100 Down 0.09%, The French CAC 40 Up 0.89%, The German DAX 30 Up 0.47%, And The FTSE Italy MIB Up 0.76%

TIME
ACT
FCST
PREV
IMPACT
Japan Trade Balance (Sept)

A:--

F: --

P: --

USDJPY
  • USDJPY
  • XAUUSD
  • XAGUSD
  • WTI
  • USDX
U.K. BRC Like-For-Like Retail Sales YoY (Oct)

A:--

F: --

P: --

GBPUSD
  • GBPUSD
  • XAUUSD
  • XAGUSD
  • WTI
U.K. BRC Overall Retail Sales YoY (Oct)

A:--

F: --

P: --

GBPUSD
  • GBPUSD
  • XAUUSD
  • XAGUSD
  • WTI
China, Mainland Exports YoY (USD) (Oct)

A:--

F: --

P: --

XAUUSD
  • XAUUSD
  • XAGUSD
  • WTI
  • USDX
China, Mainland Imports YoY (USD) (Oct)

A:--

F: --

P: --

XAUUSD
  • XAUUSD
  • XAGUSD
  • WTI
  • USDX
China, Mainland Imports YoY (CNH) (Oct)

A:--

F: --

P: --

XAUUSD
  • XAUUSD
  • XAGUSD
  • WTI
  • USDX
China, Mainland Trade Balance (USD) (Oct)

A:--

F: --

P: --

XAUUSD
  • XAUUSD
  • XAGUSD
  • WTI
  • USDX
China, Mainland Imports (CNH) (Oct)

A:--

F: --

P: --

XAUUSD
  • XAUUSD
  • XAGUSD
  • WTI
  • USDX
China, Mainland Exports (Oct)

A:--

F: --

P: --

XAUUSD
  • XAUUSD
  • XAGUSD
  • WTI
  • USDX
China, Mainland Trade Balance (CNH) (Oct)

A:--

F: --

P: --

XAUUSD
  • XAUUSD
  • XAGUSD
  • WTI
  • USDX
Indonesia Retail Sales YoY (Sept)

A:--

F: --

P: --

XAUUSD
  • XAUUSD
  • XAGUSD
  • WTI
  • USDX
Japan 30-Year JGB Auction Yield

A:--

F: --

P: --

USDJPY
  • USDJPY
  • XAUUSD
  • XAGUSD
  • WTI
  • USDX
France ILO Unemployment Rate (SA) (Q3)

A:--

F: --

P: --

EURUSD
  • EURUSD
  • XAUUSD
  • XAGUSD
  • WTI
  • USDX
South Africa Unemployment Rate (Q3)

A:--

F: --

P: --

XAUUSD
  • XAUUSD
  • XAGUSD
  • WTI
  • USDX
FOMC Member Waller Speaks
U.K. 30-Year JGB Auction Yield

A:--

F: --

P: --

GBPUSD
  • GBPUSD
  • XAUUSD
  • XAGUSD
  • WTI
  • USDX
U.S. NFIB Small Business Optimism Index (SA) (Oct)

A:--

F: --

P: --

USDX
  • USDX
  • XAUUSD
  • XAGUSD
  • WTI
U.S. Real Income MoM (SA) (Oct)

A:--

F: --

P: --
USDX
  • USDX
  • XAUUSD
  • XAGUSD
  • WTI
U.S. Core CPI MoM (SA) (Oct)

A:--

F: --

P: --

XAUUSD
  • XAUUSD
  • XAGUSD
  • WTI
  • USDX
U.S. CPI MoM (SA) (Oct)

A:--

F: --

P: --

XAUUSD
  • XAUUSD
  • XAGUSD
  • WTI
  • USDX
U.S. Core CPI (SA) (Oct)

A:--

F: --

P: --

XAUUSD
  • XAUUSD
  • XAGUSD
  • WTI
  • USDX
U.S. CPI MoM (Not SA) (Oct)

A:--

F: --

P: --

XAUUSD
  • XAUUSD
  • XAGUSD
  • WTI
  • USDX
U.S. Weekly Redbook Index YoY

A:--

F: --

P: --

XAUUSD
  • XAUUSD
  • XAGUSD
  • WTI
  • USDX
China, Mainland M1 Money Supply YoY (Oct)

--

F: --

P: --

China, Mainland Social Financing Scale (Oct)

--

F: --

P: --

China, Mainland M2 Money Supply YoY (Oct)

--

F: --

P: --

China, Mainland M0 Money Supply YoY (Oct)

--

F: --

P: --

ECB Chief Economist Lane Speaks
U.S. EIA Short-Term Crude Production Forecast For The Year (Nov)

A:--

F: --

P: --

WTI
  • WTI
  • XAUUSD
  • XAGUSD
  • USDX
U.S. Cleveland Fed CPI MoM (Oct)

--

F: --

P: --

U.S. EIA Natural Gas Production Forecast For The Next Year (Nov)

A:--

F: --

P: --

WTI
  • WTI
  • XAUUSD
  • XAGUSD
  • USDX
U.S. EIA Short-Term Crude Production Forecast For The Next Year (Nov)

A:--

F: --

P: --

WTI
  • WTI
  • XAUUSD
  • XAGUSD
  • USDX
EIA Monthly Short-Term Energy Outlook
U.S. 10-Year Note Auction Avg. Yield

--

F: --

P: --

U.S. API Weekly Refined Oil Stocks

--

F: --

P: --

U.S. API Weekly Cushing Crude Oil Stocks

--

F: --

P: --

U.S. API Weekly Gasoline Stocks

--

F: --

P: --

U.S. API Weekly Crude Oil Stocks

--

F: --

P: --

Japan Reuters Tankan Manufacturers Index (Nov)

--

F: --

P: --

Japan Reuters Tankan Non-Manufacturers Index (Nov)

--

F: --

P: --

South Korea Unemployment Rate (SA) (Oct)

--

F: --

P: --

Philadelphia Fed President Henry Paulson delivers a speech
Australia House Loan Permits MoM (SA) (Q3)

--

F: --

P: --

Turkey Retail Sales YoY (Sept)

--

F: --

P: --

Germany GDP Prelim QoQ (SA) (Oct)

--

F: --

P: --

Germany GDP Prelim YoY (Working-day Adjusted) (Oct)

--

F: --

P: --

Germany HICP Final MoM (Oct)

--

F: --

P: --

Germany HICP Final YoY (Oct)

--

F: --

P: --

Italy Industrial Output YoY (SA) (Sept)

--

F: --

P: --

Italy 12-Month BOT Auction Avg. Yield

--

F: --

P: --

U.S. MBA Mortgage Application Activity Index WoW

--

F: --

P: --

Brazil Services Growth YoY (Sept)

--

F: --

P: --

Mexico Industrial Output YoY (Sept)

--

F: --

P: --

Russia Trade Balance (Sept)

--

F: --

P: --

U.S. Refinitiv/Ipsos Primary Consumer Sentiment Index (PCSI) (Nov)

--

F: --

P: --

Japan PPI MoM (Oct)

--

F: --

P: --

Japan Domestic Enterprise Commodity Price Index YoY (Oct)

--

F: --

P: --

Japan Domestic Enterprise Commodity Price Index MoM (Oct)

--

F: --

P: --

Australia Consumer Inflation Expectations (Nov)

--

F: --

P: --

Q&A with Experts
    • All
    • Chatrooms
    • Groups
    • Friends
    Nawhdir flag
    how bout gold, my stupid think want markit rapes me
    Nawhdir flag
    Sanjeev Ku flag
    jackpoooooooooooot
    Nawhdir flag
    Sanjeev Ku flag
    Sanjeev Ku
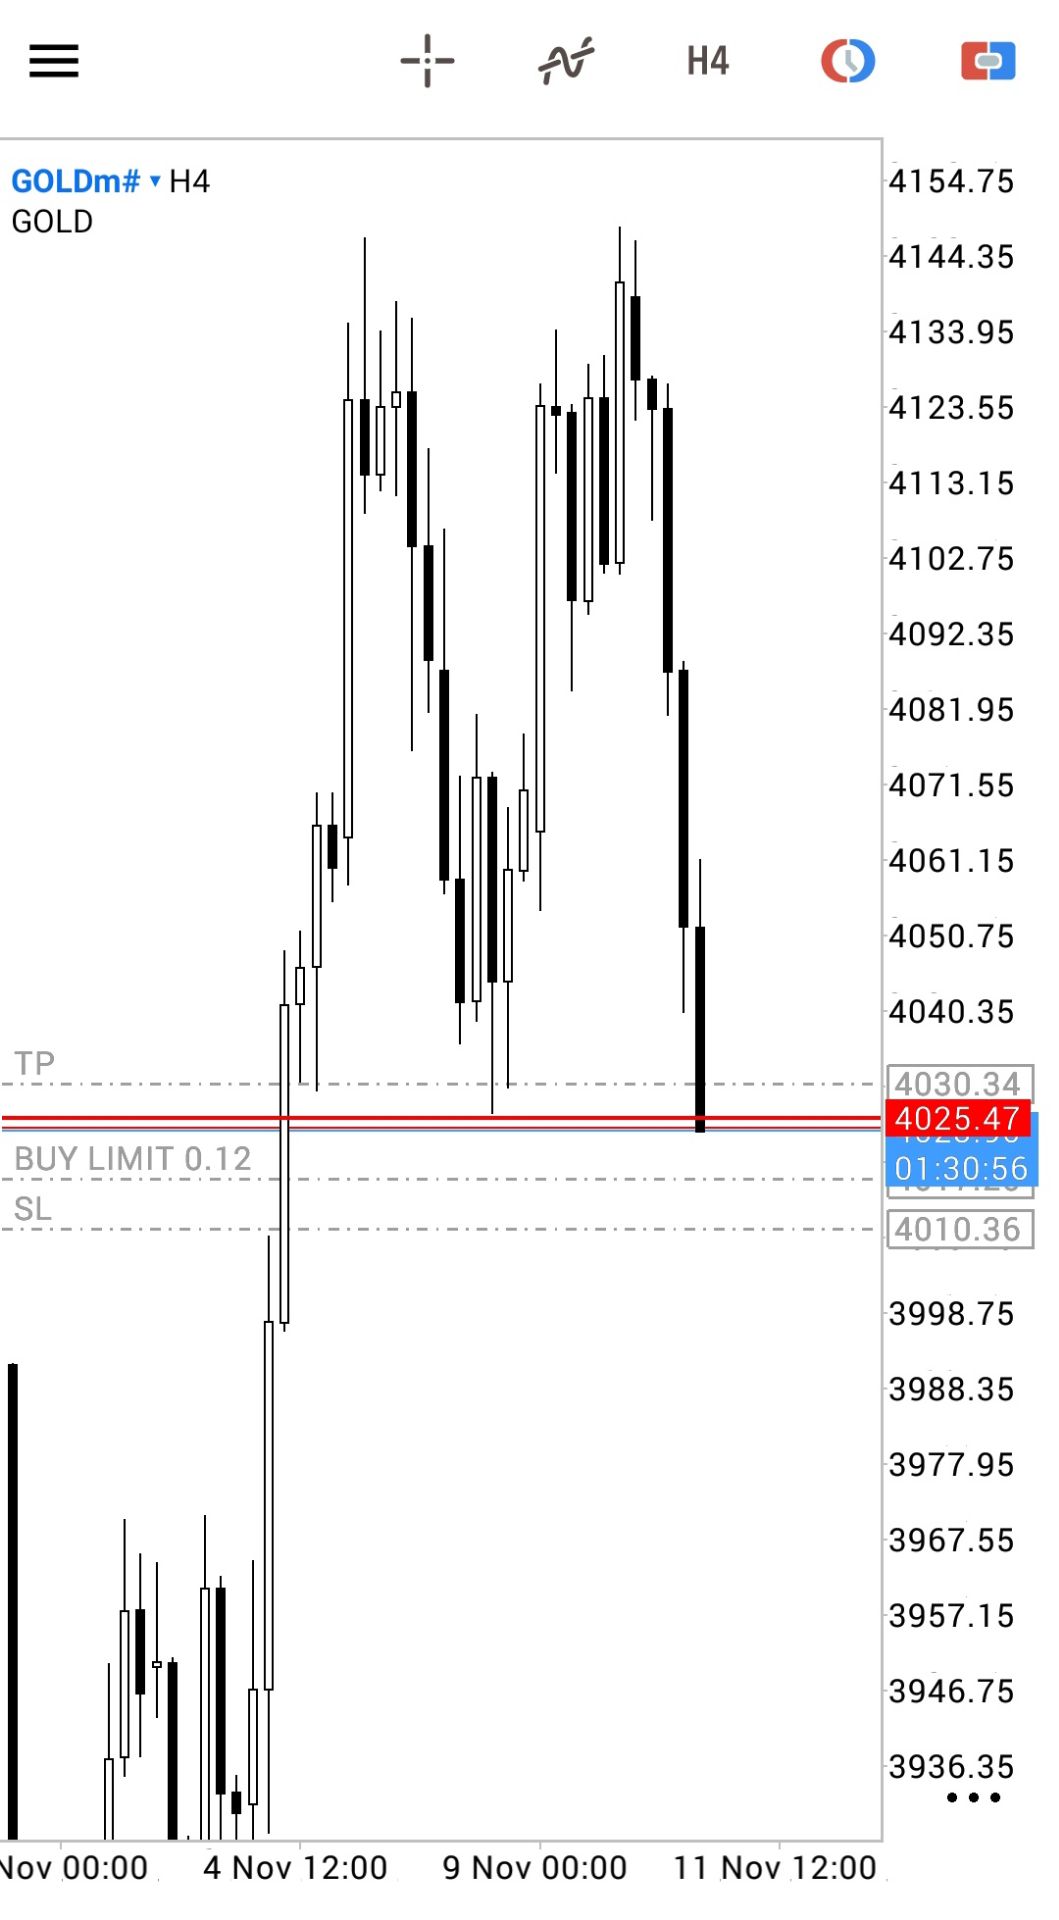
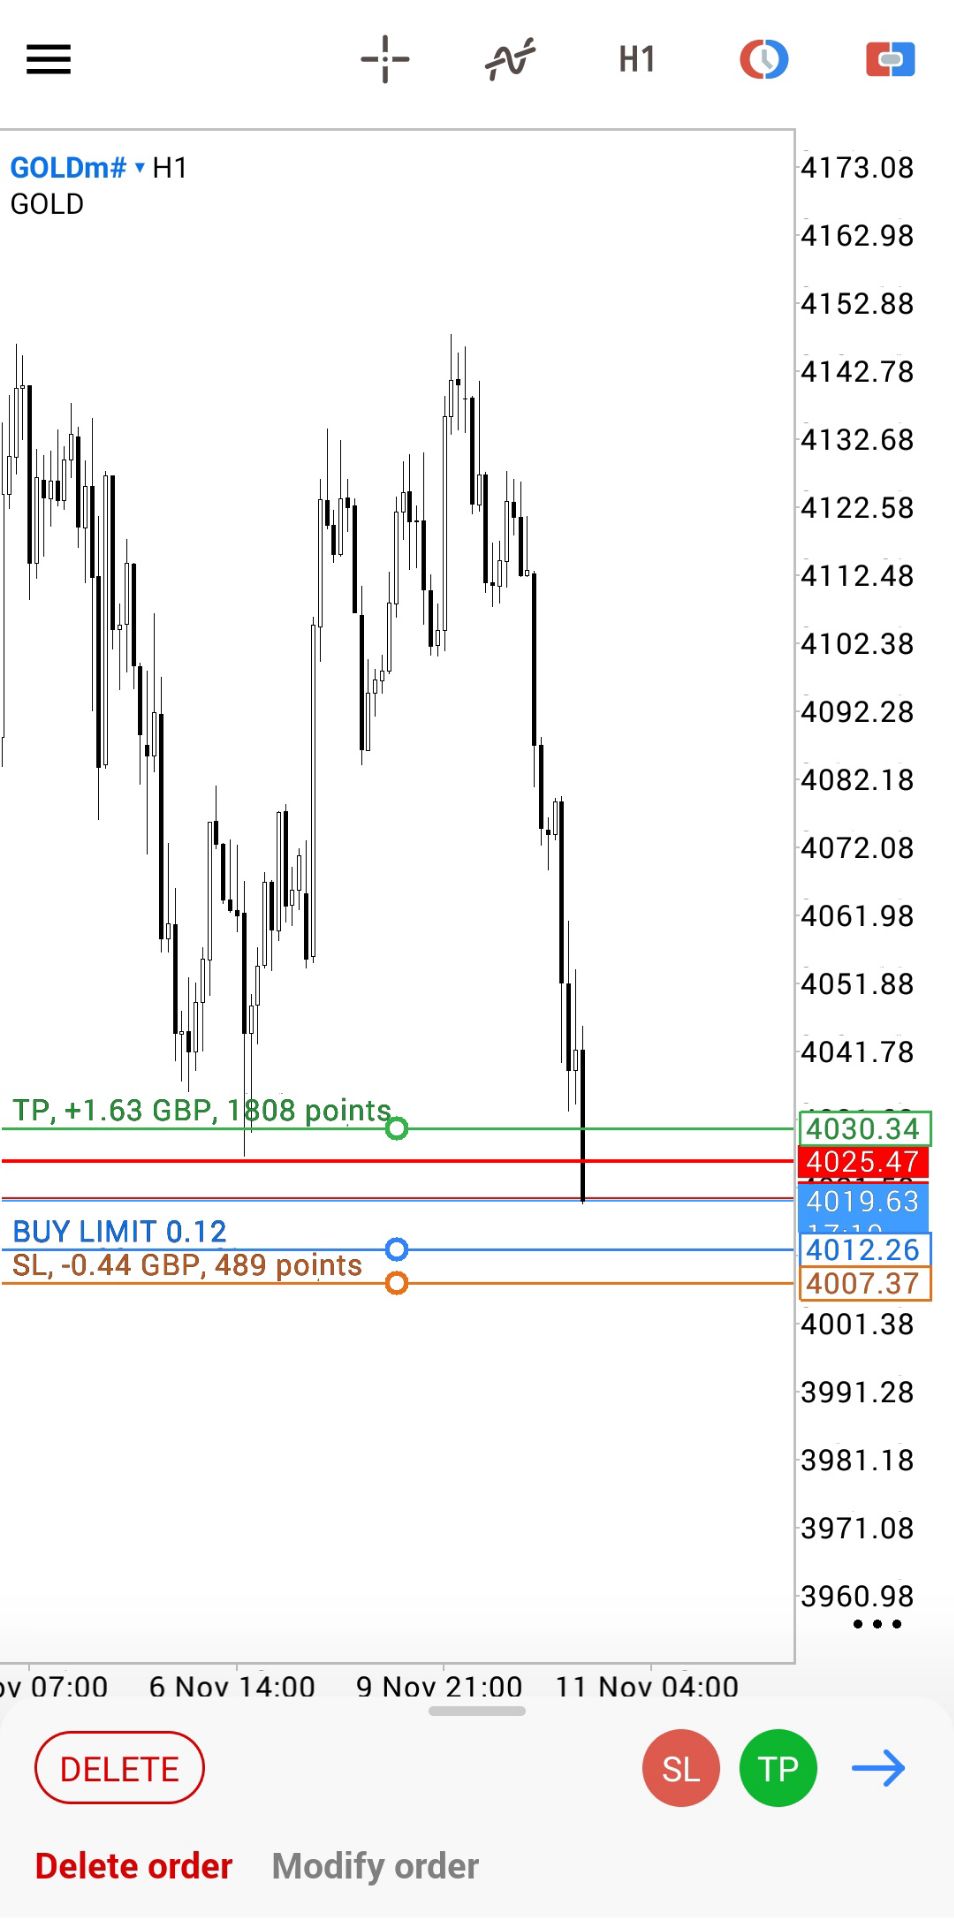
    below 4139 tgt was 4101/4080/4055/4019 3985
    low 4021🤣🤣🤣
    Nawhdir flag
    @EuroTraderTS.
    Nawhdir flag
    Sanjeev Ku flag
    4018 breaks aim 3958 gold cmp 4021. place sl 4067 and let the trade run
    Osaghae Cephas flag
    EuroTrader
    @NawhdirDon't go to sleep please because it will come to your dream and press you there
    @EuroTraderhow's ur eut trade going close too to right
    Osaghae Cephas flag
    EuroTrader
    @NawhdirHere cousin, EURUSD is just giving me some joy today
    @EuroTraderoH I can see it's giving u joyy😸👌
    Nawhdir flag
    @EuroTraderi wanna suicide
    Nawhdir flag
    Sanjeev Ku flag
    Sanjeev Ku
    below 4139 tgt was 4101/4080/4055/4019 3985
    4019.done. low 4018.28.
    Sanjeev Ku flag
    Sanjeev Ku
    4018 breaks aim 3958 gold cmp 4021. place sl 4067 and let the trade run
    4018 broken.
    Nawhdir flag
    market = gigolo.
    Jon Jony flag
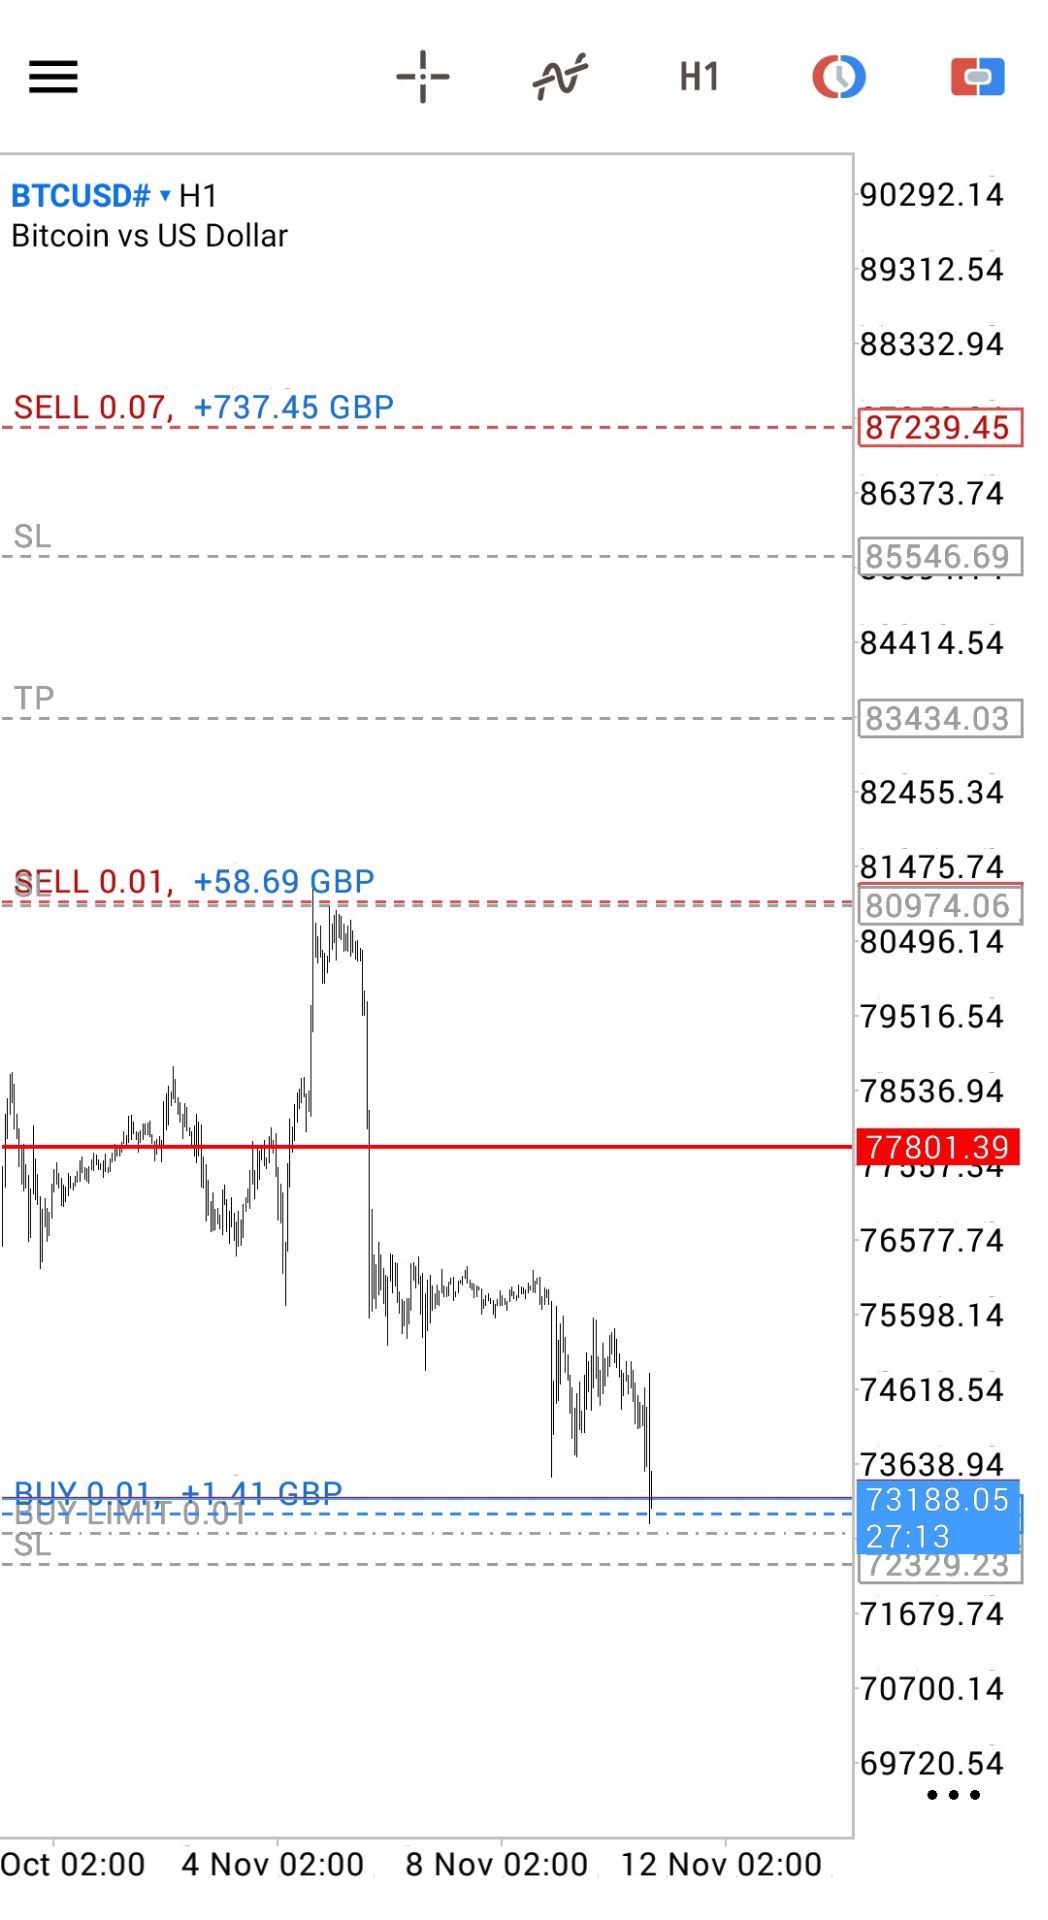
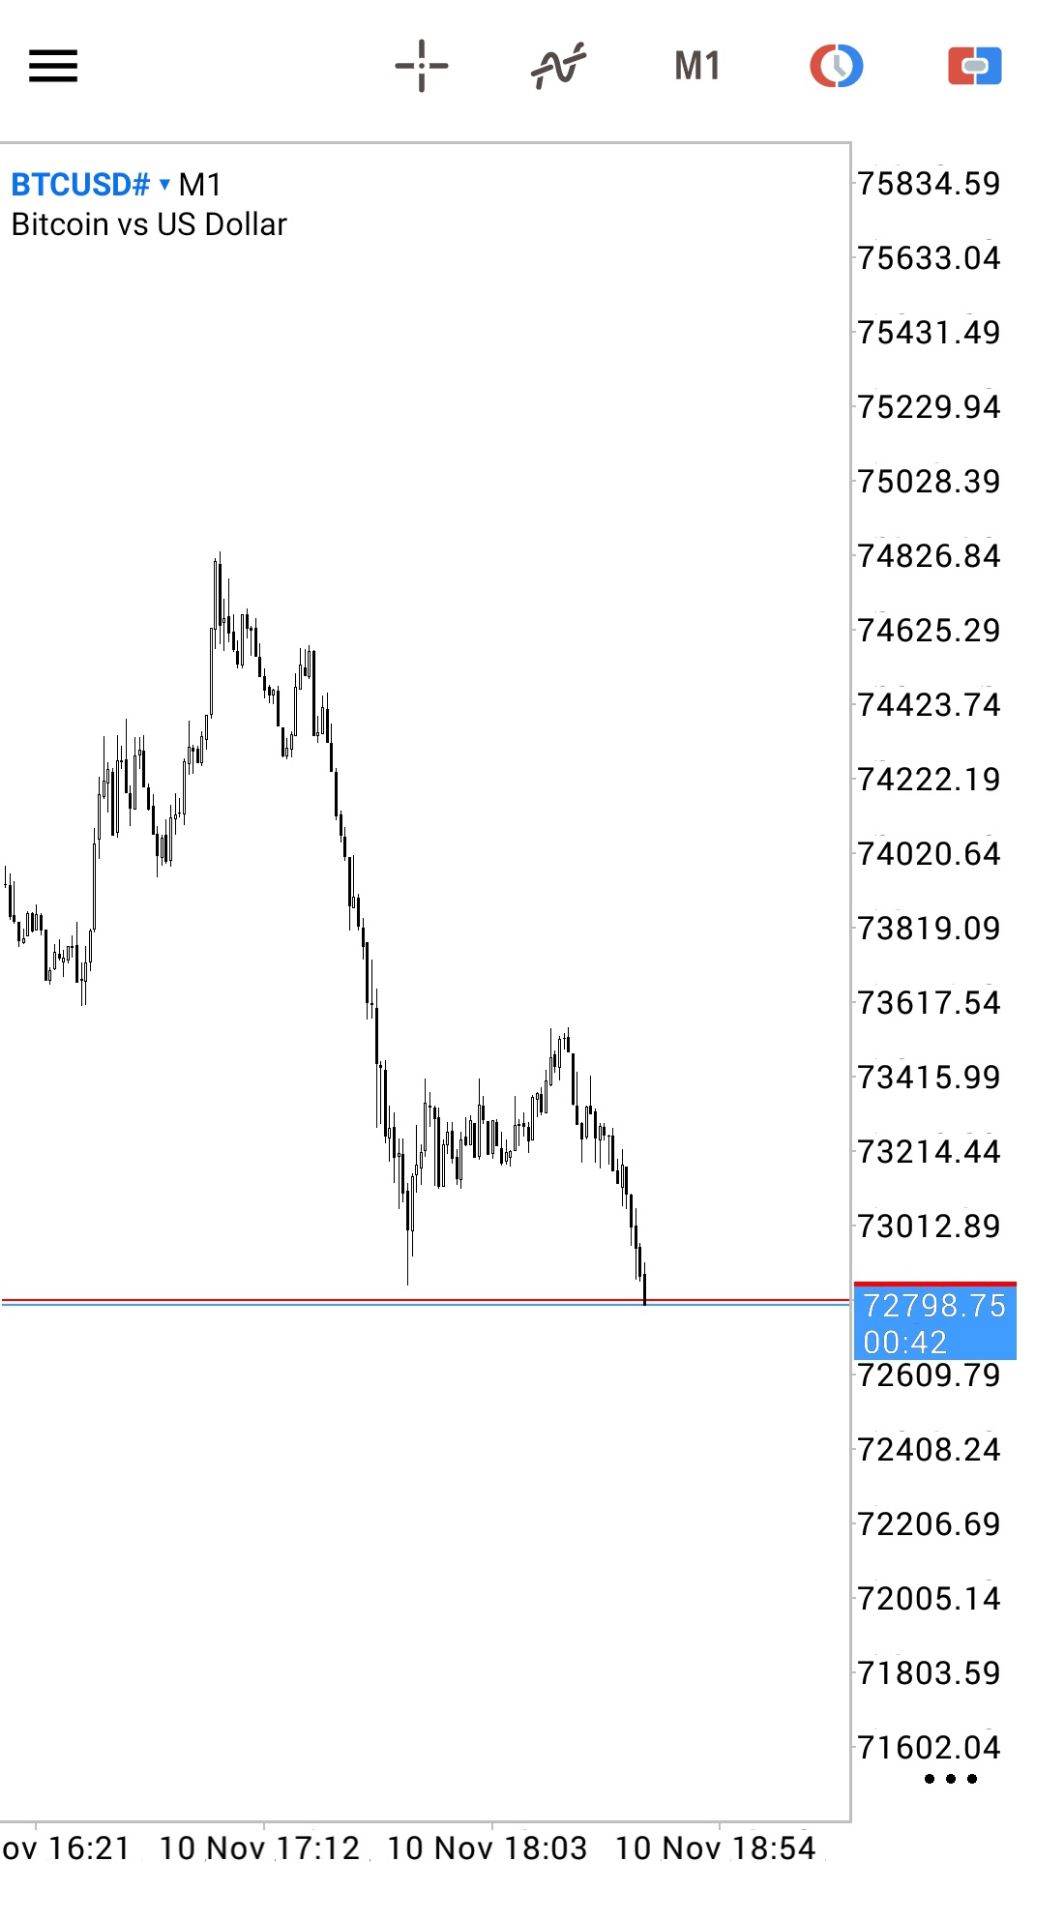
    красота btc
    Nawhdir flag
    suasana seimbang tepat. jadi nikmat jarum cokelat.
    Nawhdir flag
    Nawhdir flag
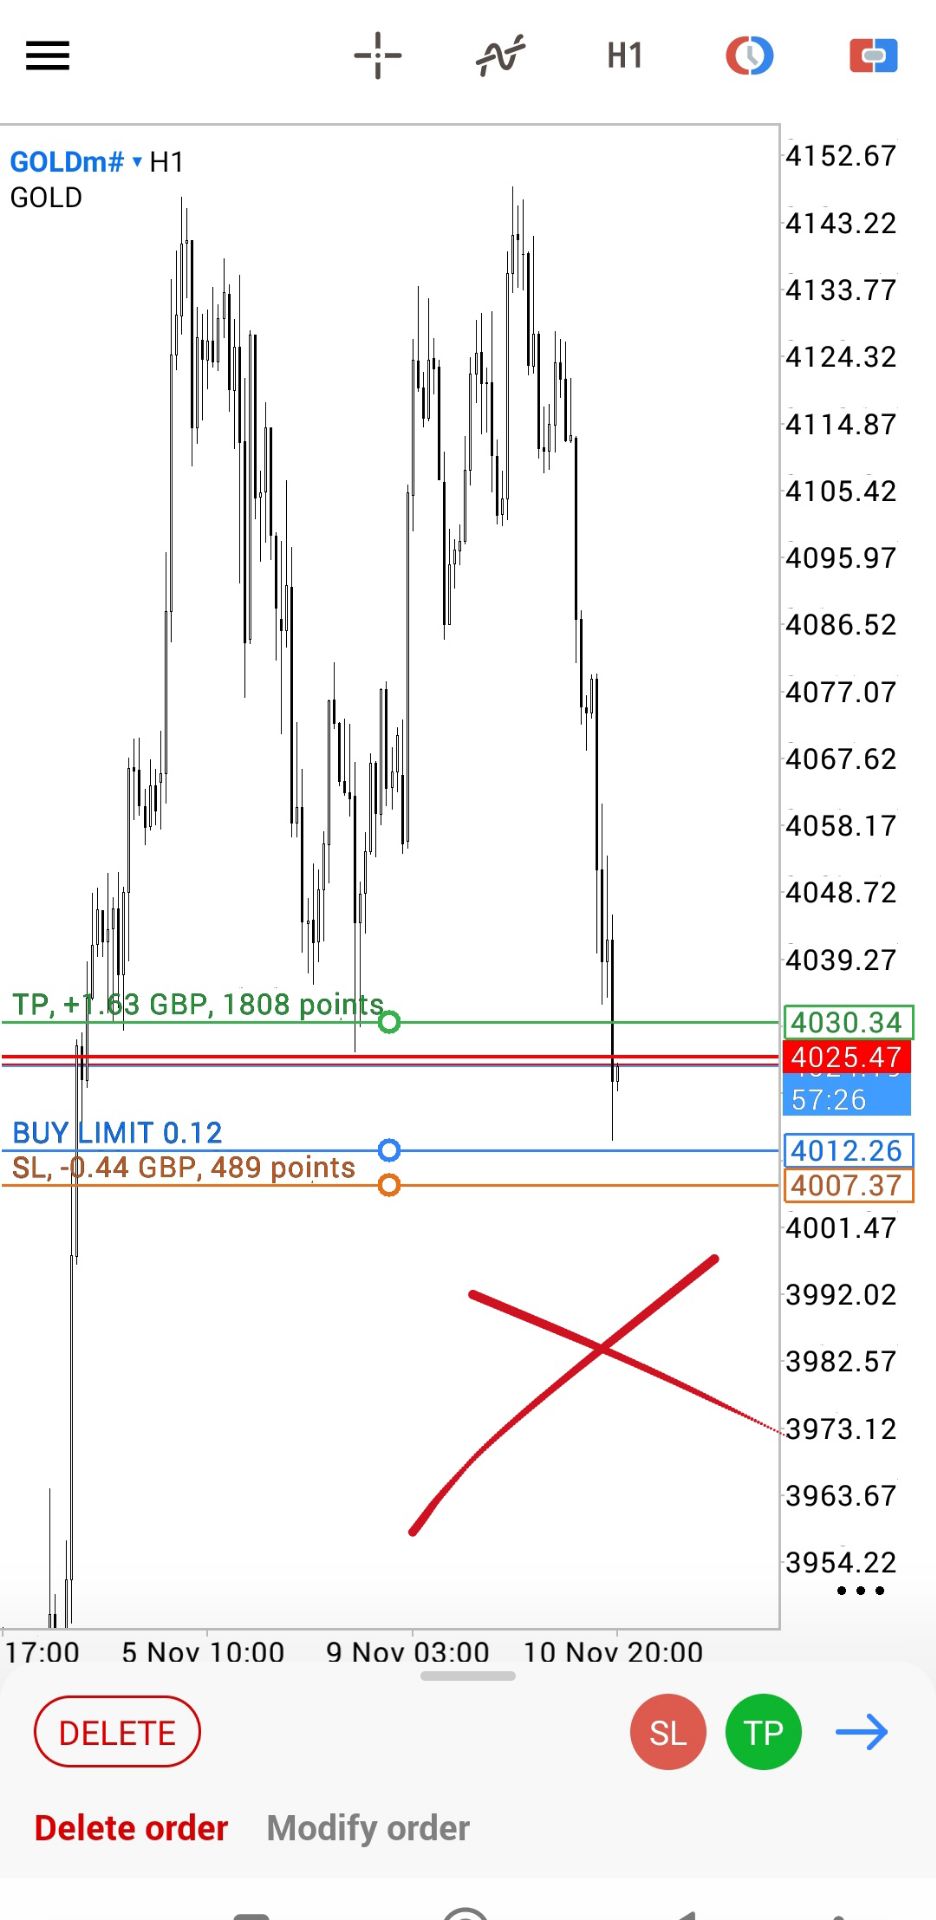
    delete. cancel.
    Nawhdir flag
    bastard y eshow.
    Type here...
    Add Symbol or Code

      No matching data

      All
      Recommend
      Stocks
      Cryptocurrencies
      Central Banks
      Trump Updates
      Featured News
      • All
      • Russia-Ukraine Conflict
      • Middle East Flashpoint
      • All
      • Russia-Ukraine Conflict
      • Middle East Flashpoint
      Search
      Products

      Charts Free Forever

      Chats Q&A with Experts
      Screeners Economic Calendar Data Tools
      Membership Features
      Data Warehouse Market Trends Institutional Data Policy Rates Macro

      Market Trends

      Market Sentiment Order Book Forex Correlations

      Top Indicators

      Charts Free Forever
      Markets

      News

      24/7 Analysis Education

      Latest Views

      Latest Update

      Signals

      Copy Rankings Latest Signals Become a signal provider AI Rating
      Contests
      Brokers

      Overview Brokers Assessment Rankings Regulators News Claims
      Broker listing Forex Brokers Comparison Tool Live Spread Comparison Scam
      Q&A Complaint Scam Alert Videos Tips to Detect Scam
      More

      Business
      Events
      Careers About Us Advertising Help Center

      White Label

      Broker API

      Data API

      Web Plug-ins

      Affiliate Program

      Awards Institution Evaluation IB Seminar Salon Event Exhibition
      Vietnam Thailand Singapore Dubai
      Fans Party Investment Sharing Session
      FastBull Summit BrokersView Expo
      Recent Searches
        Top Searches
          Markets
          Analysis
          User
          24/7
          Economic Calendar
          Education
          Data
          • Names
          • Latest
          • Prev

          View All

          No data

          Scan to Download

          Faster Charts, Chat Faster!

          Download
          English
          • English
          • Español
          • العربية
          • Bahasa Indonesia
          • Bahasa Melayu
          • Tiếng Việt
          • ภาษาไทย
          • Français
          • Italiano
          • Türkçe
          • Русский язык
          • 简中
          • 繁中
          Open Account
          Search
          Products
          Charts Free Forever
          Markets
          News
          Signals

          Copy Rankings Latest Signals Become a signal provider AI Rating
          Contests
          Brokers

          Overview Brokers Assessment Rankings Regulators News Claims
          Broker listing Forex Brokers Comparison Tool Live Spread Comparison Scam
          Q&A Complaint Scam Alert Videos Tips to Detect Scam
          More

          Business
          Events
          Careers About Us Advertising Help Center

          White Label

          Broker API

          Data API

          Web Plug-ins

          Affiliate Program

          Awards Institution Evaluation IB Seminar Salon Event Exhibition
          Vietnam Thailand Singapore Dubai
          Fans Party Investment Sharing Session
          FastBull Summit BrokersView Expo

          U.S. EIA Natural Gas Production Forecast For The Next Year (Nov)

          Add Alert
          Alert added

          Act:--

          Fcst:--

          Prev:--

          Release Time:

          Release Schedule:Monthly

          Data Source:U.S. Energy Information Administration (EIA)

          1 Year 2 Years 5 Years All
          RELEASE TIME ACT PREV FCST

          No data

          Impact

            4 Hours After Event
            • 4 Hours After Event
            • 1 Hour After Event
            • 30 Minutes After Event
            • 15 Minutes After Event
            • 5 Minutes After Event
            Actual < Forecast
            Probability of Rise: --
            Number of Rises: --
            Probability of Fall: --
            Number of Falls: --
            Avg. Volatility: --
            Actual = Forecast
            Probability of Rise: --
            Number of Rises: --
            Probability of Fall: --
            Number of Falls: --
            Avg. Volatility: --
            Actual > Forecast
            Probability of Rise: --
            Number of Rises: --
            Probability of Fall: --
            Number of Falls: --
            Avg. Volatility: --
            Price Chart

            No data

            Impact 4 Hours After Event

            No data

            Relevant Indicators

            No data

            Create Alert
            Create
            FastBull
            Copyright © 2026 FastBull Ltd

            728 RM B 7/F GEE LOK IND BLDG NO 34 HUNG TO RD KWUN TONG KLN HONG KONG

            TelegramInstagramTwitterfacebooklinkedin
            App Store Google Play Android Windows
            Products
            Charts

            Chats

            Q&A with Experts
            Screeners
            Economic Calendar
            Data
            Tools
            Membership
            Features
            Function
            Markets
            Copy Trading
            Latest Signals
            Contests
            24/7
            Analysis
            Education
            Company
            Careers
            About Us
            Contact Us
            Advertising
            Download FastBull
            Help Center
            Feedback
            User Agreement
            Privacy Policy
            Personal Information Protection Statement
            Business

            White Label

            Broker API

            Data API

            Web Plug-ins

            Poster Maker

            Affiliate Program

            Risk Disclosure

            The risk of loss in trading financial instruments such as stocks, FX, commodities, futures, bonds, ETFs and crypto can be substantial. You may sustain a total loss of the funds that you deposit with your broker. Therefore, you should carefully consider whether such trading is suitable for you in light of your circumstances and financial resources.

            No decision to invest should be made without thoroughly conducting due diligence by yourself or consulting with your financial advisors. Our web content might not suit you since we don't know your financial conditions and investment needs. Our financial information might have latency or contain inaccuracy, so you should be fully responsible for any of your trading and investment decisions. The company will not be responsible for your capital loss.

            Without getting permission from the website, you are not allowed to copy the website's graphics, texts, or trademarks. Intellectual property rights in the content or data incorporated into this website belong to its providers and exchange merchants.

            Not Logged In

            Log in to access more features

            Connect Broker
            Become a signal provider
            Help Center
            Customer Service
            Dark Mode
            Price Up/Down Colors

            Log In

            Sign Up

            Position
            Layout
            Fullscreen
            Default to Chart
            The chart page opens by default when you visit fastbull.com