


What Is Ichimoku Indicator? How to Trade Forex with It?
The Ichimoku Kinko Hyo indicator, also known as Ichimoku cloud, is often considered a highly complex looking indicator in forex trading especially for newbie traders. That's why many traders try to avoid using it. Nevertheless, it's one of the most common and useful indicators for Forex traders. In this article, we will explain the logic behind the indicator, its components, and how you can utilize the indicator in your trading strategy.
What Is Ichimoku Indicator?
The Ichimoku indicator or trading system is an abbreviation of "Ichimoku Kinko Hyo", developed by Japanese journalist Goichi Hosoda in the 1960s. This technique has been popular in Japan for quite some time, gaining popularity in other parts of the world as well.
The system combines a variety of indicators to create an overall picture of the market, thereby providing traders with high probability trading signals. The system was used primarily in the commodities and futures markets, but forex traders have recently discovered its usefulness in their medium.
The Ichimoku Hinko Hyo is a momentum indicatorused to recognize the direction of the trend. It can also define accurate support and resistance levels. It consists of five lines, which are the tenkan-sen, kijun-sen, senkou span A, senkou span B, and chikou span.
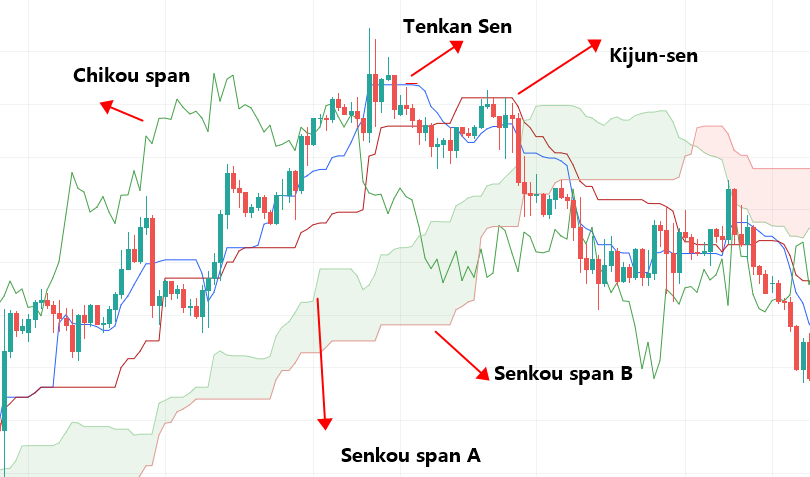
Tenkan Sen:
Tenkan Sen is a conversion line. Calculated as the middle price for the last 9 candlestick highs-lows. This is an important line in Ichimoku trading because it is an early indicator of the trend. There's no trend when this line is horizontal but once it takes a direction it is very likely that a trend has begun.
Kijun-sen:
Kijun-sen is a base line. If you want to calculate it, you need to add the highest high and the lowest low over the past 26 periods and divide it by two. This line has similar functions to the Tenkan-sen; at the same time, it can be implemented as a trailing stop-loss point.
Senkou span A:
This forms one of the edges of the Kuomo cloud and is the fastest moving line. Seen here crossing over the other; shifting the cloud at its squeezing point. It is calculated as a sum of the two sen lines, divided by two and then plotted 26 periods in advance.
The space between the two Senoku span lines is called the Kuomo cloud. This cloud changes shape — when the market trades in a horizontal range the cloud is thinner, and when the market is trendy the cloud widens. The stronger the trend the greater the cloud width.
Senkou span B:
You can calculate this line if you add the highest high and the lowest low, over the past 52 periods, divide the result by two and plot it 26 periods ahead. This line works together with the Senkou Span A and forms another edge of the cloud, which will determine future support and resistance areas.
Chikou span:
The chikou span, or delay line, represents closing prices for the previous 26 periods of price movement and is used to confirm trends from other lines. It is usually a green line and is also known as the lagging span.
How to Use Ichimoku Cloud Indicator in Trading?
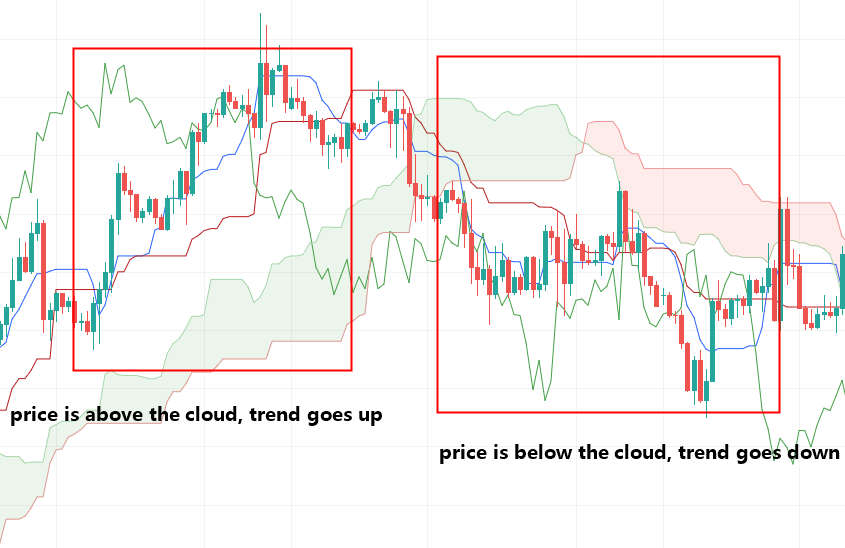
1. Up, down and Static Trends
By employing the Ichimoku trading strategy, you can see the relevant information about your trade at a glance, by using averages. The overall trend goes up when the price rises above the cloud. Conversely, the trend goes down when the price falls below the cloud. However, when the price stays in its position in the cloud, the trend or transition ceases to exist.
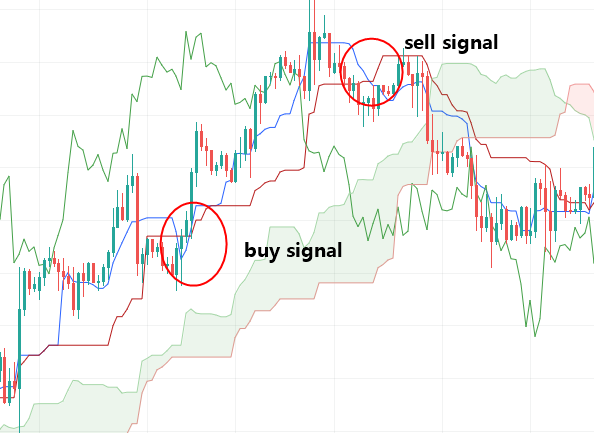
2. Confirming the trend
Since the Ichimoku is a trend indicator, it is most effective in trending markets. The tenkan sen and the kijun sen are both moving averages. One of the most popular strategies offered by normal moving averages is the crossover. This is the primary Ichimoku trading strategy of these two lines and of the leading indicator. When the tenkan sen crosses over the kijun sen, this is a signal to open a buy position. Conversely, when the tenkan sen crosses below the kijun sen, this is a signal to open a sell position.
At the same time, when a trend is established, it is typically assigned a colour. So, if Senkou span A rises above Senkou span B, the uptrend is said to be confirmed, and the space between the lines can be seen coloured in green. Conversely, if Senkou span A falls below Senkou span B, it establishes a downtrend, with the space between the lines being coloured in red.
3. The support and resistance aspect
When price is below the Cloud, it reinforces the downtrend and vice versa. During strong trends, the Cloud also acts as support and resistance boundaries. Thus, the Cloud is ideal when it comes to filtering between bullish and bearish market phases. However, as most momentum indicators, the Ichimoku Cloud loses its validity during range markets.
Limitations of Ichimoku Cloud
The success of the Ichimoku trading system among investors could be attributed to its rather unfamiliar and intriguing nature, as so far, its performance is yet to be proven.
The indicators used by Ichimoku are somewhat complex compared to traditional technical indicators, but they work in the same way. Indeed, like any technical indicator, it is just a visual representation of information already included in the chart.
The next mistake you can meet while using the indicator is the wrong confirmation. Ichimoku Kinko Hyo has many functions – it can confirm the trend, determine the momentum, help place support and resistance levels, and give buy/sell signals. To confirm the signal, you need to find a proper additional indicator. Sometimes, traders don’t know functions of other indicators. Thus, they don't get any confirmation or get the wrong one.
Conclusion
Although Ichimoku looks rather complicated at first, once you learn to understand its patterns, it can be very useful, combining several indicators to form an overall picture of the market at a glance. All you need to do is find proper colors for each line and learn what signals the lines provide. In the beginning, you can simply save the part of our article where we talk about lines' functions and use this part while trading.
Hottest

Copyright © 2026 FastBull Ltd


Risk Warning
FX trading is of high risk and may not be suitable for all investors. Leverage will create additional risks and loss. Before trading, please carefully consider your investment objectives, experience level and risk tolerance. You may lose part or all of your initial investment; do not invest money that you cannot afford. Educate yourself about the risks associated with FX trading. If you have any questions, please consult an independent financial or tax advisor. Any data and information are provided "as is" and only for information purpose, not for trading or recommendations. Past performance does not predict future results.
Disclaimer
The data contained in this website may not be real-time and accurate. The data and prices on this site are not necessarily provided by the market or exchange, but may be provided by market makers, so prices may be inaccurate and differ from actual market prices. Namely, this price is indicative price only to reflect market trend, and is unfavorable for trading purpose. The provider of the data contained in the Website shall not be liable for any loss incurred by you as a result of your trading activities or reliance on the information contained in the Website.