


How to Use Bollinger Bands Strategy in Forex Trading

Bollinger Bands are commonly used by technical traders in all financial markets including forex. They are a type of technical analysis tool that is plotted on a statistical chart. This tool was introduced and developed by John Bollinger in the 1980s. In this article, we will introduce how Bollinger Bands assist traders in technical analysis and also provide an overview of top strategies and tips for trading forex with Bollinger Bands.
What Are Bollinger Bands
Bollinger Bands are a popular technical analysis tool that indicates whether an instrument's price is high or low on a relative basis. Bollinger Bands can be applied to a variety of different financial instruments. These include indices, currencies and stocks.
Bollinger Bands consist of three bands – an upper, middle and lower band – that are used to spot extreme short-term prices in a security. The upper band represents overbought territory, while the lower band can show you when a security is oversold. The upper and lower bands are two standard deviation values (usually from a 20-day simple moving average), and the center line is the prices simple moving average.
As a technical analysis tool, Bollinger Bands show when an instrument is in overbought or oversold territory. If the instrument's price moves towards the upper band, this is usually a signal that it is overbought. If the price moves towards the lower band, this usually signals that it is oversold.
They can also be used to assess volatility. During calm trading periods, the bands will narrow. When price movements are volatile, the bands will widen. Most technicians will use Bollinger Bands in conjunction with other analysis tools to get a better picture of the current state of a market or security.
How to use Bollinger Bands
1. Trading the trend
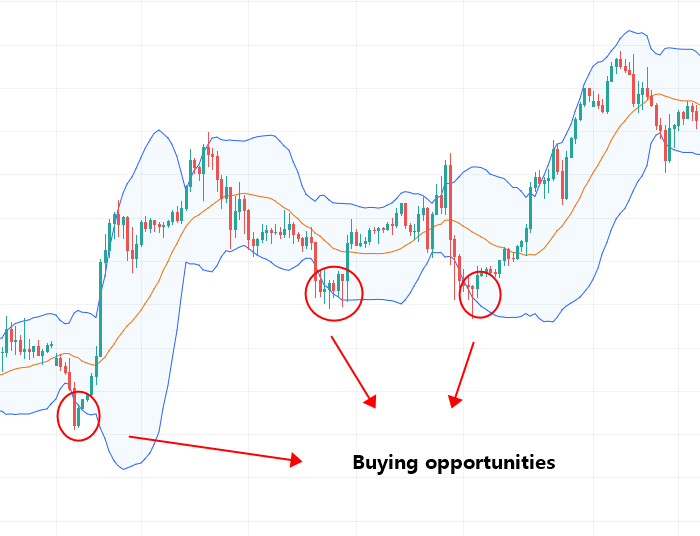
Traders can identify entry signals using the bands as a measure of support and resistance. As the price reaches the upper band, the asset is considered overbought since it is trading at a relatively high price. This condition generates a bearish signal amid expectations that the price will retreat toward the moving average, therefore you should in general exit all long positions and go short.
Conversely, when the price approaches the lower band, the asset is considered oversold since it is trading at a relatively low price compared to its recent average. This logically is deemed a bullish signal because the price will likely rebound and retrace back to the moving average. The most logical action here is to close your short positions and place long orders.
Trying to identify and follow strong trends is the simplest of Bollinger Bands' trading methods. The chart below shows the EUR/USD chart in an uptrend – depicted by higher highs and higher lows. Using the Bollinger Band indicator, the lower band is seen as a gauge of support. When price touches the lower band, traders use this as a signal to enter a long (buy) trade. This strategy works for both uptrends and downtrends. Take profit (limit) levels are generally taken from the upper and lower bands depending on trend. In this example, the upper band will be used as the take profit level.
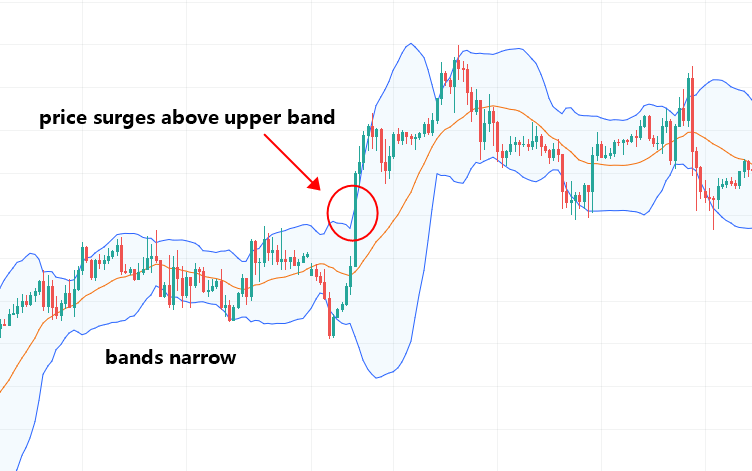
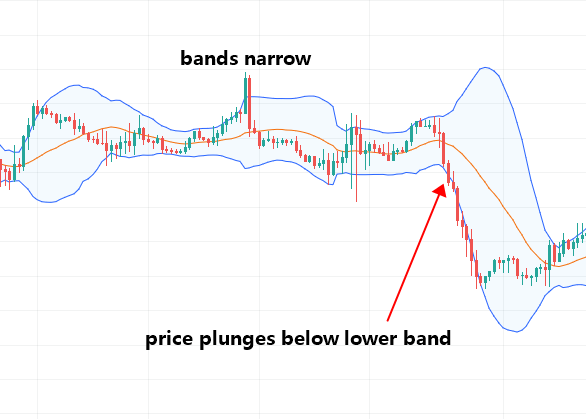
2. Bollinger Bands Squeeze Strategy
The Bollinger Band Squeeze occurs when volatility falls to low levels and the Bollinger Bands narrow. The reason behind this phenomenon is that as mentioned before, the distance between the outer Bollinger bands is dependent upon the standard deviation, consequently, when markets become less volatile the bands start to narrow, this is called a Squeeze.
According to John Bollinger, periods of low volatility are often followed by periods of high volatility. Therefore, a volatility contraction or narrowing of the bands can foreshadow a significant advance or decline.
Once the squeeze play is on, a subsequent band break signals the start of a new move. A new advance starts with a squeeze and subsequent break above the upper band. A new decline starts with a squeeze and subsequent break below the lower band. We can see the examples below:
Limitations of Bollinger Bands Strategies
Bollinger Bands are an effective technical analysis indicator, however, they do have limitations. Bollinger Bands are based on an instrument's simple moving average, which uses past data points. As a result, the bands will always react to price moves, and not forecast them. In other words, Bollinger Bands are reactive, not predictive.
Another limitation is that Bollinger Bands cannot be considered as a standalone technical analysis tool. They were designed with the aim of giving traders information about price volatility. It is, therefore, best to use them along with two or three other independent indicators, so that you can get more specific market signals. Indicators that use different types of data include on-balance volume and Relative Strength Index (RSI).
Lastly, the use of a 20-day simple moving average and two standard deviations is a little arbitrary and may not necessarily be useful in every situation. So, it is wise to make suitable adjustments to your SMA and standard deviation values and monitor them regularly.
Conclusion
Bollinger Bands can be a useful tool for traders in assessing the volatility of their position, providing them with insight on when to enter and exit a position. For forex traders, certain aspects of Bollinger Bands, such as the Squeeze, work well for currency trading, as does adding a second set of Bollinger Bands. Using this tool correctly can help investors and traders make better decisions and hopefully earn profits.

Hottest


Copyright © 2026 FastBull Ltd


Risk Warning
FX trading is of high risk and may not be suitable for all investors. Leverage will create additional risks and loss. Before trading, please carefully consider your investment objectives, experience level and risk tolerance. You may lose part or all of your initial investment; do not invest money that you cannot afford. Educate yourself about the risks associated with FX trading. If you have any questions, please consult an independent financial or tax advisor. Any data and information are provided "as is" and only for information purpose, not for trading or recommendations. Past performance does not predict future results.
Disclaimer
The data contained in this website may not be real-time and accurate. The data and prices on this site are not necessarily provided by the market or exchange, but may be provided by market makers, so prices may be inaccurate and differ from actual market prices. Namely, this price is indicative price only to reflect market trend, and is unfavorable for trading purpose. The provider of the data contained in the Website shall not be liable for any loss incurred by you as a result of your trading activities or reliance on the information contained in the Website.