• Trade
  • Markets
  • Copy
  • Contests
  • 24/7
  • Calendar
  • Q&A
  • Chats
Screeners
SYMBOL
LAST
BID
ASK
HIGH
LOW
NET CHG.
%CHG.
SPREAD
SOURCE
SPX
S&P 500 Index
7353.73
7353.73
7353.73
7681.29
7350.35
-334.89
-4.36%
--
--
DJI
Dow Jones Industrial Average
51523.06
51523.06
51523.06
53710.61
51486.82
-1833.06
-3.44%
--
--
IXIC
NASDAQ Composite Index
24315.01
24315.01
24315.01
25559.03
24262.14
-1421.52
-5.52%
--
--
USDX
US Dollar Index
101.508
101.508
101.588
101.530
101.402
+0.053
+ 0.05%
--
--
EURUSD
Euro / US Dollar
1.12095
1.12095
1.12104
1.12343
1.12080
-0.00080
-0.07%
--
--
GBPUSD
Pound Sterling / US Dollar
1.34460
1.34460
1.34473
1.34631
1.34408
-0.00022
-0.02%
--
--
XAUUSD
Gold / US Dollar
4065.91
4065.91
4066.30
4106.77
4056.48
-22.57
-0.55%
--
--
WTI
Light Sweet Crude Oil
90.536
90.536
90.571
90.730
89.894
+0.347
+ 0.38%
--
--

Community Accounts

Signal Accounts
--
Profit Accounts
--
Loss Accounts
--
View More

Become a signal provider

Sell trading signals to earn additional income

View More

Guide to Copy Trading

Get started with ease and confidence

View More

Signal Accounts for Members

All Signal Accounts

Best Return
  • Best Return
  • Best P/L
  • Best MDD
Past 1W
  • Past 1W
  • Past 1M
  • Past 1Y

All Contests

  • All
  • Recommend
  • Stocks
  • Cryptocurrencies
  • Central Banks
  • Trump Updates
  • Featured News
Top News Only
Share

The Main Lithium Carbonate Futures Contract Rose 3% Intraday, Currently Trading At 93,540.00 Yuan

Share

The Philippines Revised Its Second-quarter GDP Growth Rate To 2.4% Year-on-Year

Share

The Main Lithium Carbonate Futures Contract Rose By 2.00% Intraday, Currently Trading At 92,660 Yuan/ton

Share

The Most Active Japanese Rubber Futures Contract Fell 2.00% On The Day, Currently Trading At 416.20 Yen Per Kilogram

Share

The Most Active Liquefied Petroleum Gas (LPG) Futures Contract Fell 5% Intraday, Currently Trading At 6644.00 Yuan

Share

Apple Futures Contracts Rose 5% Intraday, Currently Trading At 5974.00 Yuan

Share

Spot Gold Fell Below $4,060 Per Ounce, Down 0.74% On The Day

Share

The Yield On Japan's 5-year Government Bonds Fell 10.5 Basis Points To 2.085%

Share

New York Gold Futures Fell Below $4,080 Per Ounce, Down 0.83% On The Day

Share

Spot Gold Fell Below $4,070 Per Ounce, Down 0.48% On The Day

Share

The Main Butadiene Rubber Futures Contract Fell By 2.00% During The Day, Currently Trading At 15,340 Yuan/ton

Share

The Most Active Benzene Futures Contract Fell 4% Intraday, Currently Trading At 7905.00 Yuan

Share

China's Central Bank Withdrew A Net 52 Billion Yuan From The Open Market Today

Share

China's Central Bank Announced Today That It Conducted 226 Billion Yuan Of Overnight Reverse Repurchase Operations, With Both The Bid And Winning Bids Amounting To 226 Billion Yuan. The Operating Rate Was 1.25%

Share

The Most Active Palm Oil Futures Contract Fell 2.00% Intraday, Currently Trading At 8709.00 Yuan/ton

Share

The Central Parity Rate Of The RMB Against The US Dollar Was 6.7168 Yuan

Share

The MSCI Asia Pacific Index Fell 4.8% To 243.23 Points

Share

Apple Futures Contracts Surged 4.00% Intraday, Currently Trading At 5917.00 Yuan/ton

Share

The Main Rubber Futures Contract Fell 2.00% Intraday, Currently Trading At 18,560.00 Yuan/ton. The Main TSR20 Rubber Futures Contract Fell More Than 2.00% Intraday, Currently Trading At 15,685.00 Yuan/ton

Share

The Main Rapeseed Oil Futures Contract Fell By 2.00% During The Day, Currently Trading At 9854.00 Yuan/ton

TIME
ACT
FCST
PREV
IMPACT
Germany Construction PMI (SA) (Oct)

A:--

F: --

P: --

EURUSD
  • EURUSD
  • XAUUSD
  • XAGUSD
  • WTI
  • USDX
Italy Retail Sales MoM (SA) (Sept)

A:--

F: --

P: --

EURUSD
  • EURUSD
  • XAUUSD
  • XAGUSD
  • WTI
  • USDX
U.K. Markit/CIPS Construction PMI (Oct)

A:--

F: --

P: --

GBPUSD
  • GBPUSD
  • XAUUSD
  • XAGUSD
  • WTI
  • USDX
Euro Zone PPI YoY (Sept)

A:--

F: --

P: --
EURUSD
  • EURUSD
  • XAUUSD
  • XAGUSD
  • WTI
  • USDX
Euro Zone PPI MoM (Sept)

A:--

F: --

P: --
EURUSD
  • EURUSD
  • XAUUSD
  • XAGUSD
  • WTI
  • USDX
France 10-Year OAT Auction Avg. Yield

A:--

F: --

P: --

EURUSD
  • EURUSD
  • XAUUSD
  • XAGUSD
  • WTI
  • USDX
U.S. Challenger Job Cuts YoY (Oct)

A:--

F: --

P: --

USDX
  • USDX
  • XAUUSD
  • XAGUSD
  • WTI
U.S. Challenger Job Cuts (Oct)

A:--

F: --

P: --

USDX
  • USDX
  • XAUUSD
  • XAGUSD
  • WTI
U.S. Challenger Job Cuts MoM (Oct)

A:--

F: --

P: --

USDX
  • USDX
  • XAUUSD
  • XAGUSD
  • WTI
Mexico Consumer Confidence Index (Oct)

A:--

F: --

P: --

XAUUSD
  • XAUUSD
  • XAGUSD
  • WTI
  • USDX
U.K. BOE MPC Vote Unchanged

A:--

F: --

P: --

GBPUSD
  • GBPUSD
  • XAUUSD
  • XAGUSD
  • WTI
  • USDX
U.K. BOE MPC Vote Hike

A:--

F: --

P: --

GBPUSD
  • GBPUSD
  • XAUUSD
  • XAGUSD
  • WTI
  • USDX
U.K. Benchmark Interest Rate

A:--

F: --

P: --

GBPUSD
  • GBPUSD
  • XAUUSD
  • XAGUSD
  • WTI
  • USDX
U.K. BOE MPC Vote Cut

A:--

F: --

P: --

GBPUSD
  • GBPUSD
  • XAUUSD
  • XAGUSD
  • WTI
  • USDX
MPC Rate Statement
Bank of England Governor Bailey held a press conference on monetary policy.
Brazil IHS Markit Services PMI (Oct)

A:--

F: --

P: --

XAUUSD
  • XAUUSD
  • XAGUSD
  • WTI
  • USDX
Brazil IHS Markit Composite PMI (Oct)

A:--

F: --

P: --

XAUUSD
  • XAUUSD
  • XAGUSD
  • WTI
  • USDX
U.S. Weekly Initial Jobless Claims (SA)

A:--

F: --

P: --
XAUUSD
  • XAUUSD
  • XAGUSD
  • WTI
  • USDX
U.S. Weekly Continued Jobless Claims (SA)

A:--

F: --

P: --
XAUUSD
  • XAUUSD
  • XAGUSD
  • WTI
  • USDX
U.S. Initial Jobless Claims 4-Week Avg. (SA)

A:--

F: --

P: --
XAUUSD
  • XAUUSD
  • XAGUSD
  • WTI
  • USDX
FOMC Member Hammack Speaks
Richmond Federal Reserve President Barkin delivered a speech.
ECB President Lagarde Speaks
U.S. EIA Weekly Natural Gas Stocks Change

A:--

F: --

P: --

WTI
  • WTI
  • XAUUSD
  • XAGUSD
  • USDX
Bank of Canada Governor Macklem and Senior Deputy Governor Rogers testified before a Senate committee.
ECB Chief Economist Lane Speaks
ECB President Lagarde Speaks
Mexico Policy Interest Rate

A:--

F: --

P: --

XAUUSD
  • XAUUSD
  • XAGUSD
  • WTI
  • USDX
U.S. Weekly Treasuries Held by Foreign Central Banks

A:--

F: --

P: --

USDX
  • USDX
  • XAUUSD
  • XAGUSD
  • WTI
Japan Wages MoM (Sept)

A:--

F: --

P: --

USDJPY
  • USDJPY
  • XAUUSD
  • XAGUSD
  • WTI
Germany Industrial Output MoM (SA) (Sept)

--

F: --

P: --

U.K. Halifax House Price Index YoY (SA) (Oct)

--

F: --

P: --

U.K. Halifax House Price Index MoM (SA) (Oct)

--

F: --

P: --

France Trade Balance (SA) (Sept)

--

F: --

P: --

New York Fed President Williams and ECB Chief Economist Lane participated in discussions at the 2026 ECB Monetary Markets Conference.
Euro Zone Retail Sales YoY (Sept)

--

F: --

P: --

Euro Zone Retail Sales MoM (Sept)

--

F: --

P: --

India Deposit Gowth YoY

--

F: --

P: --

Canada Employment (SA) (Oct)

--

F: --

P: --

Canada Full-time Employment (SA) (Oct)

--

F: --

P: --

Canada Part-Time Employment (SA) (Oct)

--

F: --

P: --

U.S. Government Employment (Oct)

--

F: --

P: --

U.S. U6 Unemployment Rate (SA) (Oct)

--

F: --

P: --

U.S. Manufacturing Employment (SA) (Oct)

--

F: --

P: --

U.S. Average Hourly Wage YoY (Oct)

--

F: --

P: --

U.S. Average Hourly Wage MoM (SA) (Oct)

--

F: --

P: --

U.S. Unemployment Rate (SA) (Oct)

--

F: --

P: --

U.S. Nonfarm Payrolls (SA) (Oct)

--

F: --

P: --

Canada Unemployment Rate (SA) (Oct)

--

F: --

P: --

Canada Labor Force Participation Rate (SA) (Oct)

--

F: --

P: --

U.S. Average Weekly Working Hours (SA) (Oct)

--

F: --

P: --

U.S. Private Nonfarm Payrolls (SA) (Oct)

--

F: --

P: --

U.S. Labor Force Participation Rate (SA) (Oct)

--

F: --

P: --

U.S. 5-10 Year-Ahead Inflation Expectations (Nov)

--

F: --

P: --

Canada Ivey PMI (Not SA) (Oct)

--

F: --

P: --

Canada Ivey PMI (SA) (Oct)

--

F: --

P: --

U.S. UMich Current Economic Conditions Index Prelim (Nov)

--

F: --

P: --

U.S. UMich Consumer Expectations Index Prelim (Nov)

--

F: --

P: --

U.S. UMich 1-Year-Ahead Inflation Expectations Prelim (Nov)

--

F: --

P: --

U.S. UMich Consumer Sentiment Index Prelim (Nov)

--

F: --

P: --

Q&A with Experts
    • All
    • Chatrooms
    • Groups
    • Friends
    Osaghae Cephas flag
    EuroTrader
    @Osaghae Cephasje said the guy to deliver the 58$ to you is stalling? Ia that what he says
    @EuroTraderyes but don't know if it's up to 58 or more than though..
    Osaghae Cephas flag
    EuroTrader
    @Osaghae Cephastear lot size after what happened before. Haha ba..No tearing lot size again
    @EuroTraderboo I meant if u tear lot size for the previous one? because if u used 0.01 you wouldn't lost up too 20$
    "Osaghae Cephas" recalled a message
    B&W flag
    mohon signal emas
    fan land flag
    short
    fan land flag
    till 4070
    5367022 flag
    2 tp 4037
    1999kk.king flag
    Btcusd 76150
    1999kk.king flag
    Buy
    1999kk.king flag
    Sl75200
    1999kk.king flag
    Tp77777
    Hanae Hana flag
    مادا يفعل الدهب
    1999kk.king flag
    4065------4068.buy
    1999kk.king flag
    Buy
    1999kk.king flag
    Sl 4058
    2460732 flag
    Hi Guys Are we selling gold or buying from this levels.?
    1999kk.king flag
    ‵入场
    1999kk.king flag
    开倉入场
    1999kk.king flag
    1999kk.king flag
    Type here...
    Add Symbol or Code

      No matching data

      All
      Recommend
      Stocks
      Cryptocurrencies
      Central Banks
      Trump Updates
      Featured News
      • All
      • Russia-Ukraine Conflict
      • Middle East Flashpoint
      • All
      • Russia-Ukraine Conflict
      • Middle East Flashpoint

      Search
      Products

      Charts Free Forever

      Chats Q&A with Experts
      Screeners Economic Calendar Data Tools
      Membership Features
      Data Warehouse Market Trends Institutional Data Policy Rates Macro

      Market Trends

      Market Sentiment Order Book Forex Correlations

      Top Indicators

      Charts Free Forever
      Markets

      News

      24/7 Analysis Education

      Latest Views

      Latest Update

      Signals

      Copy Rankings Latest Signals Become a signal provider AI Rating
      Contests
      Brokers

      Overview Brokers Assessment Rankings Regulators News Claims
      Broker listing Forex Brokers Comparison Tool Live Spread Comparison Scam
      Q&A Complaint Scam Alert Videos Tips to Detect Scam
      More

      Business
      Events
      Careers About Us Advertising Help Center

      White Label

      Broker API

      Data API

      Web Plug-ins

      Affiliate Program

      Awards Institution Evaluation IB Seminar Salon Event Exhibition
      Vietnam Thailand Singapore Dubai
      Fans Party Investment Sharing Session
      FastBull Summit BrokersView Expo
      Recent Searches
        Top Searches
          Markets
          Analysis
          User
          24/7
          Economic Calendar
          Education
          Data
          • Names
          • Latest
          • Prev

          View All

          No data

          Scan to Download

          Faster Charts, Chat Faster!

          Download
          English
          • English
          • Español
          • العربية
          • Bahasa Indonesia
          • Bahasa Melayu
          • Tiếng Việt
          • ภาษาไทย
          • Français
          • Italiano
          • Türkçe
          • Русский язык
          • 简中
          • 繁中
          Open Account
          Search
          Products
          Charts Free Forever
          Markets
          News
          Signals

          Copy Rankings Latest Signals Become a signal provider AI Rating
          Contests
          Brokers

          Overview Brokers Assessment Rankings Regulators News Claims
          Broker listing Forex Brokers Comparison Tool Live Spread Comparison Scam
          Q&A Complaint Scam Alert Videos Tips to Detect Scam
          More

          Business
          Events
          Careers About Us Advertising Help Center

          White Label

          Broker API

          Data API

          Web Plug-ins

          Affiliate Program

          Awards Institution Evaluation IB Seminar Salon Event Exhibition
          Vietnam Thailand Singapore Dubai
          Fans Party Investment Sharing Session
          FastBull Summit BrokersView Expo

          GBP/JPY Faces a Critical Breakdown Attempt at 212.50: Can Yen Strength Push Sterling Lower?

          Gerik

          Forex

          Summary:

          GBP/JPY is experiencing renewed selling pressure after struggling to sustain its recovery above the 213.40–213.50 resistance region. The pair recently retreated towards 212.67, reflecting growing hesitation among buyers following several sessions of upward movement...

          SELL GBPJPY
          EXP
          TRADING

          212.500

          Entry Price

          211.500

          TP

          213.350

          SL

          212.275 +0.207 +0.10%

          0.0

          Pips

          Flat

          211.500

          TP

          Exit Price

          212.500

          Entry Price

          213.350

          SL
          Market Overview

          GBP/JPY has demonstrated considerable volatility during the first week of November. Following its recovery from approximately 206.85, the pair advanced towards 213.50, reflecting renewed demand for sterling and relatively weak yen performance. However, the latest price action suggests that bullish momentum is encountering increasing resistance. Market data recorded GBP/JPY around 212.67 on 5 November, approximately 0.30% lower over the preceding 24 hours.

          One important development is the Bank of England's monetary policy decision on 5 November. The decision and accompanying policy communication could influence sterling through changing expectations surrounding future interest rates. If policymakers signal a more cautious economic outlook, sterling could lose support, particularly after its recent appreciation against the yen.
          On the Japanese side, attention remains focused on monetary normalisation and the possibility of further policy tightening by the Bank of Japan. Any indication that Japanese authorities are becoming less comfortable with yen depreciation could encourage investors to reduce carry-trade exposure. This is particularly relevant for GBP/JPY because the pair has benefited from the substantial interest-rate differential between the United Kingdom and Japan.
          Nevertheless, the broader technical structure should not be ignored. ActionForex maintains an upside intraday bias while GBP/JPY holds above 211.53, with a potential extension towards 217.45. Therefore, the SELL position at 212.50 should be approached as a short-term corrective trade rather than confirmation of a major bearish reversal.

          Market Sentiment

          Market sentiment is becoming increasingly divided between buyers attempting to extend the recovery and sellers defending the 213.00–213.50 region. The recent inability to sustain prices near 213.50 suggests that investors are becoming more selective about chasing sterling higher.
          An interesting development is the divergence between the pair's broader bullish structure and its weaker short-term momentum. GBP/JPY remains approximately 1.1% higher over the week, yet recent intraday movements indicate increasing difficulty maintaining upward momentum. This creates conditions in which profit-taking from existing long positions could accelerate a corrective decline.

          The Japanese yen remains particularly sensitive to interest-rate expectations and potential intervention-related concerns. Because GBP/JPY is frequently influenced by carry-trade positioning, even a relatively modest recovery in the yen can produce disproportionate downside movement in the currency pair.
          However, the presence of bullish higher-timeframe momentum means sellers should avoid assuming that every upward retracement represents a selling opportunity. The most convincing bearish development would be a rejection of 212.50–212.70 followed by sustained trading below 212.40. Such behaviour would indicate that buyers are losing their ability to defend previously established support.

          Technical Analysis

          GBP/JPY Faces a Critical Breakdown Attempt at 212.50: Can Yen Strength Push Sterling Lower?_1
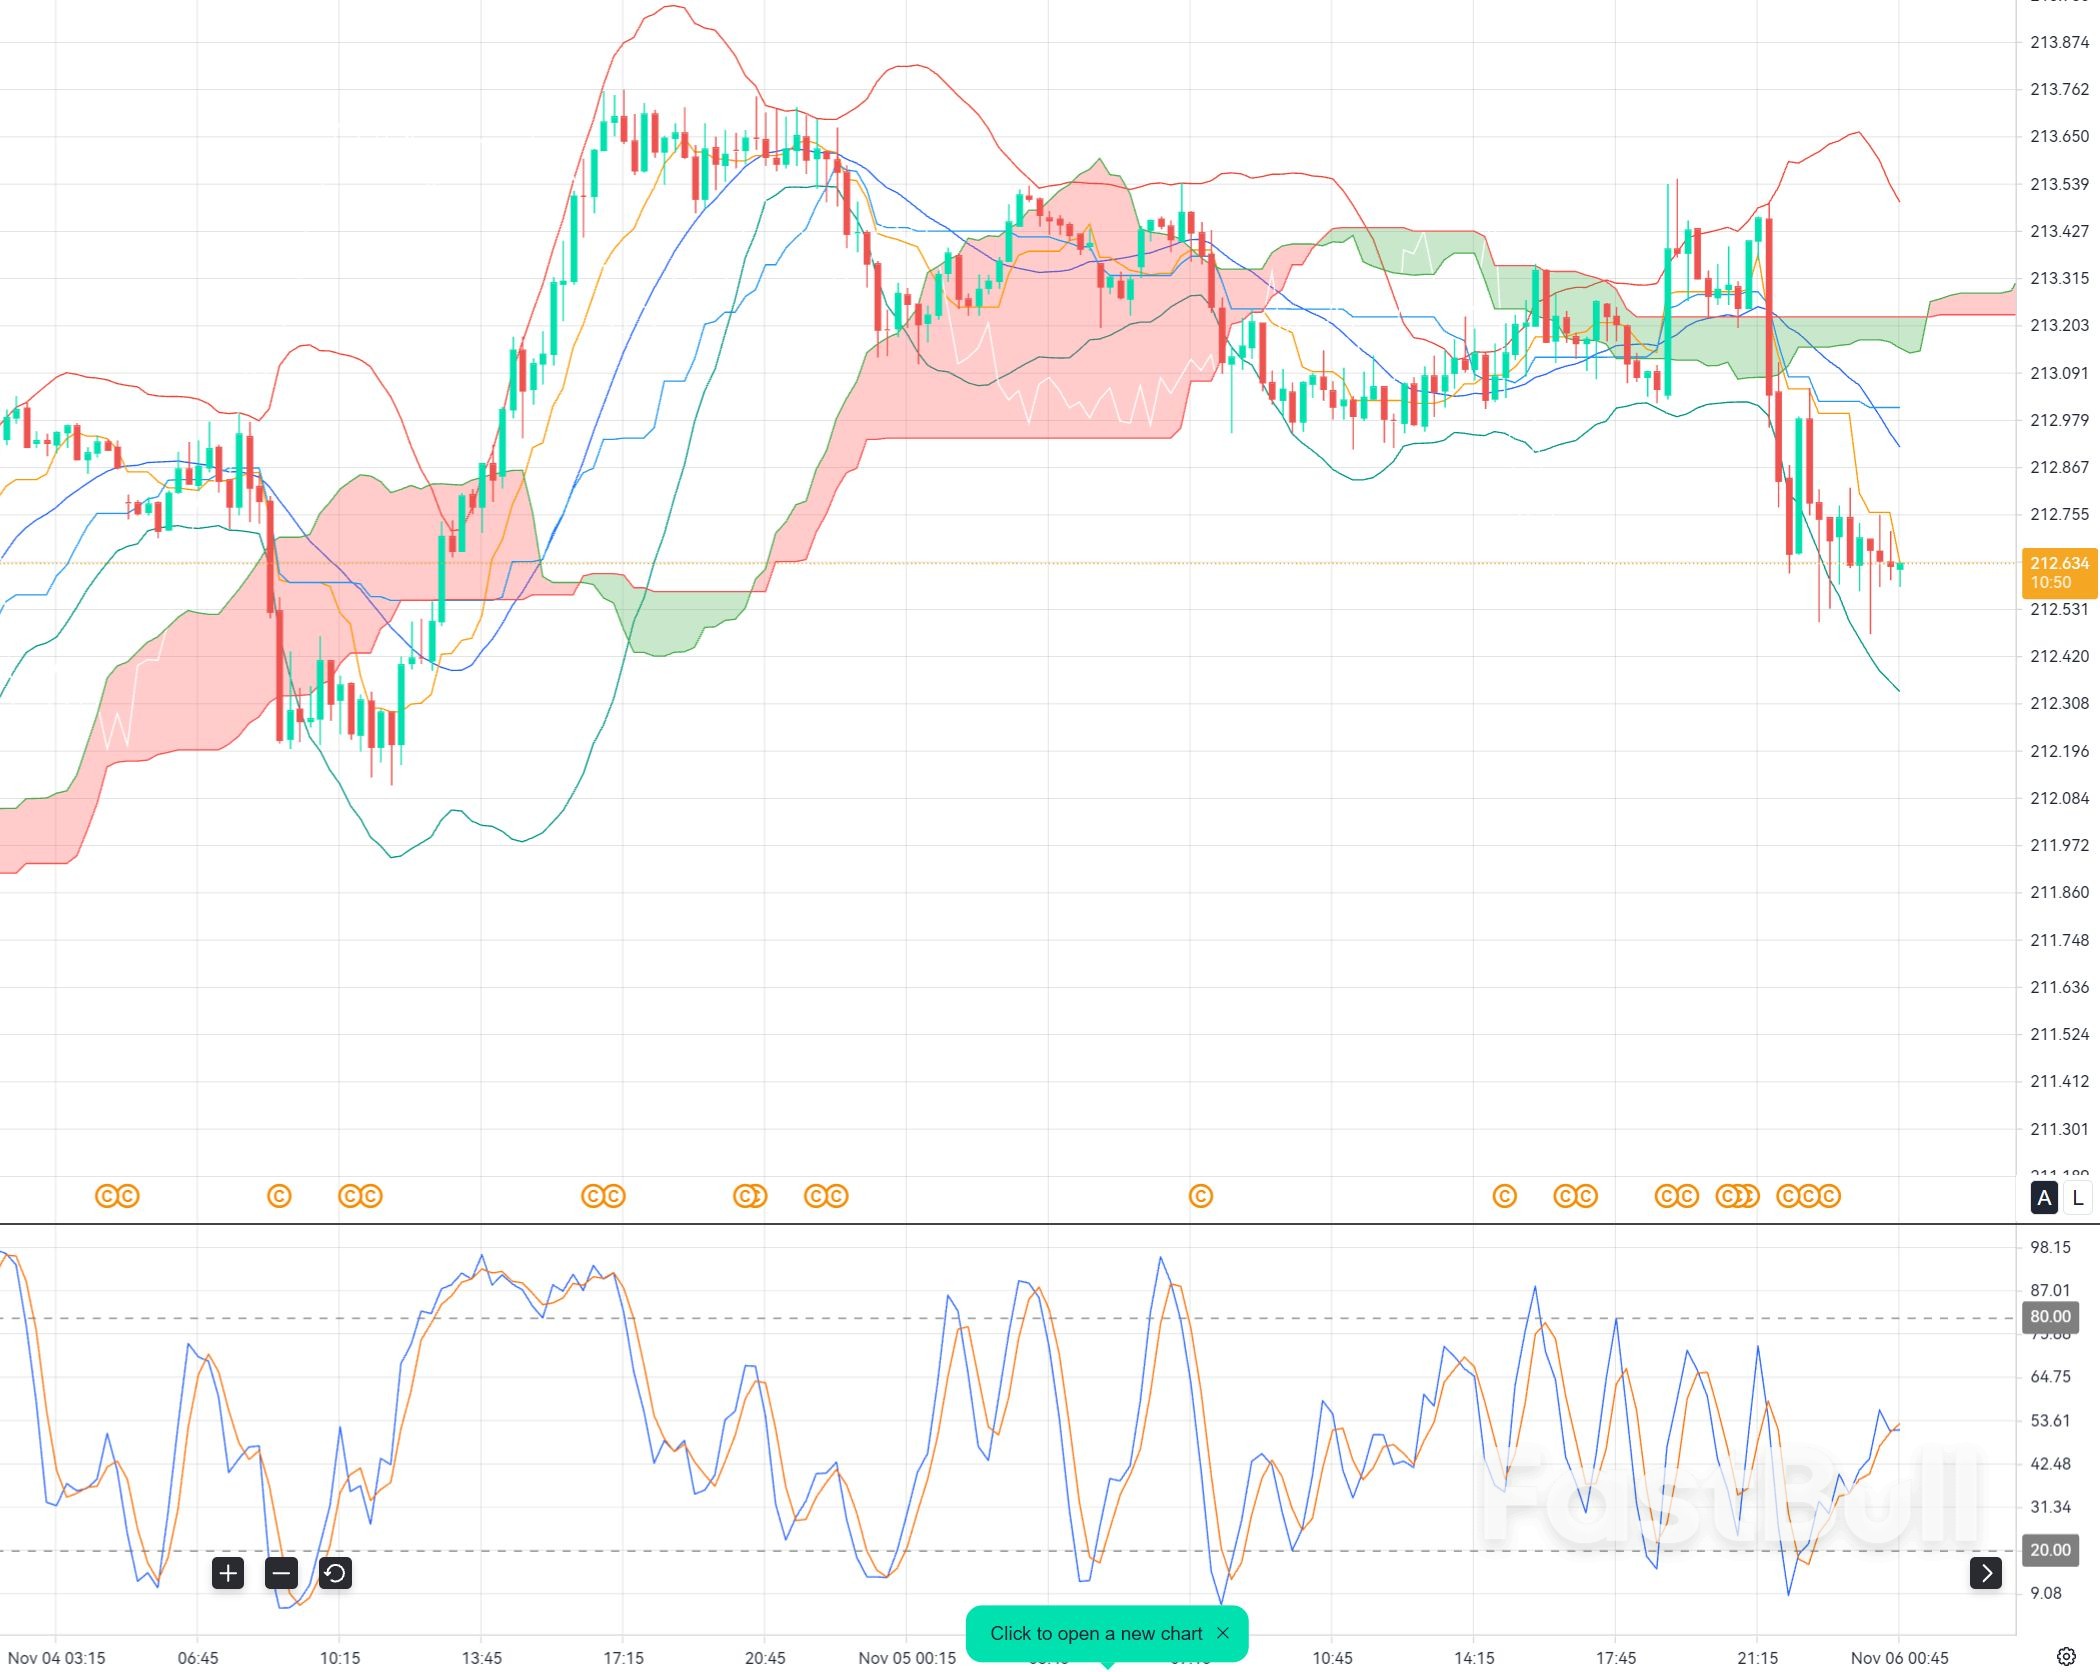
          The proposed 212.50 entry aligns closely with the 212.46 pullback-resistance pivot identified in Tickmill's 4 November technical analysis. This provides a meaningful technical reference for the short position. Meanwhile, the immediate resistance region extends towards 213.00–213.32, with 213.50 representing a more significant invalidation area. On the downside, 212.18, 211.53 and 211.40 are important support references.
          Bollinger Bands (20,0,2): The preferred SELL confirmation is a rejection around the upper band, followed by a return towards the middle band. If the bands begin contracting after the recent decline, this could indicate that bullish momentum is fading and consolidation is developing before another downward movement. However, sustained trading above the middle band would weaken the bearish setup.
          Ichimoku Kinko Hyo (9,26,52): The Tenkan-sen and Kijun-sen relationship will be important in identifying a potential M15 trend reversal. A bearish Tenkan-sen crossover below the Kijun-sen, accompanied by price moving beneath the Kijun-sen, would strengthen the SELL argument. A rejection beneath the Kumo cloud would provide additional confirmation. If price remains above the cloud, the bearish outlook should remain cautious.
          Stochastic (5,3,3): A bearish crossover above the 80 threshold would suggest that buying momentum is becoming exhausted. The strongest signal would occur when Stochastic turns downward simultaneously with a bearish M15 candle near 212.50. If the indicator remains elevated while price continues making higher highs, sellers should avoid entering prematurely.
          Overall, the SELL setup relies on 212.50 acting as resistance during a short-term corrective movement. A confirmed rejection could open the way towards 212.18 initially, followed by 211.53 and 211.40. Conversely, sustained recovery above 213.00–213.32 would weaken the immediate bearish outlook.

          Trade Recommendation

          Entry: 212.500
          Take Profit: 211.500
          Stop Loss: 213.350
          Risk Warnings and Disclaimers
          You understand and acknowledge that there is a high degree of risk involved in trading. Following any strategies or investment methods may lead to potential losses. The content on the site is provided by our contributors and analysts for information purposes only. You are solely responsible for determining whether any trading assets, securities, strategy, or any other product is suitable for investing based on your own investment objectives and financial situation.
          Add to Favorites
          Share
          FastBull
          Copyright © 2026 FastBull Ltd

          728 RM B 7/F GEE LOK IND BLDG NO 34 HUNG TO RD KWUN TONG KLN HONG KONG

          TelegramInstagramTwitterfacebooklinkedin
          App Store Google Play Android Windows
          Products
          Charts

          Chats

          Q&A with Experts
          Screeners
          Economic Calendar
          Data
          Tools
          Membership
          Features
          Function
          Markets
          Copy Trading
          Latest Signals
          Contests
          24/7
          Analysis
          Education
          Company
          Careers
          About Us
          Contact Us
          Advertising
          Download FastBull
          Help Center
          Feedback
          User Agreement
          Privacy Policy
          Personal Information Protection Statement
          Business

          White Label

          Broker API

          Data API

          Web Plug-ins

          Poster Maker

          Affiliate Program

          Risk Disclosure

          The risk of loss in trading financial instruments such as stocks, FX, commodities, futures, bonds, ETFs and crypto can be substantial. You may sustain a total loss of the funds that you deposit with your broker. Therefore, you should carefully consider whether such trading is suitable for you in light of your circumstances and financial resources.

          No decision to invest should be made without thoroughly conducting due diligence by yourself or consulting with your financial advisors. Our web content might not suit you since we don't know your financial conditions and investment needs. Our financial information might have latency or contain inaccuracy, so you should be fully responsible for any of your trading and investment decisions. The company will not be responsible for your capital loss.

          Without getting permission from the website, you are not allowed to copy the website's graphics, texts, or trademarks. Intellectual property rights in the content or data incorporated into this website belong to its providers and exchange merchants.

          Not Logged In

          Log in to access more features

          Connect Broker
          Become a signal provider
          Help Center
          Customer Service
          Dark Mode
          Price Up/Down Colors

          Log In

          Sign Up

          Position
          Layout
          Fullscreen
          Default to Chart
          The chart page opens by default when you visit fastbull.com