• Trade
  • Markets
  • Copy
  • Contests
  • 24/7
  • Calendar
  • Q&A
  • Chats
Screeners
SYMBOL
LAST
BID
ASK
HIGH
LOW
NET CHG.
%CHG.
SPREAD
SOURCE
SPX
S&P 500 Index
7323.63
7323.63
7323.63
7367.68
7285.76
-16.90
-0.23%
--
--
DJI
Dow Jones Industrial Average
50198.17
50198.17
50198.17
50637.70
50029.35
-561.25
-1.11%
--
--
IXIC
NASDAQ Composite Index
24429.87
24429.87
24429.87
24538.78
24225.30
+101.50
+ 0.42%
--
--
USDX
US Dollar Index
103.682
103.682
103.762
103.793
103.473
+0.252
+ 0.24%
--
--
EURUSD
Euro / US Dollar
1.09707
1.09707
1.09717
1.09748
1.09686
-0.00019
-0.02%
--
--
GBPUSD
Pound Sterling / US Dollar
1.31423
1.31423
1.31435
1.31498
1.31381
-0.00050
-0.04%
--
--
XAUUSD
Gold / US Dollar
3744.24
3744.24
3744.81
3745.16
3726.91
+18.73
+ 0.50%
--
--
WTI
Light Sweet Crude Oil
81.726
81.726
81.755
82.073
81.673
-0.043
-0.05%
--
--

Community Accounts

Signal Accounts
--
Profit Accounts
--
Loss Accounts
--
View More

Become a signal provider

Sell trading signals to earn additional income

View More

Guide to Copy Trading

Get started with ease and confidence

View More

Signal Accounts for Members

All Signal Accounts

Best Return
  • Best Return
  • Best P/L
  • Best MDD
Past 1W
  • Past 1W
  • Past 1M
  • Past 1Y

All Contests

  • All
  • Recommend
  • Stocks
  • Cryptocurrencies
  • Central Banks
  • Trump Updates
  • Featured News
Top News Only
Share

Australia's Employment Fell By 43,500 In October; The Forecast Was 25,000. Australia's Unemployment Rate Was 4.9% In October; The Forecast Was 4.7%

Share

Trump: We Don’t Need Help To Defeat Iran

Share

New York Silver Futures Rose 1% On The Day, Currently Trading At $45.52 Per Ounce

Share

Trump: I Want To Upgrade The Entire Federal Aviation Administration System, Not Just Individual Parts

Share

US President Trump: All Power Outages Are Isolated Incidents

Share

The Yield On Japan's 30-year Government Bonds Fell 3 Basis Points To 4.025%

Share

The Trump Administration Has Established A Cybercrime Threat Center To Combat Illegal Activities Such As Cryptocurrency Fraud

Share

YY Inc. Reported Net Revenue Of $624.6 Million For The Third Quarter, Compared To An Estimated $611.3 Million; Adjusted Net Income From Continuing Operations Per ADS For The Third Quarter Was $1.36

Share

The Yield On Japan's 10-year Government Bonds Fell 0.5 Basis Points To 2.865%

Share

Spot Gold Broke Through $3,740 Per Ounce, Up 0.42% On The Day

Share

New York Gold Futures Broke Through $3,740 Per Ounce, Down 0.05% On The Day

Share

Spot Silver Rose 1% On The Day, Currently Trading At $45.49 Per Ounce

Share

Market News: Israelis Provided Intelligence To The United States, Claiming That Iran May Be Planning A Chemical Weapons Attack

Share

According To The New York Times, Trump Is Considering New Intelligence Regarding Iran's Military Capabilities

Share

According To The New York Times, Trump Has Not Yet Made A Decision On Attacking Iran

Share

UniCredit Bank Has Pledged To Appoint A German National To Its Board Of Directors

Share

UniCredit Agreed To Keep Commerzbank And The Merged Entity Publicly Listed. Frankfurt Will Become The German Headquarters. Germany Abandoned Its Request To Nominate Two Members To The Commerzbank Board Of Directors

Share

UniCredit Bank Has Reached A Broad Agreement With Germany To Acquire Commerzbank

Share

Farmer, A Prominent American Corporate Lobbyist, Hopes That Trump Will Veto The Decision Of Federal Trade Commission Chairman Ferguson

Share

Musk: No Individual Has Helped Ukraine More Than I Have

TIME
ACT
FCST
PREV
IMPACT
BOE Gov Bailey Speaks
South Africa Core CPI YoY (Oct)

A:--

F: --

P: --

XAUUSD
  • XAUUSD
  • XAGUSD
  • WTI
  • USDX
South Africa CPI YoY (Oct)

A:--

F: --

P: --

XAUUSD
  • XAUUSD
  • XAGUSD
  • WTI
  • USDX
Euro Zone HICP Final YoY (Oct)

A:--

F: --

P: --

EURUSD
  • EURUSD
  • XAUUSD
  • XAGUSD
  • WTI
  • USDX
Euro Zone HICP Final MoM (Oct)

A:--

F: --

P: --

EURUSD
  • EURUSD
  • XAUUSD
  • XAGUSD
  • WTI
  • USDX
Euro Zone Core CPI Final YoY (Oct)

A:--

F: --

P: --

EURUSD
  • EURUSD
  • XAUUSD
  • XAGUSD
  • WTI
  • USDX
Euro Zone CPI YoY (Excl. Tobacco) (Oct)

A:--

F: --

P: --

EURUSD
  • EURUSD
  • XAUUSD
  • XAGUSD
  • WTI
  • USDX
Euro Zone Core CPI Final MoM (Oct)

A:--

F: --

P: --

EURUSD
  • EURUSD
  • XAUUSD
  • XAGUSD
  • WTI
  • USDX
South Africa Retail Sales YoY (Sept)

A:--

F: --

P: --

XAUUSD
  • XAUUSD
  • XAGUSD
  • WTI
  • USDX
U.S. MBA Mortgage Application Activity Index WoW

A:--

F: --

P: --

USDX
  • USDX
  • XAUUSD
  • XAGUSD
  • WTI
Canada New Housing Price Index MoM (Oct)

A:--

F: --

P: --

USDCAD
  • USDCAD
  • XAUUSD
  • XAGUSD
  • WTI
  • USDX
U.S. Annual New Housing Starts (SA) (Oct)

A:--

F: --

P: --
USDX
  • USDX
  • XAUUSD
  • XAGUSD
  • WTI
U.S. Total Building Permits (SA) (Oct)

A:--

F: --

P: --

USDX
  • USDX
  • XAUUSD
  • XAGUSD
  • WTI
U.S. New Housing Starts Annualized MoM (SA) (Oct)

A:--

F: --

P: --
USDX
  • USDX
  • XAUUSD
  • XAGUSD
  • WTI
U.S. Building Permits MoM (SA) (Oct)

A:--

F: --

P: --

USDX
  • USDX
  • XAUUSD
  • XAGUSD
  • WTI
ECB President Lagarde Speaks
U.S. Pending Home Sales Index (Oct)

A:--

F: --

P: --
USDX
  • USDX
  • XAUUSD
  • XAGUSD
  • WTI
U.S. Pending Home Sales Index MoM (SA) (Oct)

A:--

F: --

P: --
USDX
  • USDX
  • XAUUSD
  • XAGUSD
  • WTI
U.S. Pending Home Sales Index YoY (Oct)

A:--

F: --

P: --

USDX
  • USDX
  • XAUUSD
  • XAGUSD
  • WTI
BOE Gov Bailey Speaks
U.S. EIA Weekly Crude Stocks Change

A:--

F: --

P: --

WTI
  • WTI
  • XAUUSD
  • XAGUSD
  • USDX
U.S. EIA Weekly Cushing, Oklahoma Crude Oil Stocks Change

A:--

F: --

P: --

WTI
  • WTI
  • XAUUSD
  • XAGUSD
  • USDX
U.S. EIA Weekly Crude Demand Projected by Production

A:--

F: --

P: --

U.S. EIA Weekly Gasoline Stocks Change

A:--

F: --

P: --

WTI
  • WTI
  • XAUUSD
  • XAGUSD
  • USDX
U.S. EIA Weekly Crude Oil Imports Changes

A:--

F: --

P: --

WTI
  • WTI
  • XAUUSD
  • XAGUSD
  • USDX
U.S. EIA Weekly Heating Oil Stock Changes

A:--

F: --

P: --

WTI
  • WTI
  • XAUUSD
  • XAGUSD
  • USDX
FOMC Meeting Minutes
New York Federal Reserve President Williams delivered a speech.
Japan Core Machinery Orders MoM (Sept)

A:--

F: --

P: --

USDJPY
  • USDJPY
  • XAUUSD
  • XAGUSD
  • WTI
  • USDX
Japan Core Machinery Orders YoY (Sept)

A:--

F: --

P: --

USDJPY
  • USDJPY
  • XAUUSD
  • XAGUSD
  • WTI
  • USDX
Australia Employment (Oct)

A:--

F: --

P: --

AUDUSD
  • AUDUSD
  • XAUUSD
  • XAGUSD
  • WTI
  • USDX
Australia Labor Force Participation Rate (SA) (Oct)

A:--

F: --

P: --

AUDUSD
  • AUDUSD
  • XAUUSD
  • XAGUSD
  • WTI
  • USDX
Australia Full-time Employment (SA) (Oct)

A:--

F: --

P: --

AUDUSD
  • AUDUSD
  • XAUUSD
  • XAGUSD
  • WTI
  • USDX
Australia Unemployment Rate (SA) (Oct)

A:--

F: --

P: --

AUDUSD
  • AUDUSD
  • XAUUSD
  • XAGUSD
  • WTI
  • USDX
Euro Zone Current Account (SA) (Sept)

--

F: --

P: --

Euro Zone Current Account (Not SA) (Sept)

--

F: --

P: --

Euro Zone Labor Cost YoY (Q3)

--

F: --

P: --

Euro Zone Construction Output YoY (Sept)

--

F: --

P: --

Euro Zone Construction Output MoM (SA) (Sept)

--

F: --

P: --

U.K. CBI Industrial Prices Expectations (Nov)

--

F: --

P: --

U.K. CBI Industrial Trends - Orders (Nov)

--

F: --

P: --

South Africa Repo Rate

--

F: --

P: --

Canada Industrial Product Price Index YoY (Oct)

--

F: --

P: --

U.S. Philadelphia Fed Business Activity Index (SA) (Nov)

--

F: --

P: --

Canada Industrial Product Price Index MoM (Oct)

--

F: --

P: --

U.S. Weekly Initial Jobless Claims (SA)

--

F: --

P: --

U.S. Initial Jobless Claims 4-Week Avg. (SA)

--

F: --

P: --

U.S. Weekly Continued Jobless Claims (SA)

--

F: --

P: --

U.S. Philadelphia Fed Manufacturing Employment Index (Nov)

--

F: --

P: --

ECB President Lagarde Speaks
FOMC Member Hammack Speaks
U.S. Conference Board Leading Economic Index MoM (Oct)

--

F: --

P: --

U.S. Conference Board Lagging Economic Index MoM (Oct)

--

F: --

P: --

U.S. Conference Board Coincident Economic Index MoM (Oct)

--

F: --

P: --

U.S. Conference Board Leading Economic Index (Oct)

--

F: --

P: --

U.S. EIA Weekly Natural Gas Stocks Change

--

F: --

P: --

U.S. Kansas Fed Manufacturing Composite Index (Nov)

--

F: --

P: --

U.S. Kansas Fed Manufacturing Production Index (Nov)

--

F: --

P: --

U.S. 10-Year TIPS Auction Avg. Yield

--

F: --

P: --

Argentina Trade Balance (Oct)

--

F: --

P: --

Richmond Federal Reserve President Barkin delivered a speech.
Q&A with Experts
    • All
    • Chatrooms
    • Groups
    • Friends
    Skylark flag
    Skylark
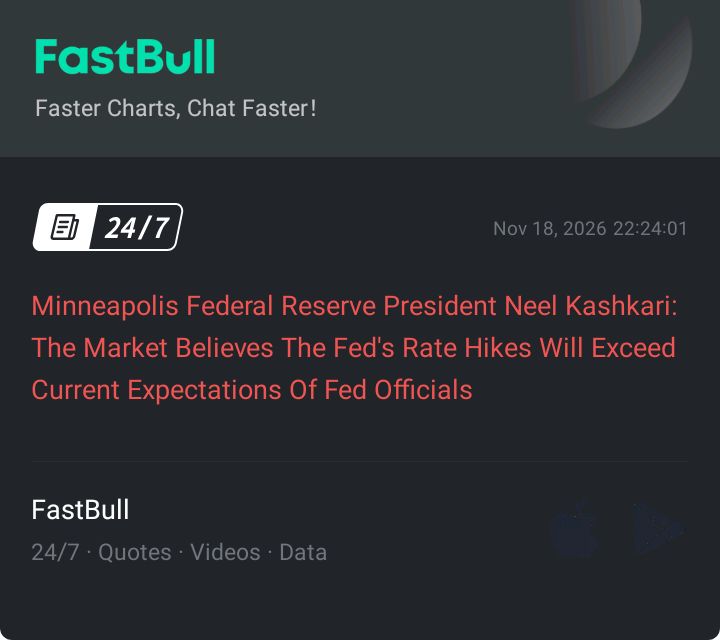
    @voltage magix What does this mean? Kashkari is saying the market thinks the Fed will increase interest rates MORE than what Fed officials themselves are planning.
    Skylark flag
    Skylark
    @voltage magix In other words, traders are expecting the Fed to be more aggressive / more hawkish. How does this affect the market?
    Skylark flag
    Skylark
    @voltage magix USD - May Get Stronger When people expect higher interest rates, USD becomes stronger because investors want to hold Dollars to get higher returns.
    Skylark flag
    Skylark
    GOLD (XAUUSD) - May Face Pressure* Higher rates are normally bad for Gold. Because Gold doesn't pay interest. If USD is paying more interest, people will move money from Gold to USD. So Gold may pull back or struggle to go up. @voltage magix
    6063947 flag
    how about gold
    EuroTrader flag
    6063947
    hello 👋 everyone good evening to you
    @6063947good evening my friend how are you doing today. Hope today treated you well
    EuroTrader flag
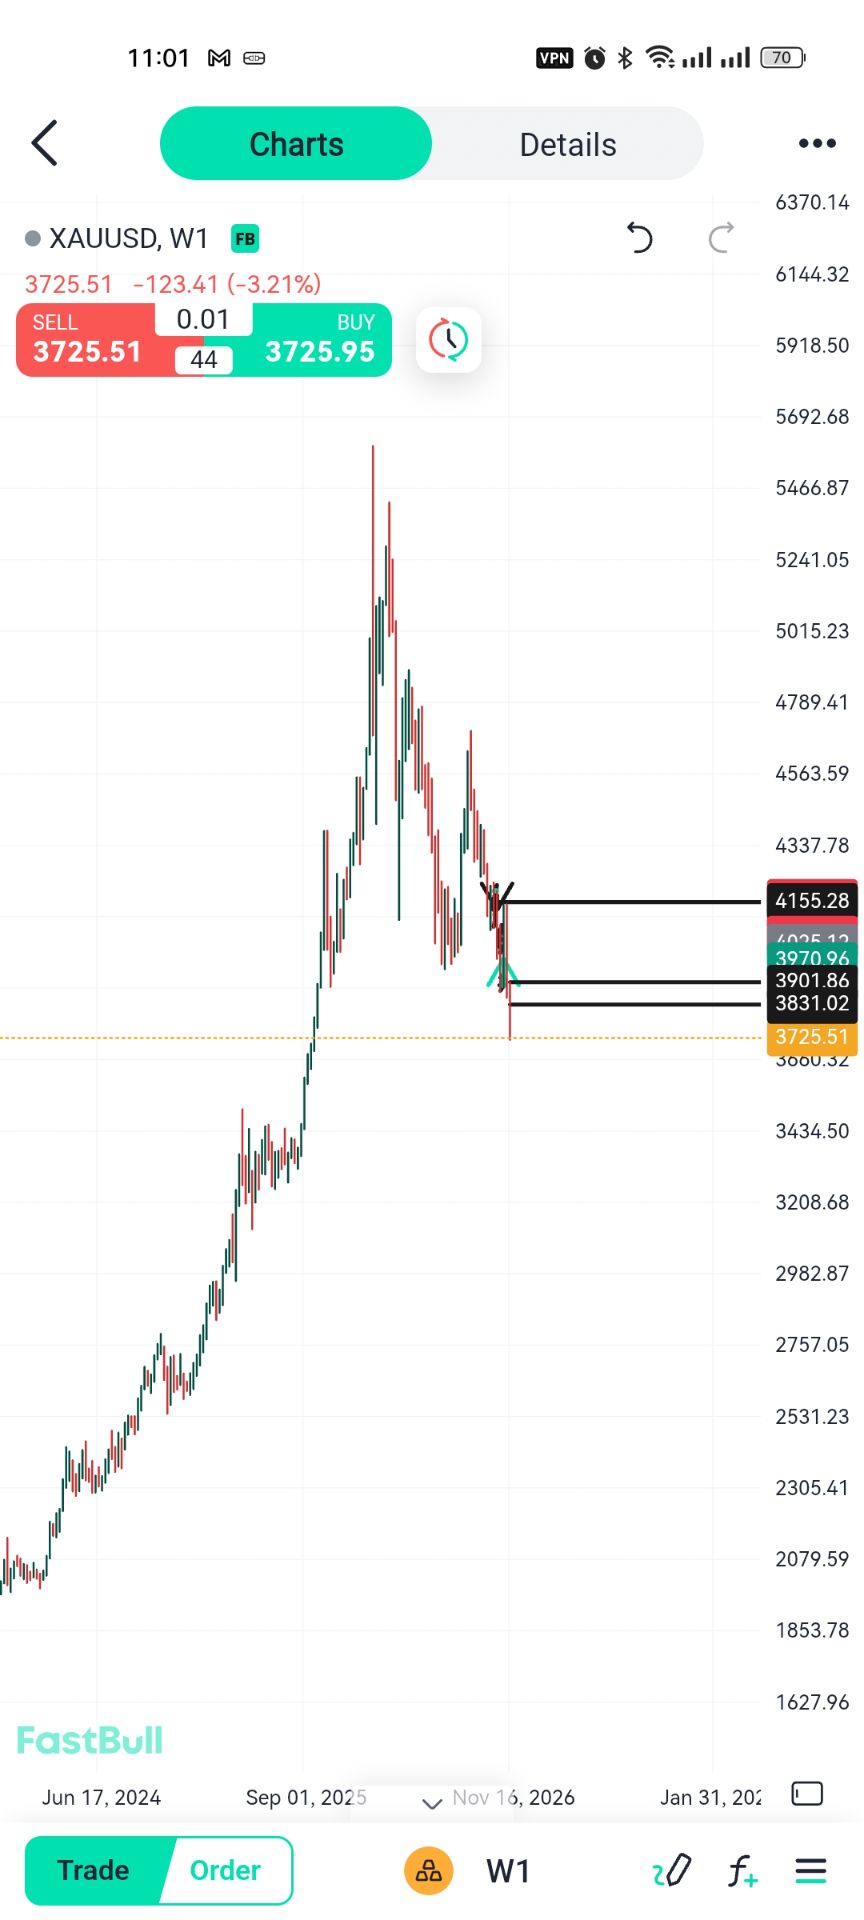
    @6063947gold would continue it's sell off to the downside tomorrow so let's hold the first and keep selling
    EuroTrader flag
    EuroTrader flag
    EuroTrader
    @6063947on the weekly time frame gold is headed for 3200 so let's brace for impact. Just look for sells only on Xauusd
    Skylark flag
    6063947
    hello 👋 everyone good evening to you
    FGOLD (XAUUSD) - May Face Pressure* Higher rates are normally bad for Gold. Because Gold doesn't pay interest. If USD is paying more interest, people will move money from Gold to USD. So Gold may pull back or struggle to go up. @Visitor6063947
    Skylark flag
    - If Gold goes up to Supply, we look for sell. - If USD pairs go up to Supply, we look for sell. - Always use Stop Loss. Fed news can cause sharp moves and fakeouts.@Visitor6063947
    Skylark flag
    6063947
    how about gold
    . EURUSD & GBPUSD - May Go Down If USD gets stronger, EURUSD and GBPUSD will likely go down. @Visitor6063947
    voltage magix flag
    EuroTrader
    .@voltage magix other times price can break above it and fail to trade higher. It can still sell off
    @EuroTraderhow do you know when price would break above it and still sell higher?
    voltage magix flag
    EuroTrader
    .@voltage magix other times price can break above it and fail to trade higher. It can still sell off
    @EuroTraderI checked online, it says one of the times this happens is when the 4h or 1d timeline is bullish or bearish and the distribution is opposite. then you can have a failed breakout
    voltage magix flag
    voltage magix flag
    voltage magix flag
    voltage magix
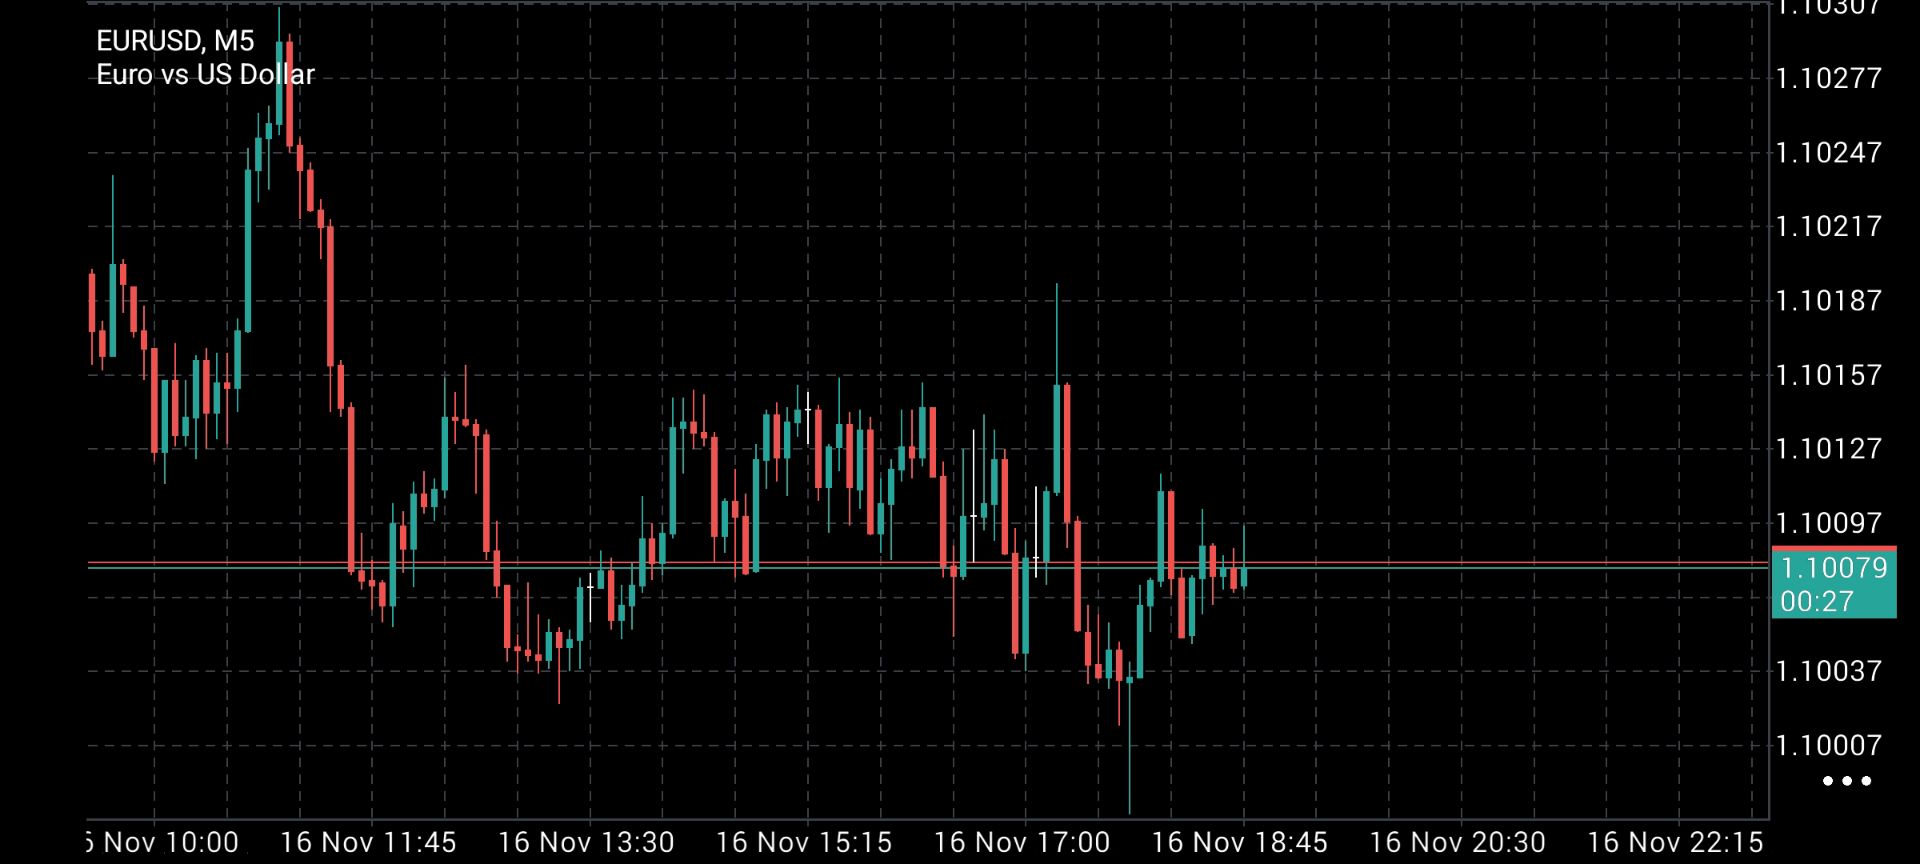
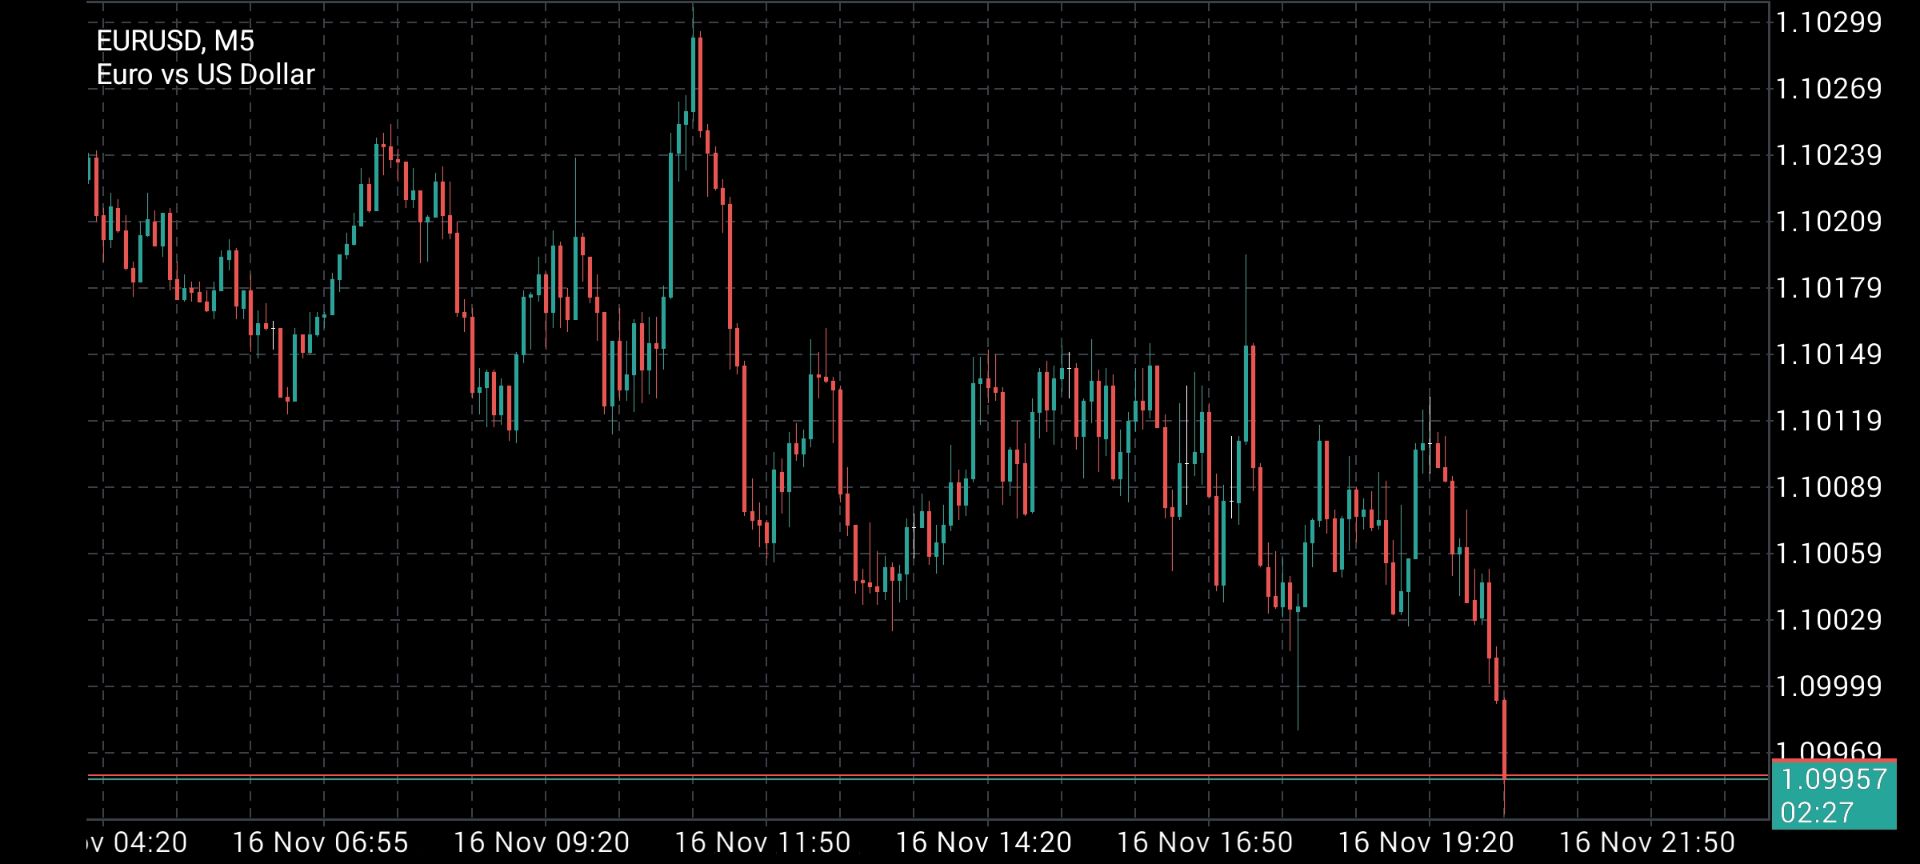
    like on these two images... you would notice a strong rejection candle after the consolidation, if you check a higher Time frame, price is bearish... you can easily mistake this for a bearish breakout but...
    mistake this for a bullish breakout
    voltage magix flag
    @Euro Trader
    voltage magix flag
    EuroTrader
    .@voltage magix other times price can break above it and fail to trade higher. It can still sell off
    @EuroTrader.
    JEA flag
    les gars !!!
    Type here...
    Add Symbol or Code

      No matching data

      All
      Recommend
      Stocks
      Cryptocurrencies
      Central Banks
      Trump Updates
      Featured News
      • All
      • Russia-Ukraine Conflict
      • Middle East Flashpoint
      • All
      • Russia-Ukraine Conflict
      • Middle East Flashpoint

      Search
      Products

      Charts Free Forever

      Chats Q&A with Experts
      Screeners Economic Calendar Data Tools
      Membership Features
      Data Warehouse Market Trends Institutional Data Policy Rates Macro

      Market Trends

      Market Sentiment Order Book Forex Correlations

      Top Indicators

      Charts Free Forever
      Markets

      News

      24/7 Analysis Education

      Latest Views

      Latest Update

      Signals

      Copy Rankings Latest Signals Become a signal provider AI Rating
      Contests
      Brokers

      Overview Brokers Assessment Rankings Regulators News Claims
      Broker listing Forex Brokers Comparison Tool Live Spread Comparison Scam
      Q&A Complaint Scam Alert Videos Tips to Detect Scam
      More

      Business
      Events
      Careers About Us Advertising Help Center

      White Label

      Broker API

      Data API

      Web Plug-ins

      Affiliate Program

      Awards Institution Evaluation IB Seminar Salon Event Exhibition
      Vietnam Thailand Singapore Dubai
      Fans Party Investment Sharing Session
      FastBull Summit BrokersView Expo
      Recent Searches
        Top Searches
          Markets
          Analysis
          User
          24/7
          Economic Calendar
          Education
          Data
          • Names
          • Latest
          • Prev

          View All

          No data

          Scan to Download

          Faster Charts, Chat Faster!

          Download
          English
          • English
          • Español
          • العربية
          • Bahasa Indonesia
          • Bahasa Melayu
          • Tiếng Việt
          • ภาษาไทย
          • Français
          • Italiano
          • Türkçe
          • Русский язык
          • 简中
          • 繁中
          Open Account
          Search
          Products
          Charts Free Forever
          Markets
          News
          Signals

          Copy Rankings Latest Signals Become a signal provider AI Rating
          Contests
          Brokers

          Overview Brokers Assessment Rankings Regulators News Claims
          Broker listing Forex Brokers Comparison Tool Live Spread Comparison Scam
          Q&A Complaint Scam Alert Videos Tips to Detect Scam
          More

          Business
          Events
          Careers About Us Advertising Help Center

          White Label

          Broker API

          Data API

          Web Plug-ins

          Affiliate Program

          Awards Institution Evaluation IB Seminar Salon Event Exhibition
          Vietnam Thailand Singapore Dubai
          Fans Party Investment Sharing Session
          FastBull Summit BrokersView Expo

          EUR/CAD Sinks Toward 1.57: Euro Weakness Outpaces a Soft Loonie

          Gerik

          Forex

          Summary:

          On 18/11/2026, EUR/CAD slid to around 1.5705-1.5725, extending a drop from 1.5845 in just over a week. The euro is falling faster against the Dollar than the Canadian Dollar is, even though the CAD itself is weak. ...

          SELL EURCAD
          EXP
          TRADING

          1.57130

          Entry Price

          1.56600

          TP

          1.57450

          SL

          1.57267 +0.00159 +0.10%

          0.0

          Pips

          Flat

          1.56600

          TP

          Exit Price

          1.57130

          Entry Price

          1.57450

          SL
          Overview

          On 18/11/2026, Bloomberg had EUR-CAD at 1.5705, down 0.06% as of 3:56 AM EST Nov 18, after a previous close of 1.5714. The trend is clear in weekly snapshots: 1.5845 on Monday, 9 November 2026, then 1.5725 on Monday, 16 November 2026, while the cross was 1.6000 on Monday, 5 October 2026. What makes this move notable is that both currencies are weak, and the cross is falling because the euro is weaker. Since 10 November, EUR/USD has fallen from 1.1252 to below 1.1000, about 2.3%, while USD/CAD has risen about 1.3% to 1.43. The euro’s extra weakness reflects issues specific to Europe: France’s fiscal crisis, disappointing eurozone industrial output and the breakdown below the 1.10 psychological level. The CAD has its own problems: market-implied odds of a December hike fell from 54% to 38% after soft Canadian CPI. That shows the trade’s real driver: CAD is not strong, but it is less bad than the euro.

          Market Sentiment

          Sentiment toward EUR/CAD is bearish, with model-based readings agreeing: the general EUR/CAD price prediction sentiment is bearish, with 8 technical analysis indicators signaling bullish signals, and 18 signaling bearish signals. There is one important counter-argument the article has to acknowledge. Euro-area inflation is high: Eurozone inflation rose to 4.0% in October — up from 3.8% in September — as energy prices continued to climb, and Bundesbank’s Nagel has joined calls for an ECB hike in December. Eurostat publishes the final October data today, and the ECB decides on 17 December. In theory, a hawkish ECB should support the euro. In practice, markets see the hike as stagflationary: higher rates on an economy with weak output, led by energy costs and not demand. That is why the euro keeps falling even as hike expectations rise. A final CPI revised higher would be a short-term risk for the short.

          Technical Analysis

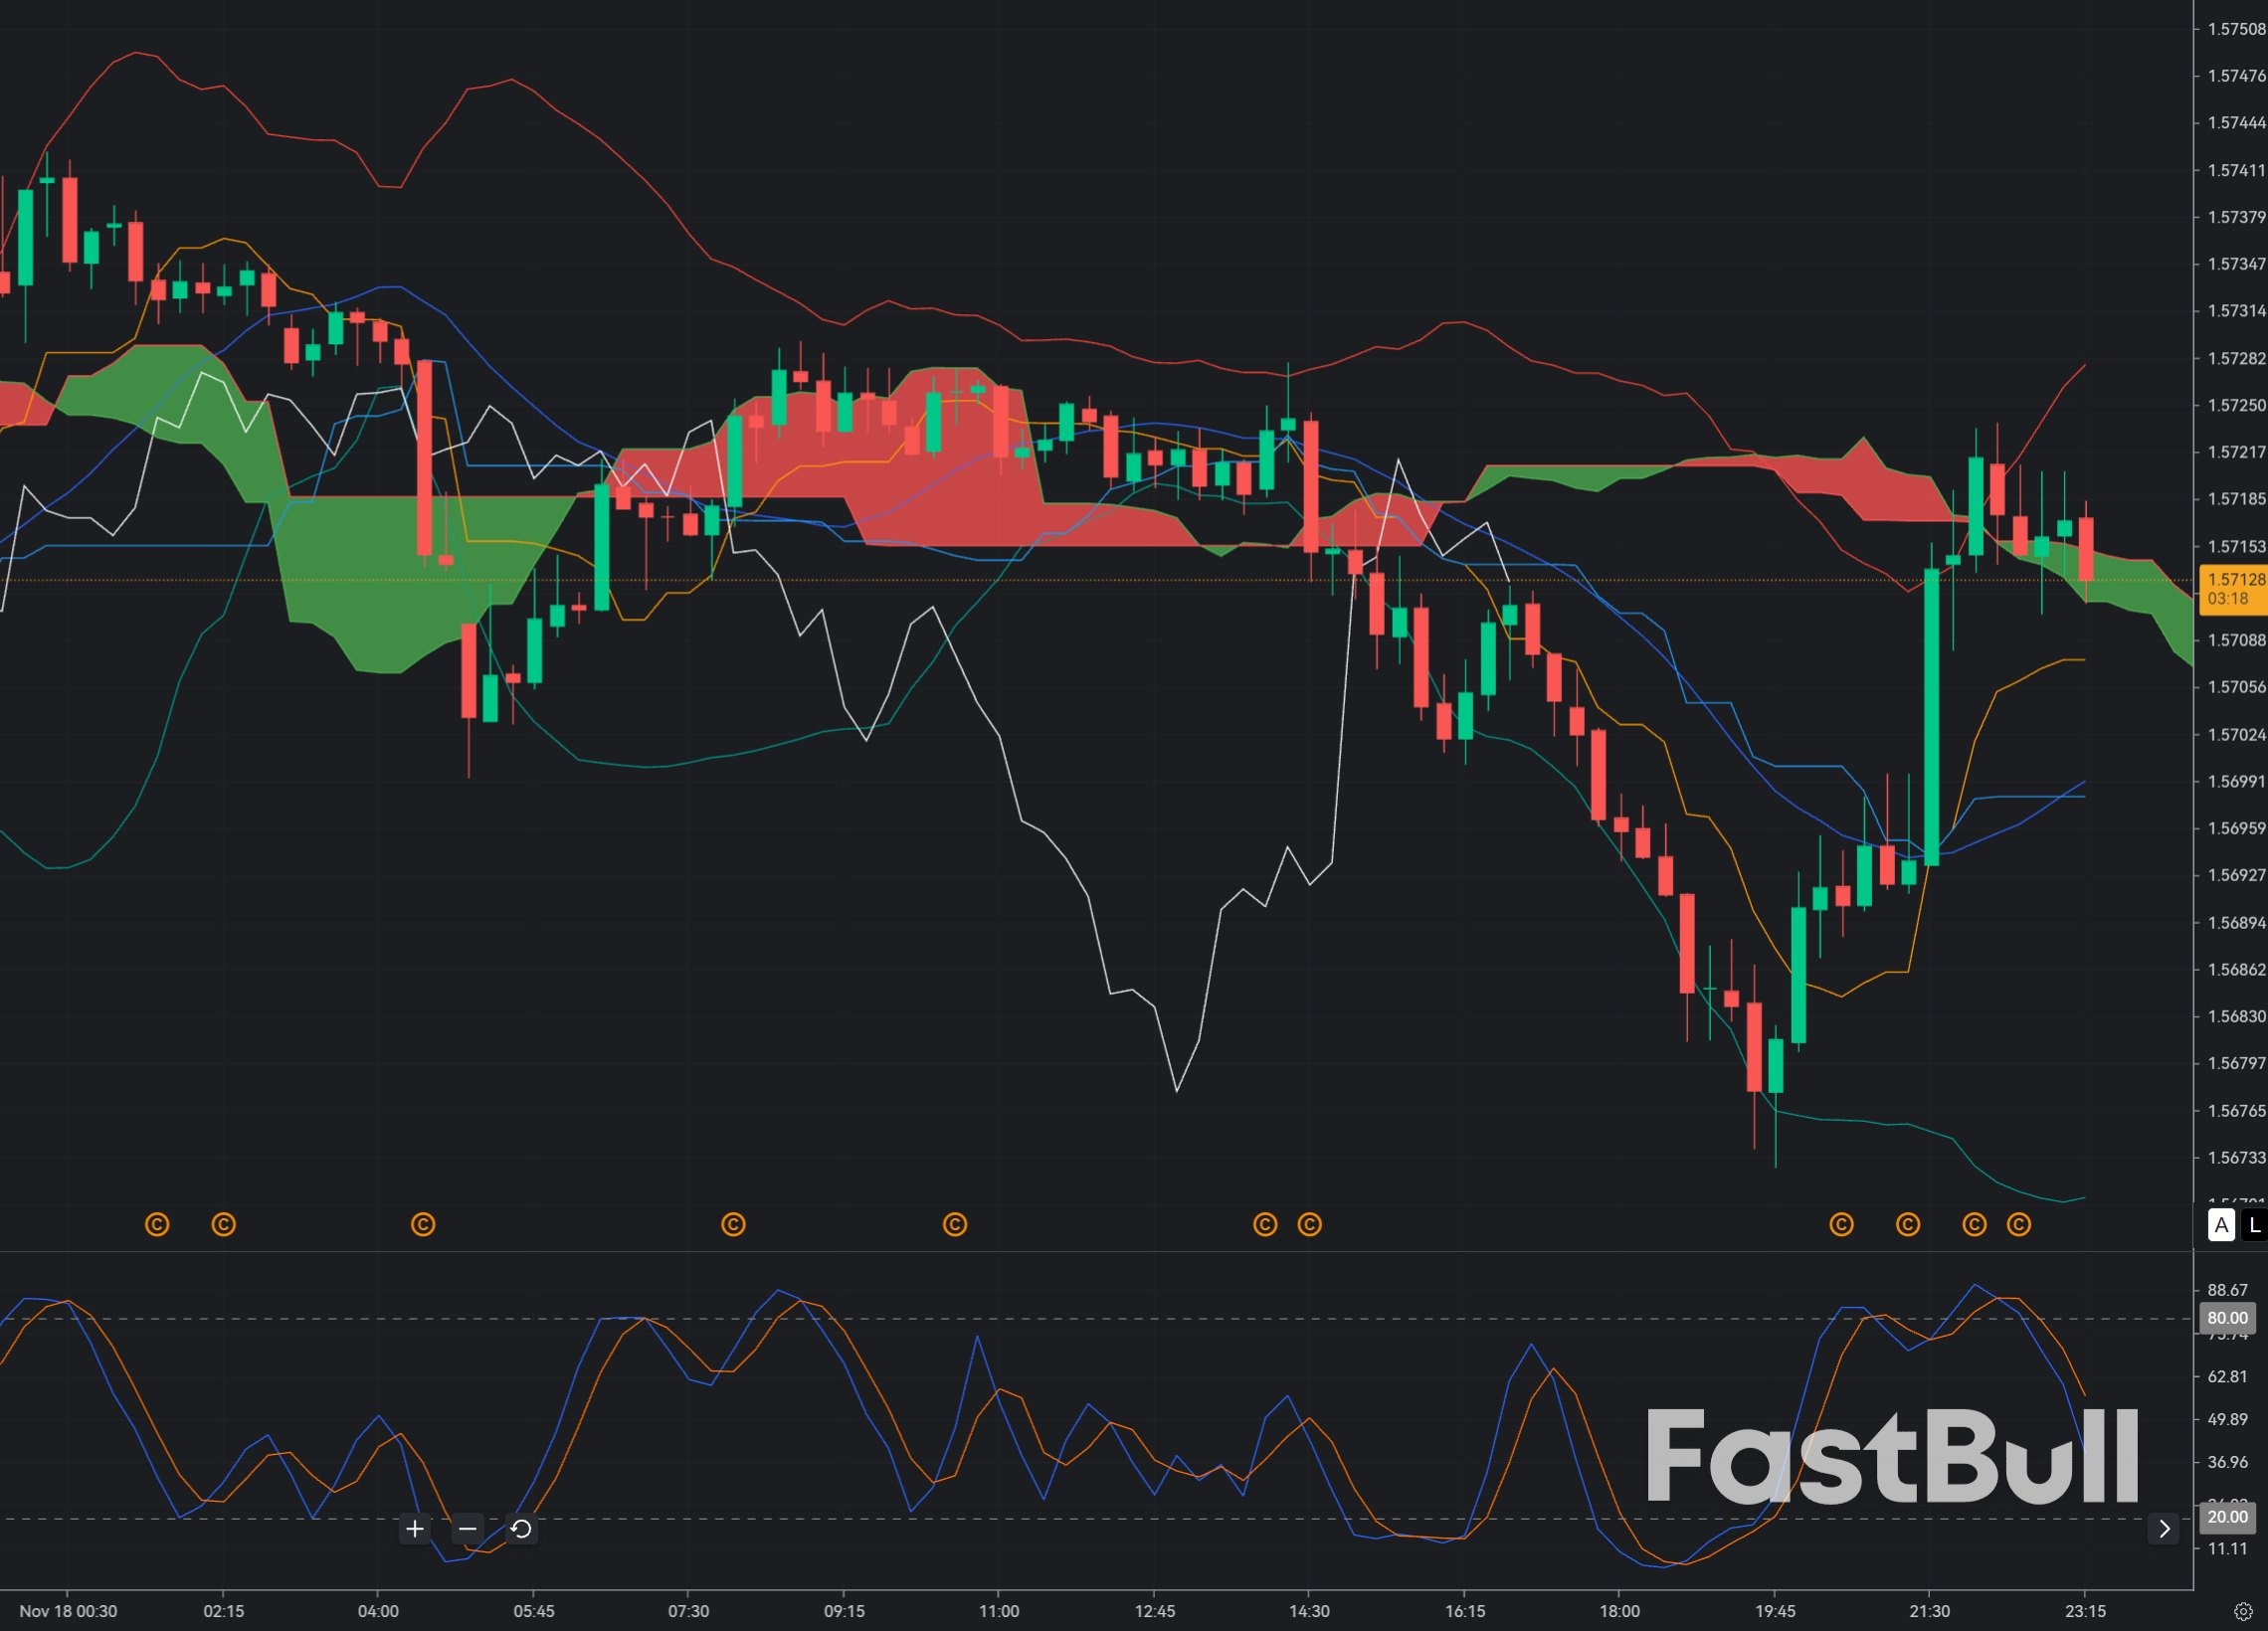
          EUR/CAD Sinks Toward 1.57: Euro Weakness Outpaces a Soft Loonie_1
          On the M15 chart, EUR/CAD is trading near 1.5710 after failing at 1.5725-1.5730, today’s high. The Bollinger Bands (20,2) are sloping down and price is riding the lower half of the bands. A test of the middle line near 1.5715-1.5720 that fails would confirm sellers are still in control. On Ichimoku (9,26,52), price is below the Kumo cloud, and the Tenkan-sen is below the Kijun-sen, a bearish structure. The Kijun-sen near 1.5725 is the line buyers have to break. Stochastic (5,3,3) has moved up from oversold. A bearish %K/%D crossover in the 60-80 zone near 1.5713 would confirm the pullback is over. Support sits at 1.5690, then 1.5652, the early-November low. Resistance is at 1.5725-1.5730, then 1.5745. An M15 close above 1.5745 would cancel the short.

          Trading Recommendation

          Entry: 1.5713
          Take Profit: 1.5660
          Stop Loss: 1.5745
          Risk Warnings and Disclaimers
          You understand and acknowledge that there is a high degree of risk involved in trading. Following any strategies or investment methods may lead to potential losses. The content on the site is provided by our contributors and analysts for information purposes only. You are solely responsible for determining whether any trading assets, securities, strategy, or any other product is suitable for investing based on your own investment objectives and financial situation.
          Add to Favorites
          Share
          FastBull
          Copyright © 2026 FastBull Ltd

          728 RM B 7/F GEE LOK IND BLDG NO 34 HUNG TO RD KWUN TONG KLN HONG KONG

          TelegramInstagramTwitterfacebooklinkedin
          App Store Google Play Android Windows
          Products
          Charts

          Chats

          Q&A with Experts
          Screeners
          Economic Calendar
          Data
          Tools
          Membership
          Features
          Function
          Markets
          Copy Trading
          Latest Signals
          Contests
          24/7
          Analysis
          Education
          Company
          Careers
          About Us
          Contact Us
          Advertising
          Download FastBull
          Help Center
          Feedback
          User Agreement
          Privacy Policy
          Personal Information Protection Statement
          Business

          White Label

          Broker API

          Data API

          Web Plug-ins

          Poster Maker

          Affiliate Program

          Risk Disclosure

          The risk of loss in trading financial instruments such as stocks, FX, commodities, futures, bonds, ETFs and crypto can be substantial. You may sustain a total loss of the funds that you deposit with your broker. Therefore, you should carefully consider whether such trading is suitable for you in light of your circumstances and financial resources.

          No decision to invest should be made without thoroughly conducting due diligence by yourself or consulting with your financial advisors. Our web content might not suit you since we don't know your financial conditions and investment needs. Our financial information might have latency or contain inaccuracy, so you should be fully responsible for any of your trading and investment decisions. The company will not be responsible for your capital loss.

          Without getting permission from the website, you are not allowed to copy the website's graphics, texts, or trademarks. Intellectual property rights in the content or data incorporated into this website belong to its providers and exchange merchants.

          Not Logged In

          Log in to access more features

          Connect Broker
          Become a signal provider
          Help Center
          Customer Service
          Dark Mode
          Price Up/Down Colors

          Log In

          Sign Up

          Position
          Layout
          Fullscreen
          Default to Chart
          The chart page opens by default when you visit fastbull.com