• Trade
  • Markets
  • Copy
  • Contests
  • News
  • 24/7
  • Calendar
  • Q&A
  • Chats
Trending
Screeners
SYMBOL
LAST
BID
ASK
HIGH
LOW
NET CHG.
%CHG.
SPREAD
SPX
S&P 500 Index
6870.39
6870.39
6870.39
6895.79
6858.28
+13.27
+ 0.19%
--
DJI
Dow Jones Industrial Average
47954.98
47954.98
47954.98
48133.54
47871.51
+104.05
+ 0.22%
--
IXIC
NASDAQ Composite Index
23578.12
23578.12
23578.12
23680.03
23506.00
+72.99
+ 0.31%
--
USDX
US Dollar Index
98.910
98.990
98.910
98.960
98.730
-0.040
-0.04%
--
EURUSD
Euro / US Dollar
1.16515
1.16523
1.16515
1.16717
1.16341
+0.00089
+ 0.08%
--
GBPUSD
Pound Sterling / US Dollar
1.33176
1.33183
1.33176
1.33462
1.33136
-0.00136
-0.10%
--
XAUUSD
Gold / US Dollar
4211.35
4211.76
4211.35
4218.85
4190.61
+13.44
+ 0.32%
--
WTI
Light Sweet Crude Oil
59.190
59.220
59.190
60.084
59.181
-0.619
-1.03%
--

Community Accounts

Signal Accounts
--
Profit Accounts
--
Loss Accounts
--
View More

Become a signal provider

Sell trading signals to earn additional income

View More

Guide to Copy Trading

Get started with ease and confidence

View More

Signal Accounts for Members

All Signal Accounts

Best Return
  • Best Return
  • Best P/L
  • Best MDD
Past 1W
  • Past 1W
  • Past 1M
  • Past 1Y

All Contests

  • All
  • Trump Updates
  • Recommend
  • Stocks
  • Cryptocurrencies
  • Central Banks
  • Featured News
Top News Only
Share

Temasek CEO Dilhan Pillay: We Are Taking A Conservative Stance On Allocating Capital

Share

Brazil Economists See Brazilian Real At 5.40 Per Dollar By Year-End 2025 Versus 5.40 In Previous Estimate - Central Bank Poll

Share

Brazil Economists See Year-End 2026 Interest Rate Selic At 12.25% Versus 12.00% In Previous Estimate - Central Bank Poll

Share

Brazil Economists See Year-End 2025 Interest Rate Selic At 15.00% Versus 15.00% In Previous Estimate - Central Bank Poll

Share

EU Commission Says Meta Has Committed To Give EU Users Choice On Personalised Ads

Share

Sources Revealed That The Bank Of England Has Invited Employees To Voluntarily Apply For Layoffs

Share

The Bank Of England Plans To Cut Staff Due To Budget Pressures

Share

Traders Believe There Is Less Than A 10% Chance That The European Central Bank Will Cut Interest Rates By 25 Basis Points In 2026

Share

Egypt, European Bank For Reconstruction And Development Sign $100 Million Financing Agreement

Share

Israel Budget Deficit 4.5% Of GDP In November Over Past 12 Months Versus 4.9% Deficit In October

Share

JPMorgan - Council Chaired By Jamie Dimon Includes Jeff Bezos

Share

UK Government: UK Health Security Agency Identified New Recombinant Mpox Virus In England In Individual Who Had Recently Travelled To Asia

Share

European Central Bank Governing Council Member Kazimir: I See No Reason To Change Rates In The Coming Months, Definitely No In December

Share

European Central Bank Governing Council Member Kazimir: Overengineering Policy Around Small Inflation Deviations Would Introduce Unnecessary Policy Uncertainty

Share

European Central Bank Governing Council Member Kazimir: European Central Bank Must Be Vigilant About Some Upside Risks To Inflation

Share

European Central Bank Governing Council Member Kazimir: Forex Pass Through To Prices May Not Be As Strong As Expected

Share

Document: EU Looking At Options For Boosting Lebanon's Internal Security Forces

Share

Thai Foreign Ministry: Military Action Will Continue Until Thai Sovereignty, Territorial Integrity Secure

Share

Ukraine President Zelenskiy: No Accord So Far On Eastern Ukraine In US Talks

Share

NATO: Ukrainian President Zelenskiy Will Meet NATO's Rutte And EU Commission Chief Von Der Leyen And Costa In Brussels On Monday

TIME
ACT
FCST
PREV
France Industrial Output MoM (SA) (Oct)

A:--

F: --

P: --
France Trade Balance (SA) (Oct)

A:--

F: --

P: --
Euro Zone Employment YoY (SA) (Q3)

A:--

F: --

P: --
Canada Part-Time Employment (SA) (Nov)

A:--

F: --

P: --

Canada Unemployment Rate (SA) (Nov)

A:--

F: --

P: --

Canada Full-time Employment (SA) (Nov)

A:--

F: --

P: --

Canada Labor Force Participation Rate (SA) (Nov)

A:--

F: --

P: --

Canada Employment (SA) (Nov)

A:--

F: --

P: --

U.S. PCE Price Index MoM (Sept)

A:--

F: --

P: --

U.S. Personal Income MoM (Sept)

A:--

F: --

P: --

U.S. Core PCE Price Index MoM (Sept)

A:--

F: --

P: --

U.S. PCE Price Index YoY (SA) (Sept)

A:--

F: --

P: --

U.S. Core PCE Price Index YoY (Sept)

A:--

F: --

P: --

U.S. Personal Outlays MoM (SA) (Sept)

A:--

F: --

P: --
U.S. 5-10 Year-Ahead Inflation Expectations (Dec)

A:--

F: --

P: --

U.S. Real Personal Consumption Expenditures MoM (Sept)

A:--

F: --

P: --
U.S. Weekly Total Rig Count

A:--

F: --

P: --

U.S. Weekly Total Oil Rig Count

A:--

F: --

P: --

U.S. Consumer Credit (SA) (Oct)

A:--

F: --

P: --
China, Mainland Foreign Exchange Reserves (Nov)

A:--

F: --

P: --

Japan Trade Balance (Oct)

A:--

F: --

P: --

Japan Nominal GDP Revised QoQ (Q3)

A:--

F: --

P: --

China, Mainland Imports YoY (CNH) (Nov)

A:--

F: --

P: --

China, Mainland Exports (Nov)

A:--

F: --

P: --

China, Mainland Imports (CNH) (Nov)

A:--

F: --

P: --

China, Mainland Trade Balance (CNH) (Nov)

A:--

F: --

P: --

China, Mainland Exports YoY (USD) (Nov)

A:--

F: --

P: --

China, Mainland Imports YoY (USD) (Nov)

A:--

F: --

P: --

Germany Industrial Output MoM (SA) (Oct)

A:--

F: --

P: --
Euro Zone Sentix Investor Confidence Index (Dec)

A:--

F: --

P: --

Canada National Economic Confidence Index

--

F: --

P: --

U.K. BRC Like-For-Like Retail Sales YoY (Nov)

--

F: --

P: --

U.K. BRC Overall Retail Sales YoY (Nov)

--

F: --

P: --

Australia Overnight (Borrowing) Key Rate

--

F: --

P: --

RBA Rate Statement
RBA Press Conference
Germany Exports MoM (SA) (Oct)

--

F: --

P: --

U.S. NFIB Small Business Optimism Index (SA) (Nov)

--

F: --

P: --

Mexico 12-Month Inflation (CPI) (Nov)

--

F: --

P: --

Mexico Core CPI YoY (Nov)

--

F: --

P: --

Mexico PPI YoY (Nov)

--

F: --

P: --

U.S. Weekly Redbook Index YoY

--

F: --

P: --

U.S. JOLTS Job Openings (SA) (Oct)

--

F: --

P: --

China, Mainland M1 Money Supply YoY (Nov)

--

F: --

P: --

China, Mainland M0 Money Supply YoY (Nov)

--

F: --

P: --

China, Mainland M2 Money Supply YoY (Nov)

--

F: --

P: --

U.S. EIA Short-Term Crude Production Forecast For The Year (Dec)

--

F: --

P: --

U.S. EIA Natural Gas Production Forecast For The Next Year (Dec)

--

F: --

P: --

U.S. EIA Short-Term Crude Production Forecast For The Next Year (Dec)

--

F: --

P: --

EIA Monthly Short-Term Energy Outlook
U.S. API Weekly Gasoline Stocks

--

F: --

P: --

U.S. API Weekly Cushing Crude Oil Stocks

--

F: --

P: --

U.S. API Weekly Crude Oil Stocks

--

F: --

P: --

U.S. API Weekly Refined Oil Stocks

--

F: --

P: --

South Korea Unemployment Rate (SA) (Nov)

--

F: --

P: --

Japan Reuters Tankan Non-Manufacturers Index (Dec)

--

F: --

P: --

Japan Reuters Tankan Manufacturers Index (Dec)

--

F: --

P: --

Japan Domestic Enterprise Commodity Price Index MoM (Nov)

--

F: --

P: --

Japan Domestic Enterprise Commodity Price Index YoY (Nov)

--

F: --

P: --

China, Mainland PPI YoY (Nov)

--

F: --

P: --

China, Mainland CPI MoM (Nov)

--

F: --

P: --

Q&A with Experts
    • All
    • Chatrooms
    • Groups
    • Friends
    Connecting
    .
    .
    .
    Type here...
    Add Symbol or Code

      No matching data

      All
      Trump Updates
      Recommend
      Stocks
      Cryptocurrencies
      Central Banks
      Featured News
      • All
      • Russia-Ukraine Conflict
      • Middle East Flashpoint
      • All
      • Russia-Ukraine Conflict
      • Middle East Flashpoint

      Search
      Products

      Charts Free Forever

      Chats Q&A with Experts
      Screeners Economic Calendar Data Tools
      Membership Features
      Data Warehouse Market Trends Institutional Data Policy Rates Macro

      Market Trends

      Market Sentiment Order Book Forex Correlations

      Top Indicators

      Charts Free Forever
      Markets

      News

      News Analysis 24/7 Columns Education
      From Institutions From Analysts
      Topics Columnists

      Latest Views

      Latest Views

      Trending Topics

      Top Columnists

      Latest Update

      Signals

      Copy Rankings Latest Signals Become a signal provider AI Rating
      Contests
      Brokers

      Overview Brokers Assessment Rankings Regulators News Claims
      Broker listing Forex Brokers Comparison Tool Live Spread Comparison Scam
      Q&A Complaint Scam Alert Videos Tips to Detect Scam
      More

      Business
      Events
      Careers About Us Advertising Help Center

      White Label

      Data API

      Web Plug-ins

      Affiliate Program

      Awards Institution Evaluation IB Seminar Salon Event Exhibition
      Vietnam Thailand Singapore Dubai
      Fans Party Investment Sharing Session
      FastBull Summit BrokersView Expo
      Recent Searches
        Top Searches
          Markets
          News
          Analysis
          User
          24/7
          Economic Calendar
          Education
          Data
          • Names
          • Latest
          • Prev

          View All

          No data

          Scan to Download

          Faster Charts, Chat Faster!

          Download App
          English
          • English
          • Español
          • العربية
          • Bahasa Indonesia
          • Bahasa Melayu
          • Tiếng Việt
          • ภาษาไทย
          • Français
          • Italiano
          • Türkçe
          • Русский язык
          • 简中
          • 繁中
          Open Account
          Search
          Products
          Charts Free Forever
          Markets
          News
          Signals

          Copy Rankings Latest Signals Become a signal provider AI Rating
          Contests
          Brokers

          Overview Brokers Assessment Rankings Regulators News Claims
          Broker listing Forex Brokers Comparison Tool Live Spread Comparison Scam
          Q&A Complaint Scam Alert Videos Tips to Detect Scam
          More

          Business
          Events
          Careers About Us Advertising Help Center

          White Label

          Data API

          Web Plug-ins

          Affiliate Program

          Awards Institution Evaluation IB Seminar Salon Event Exhibition
          Vietnam Thailand Singapore Dubai
          Fans Party Investment Sharing Session
          FastBull Summit BrokersView Expo

          EUR/CAD corrects slightly around 1.562 as ECB pauses easing cycle and BoC warns of trade risks

          Adam

          Forex

          Summary:

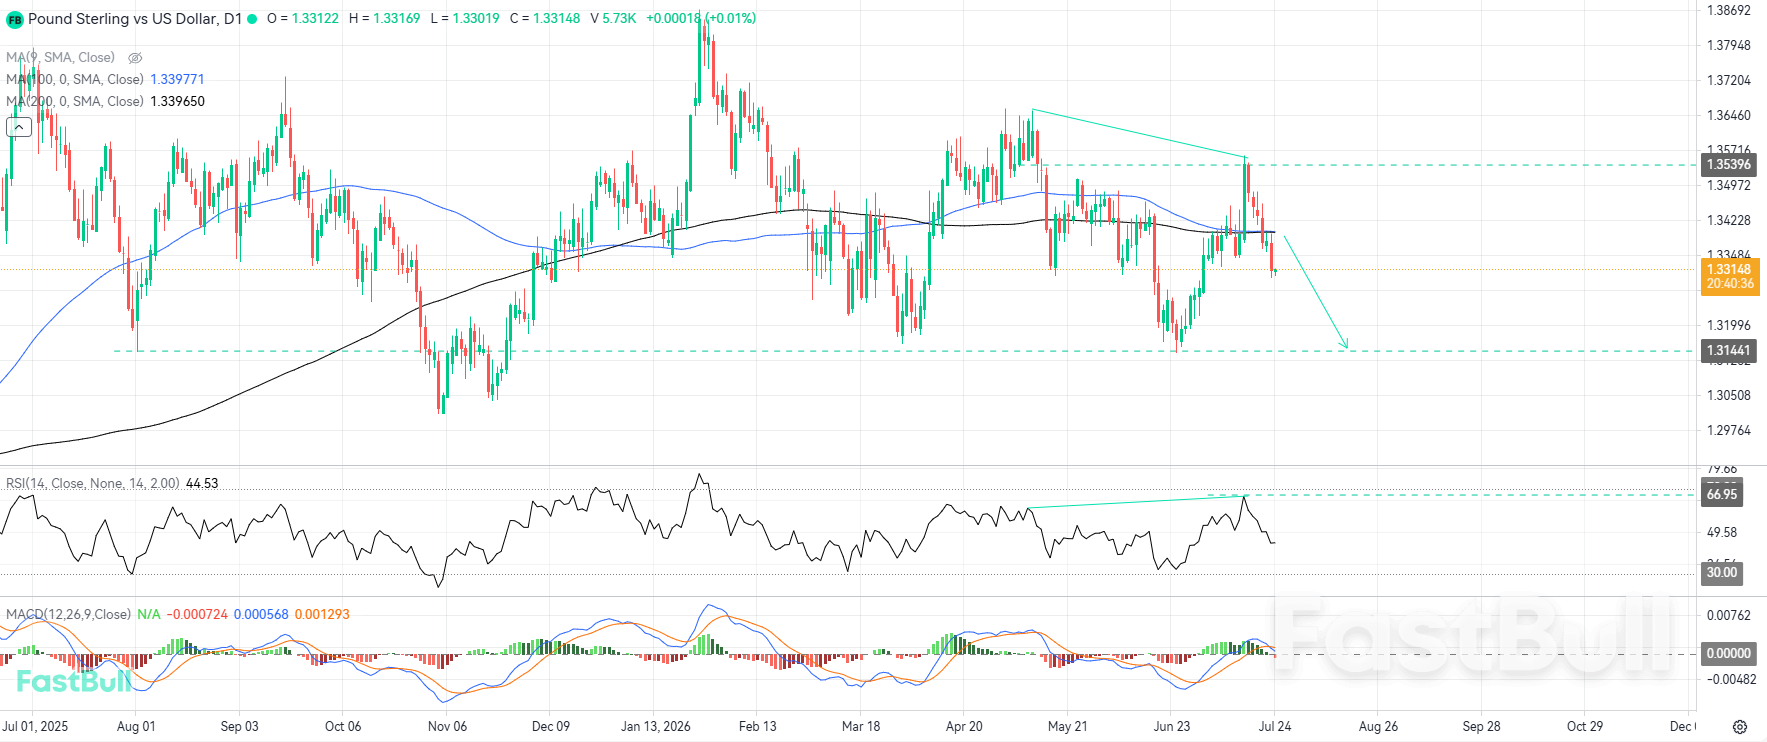
          The euro edged up only slightly after Lagarde stressed that the easing cycle could pause after eight straight cuts, while the CAD did not strengthen significantly as the BoC said it would cut interest rates if the Canadian economy weakens under pressure from import tariffs...

          SELL EURCAD
          Close Time
          CLOSED

          1.56200

          Entry Price

          1.55800

          TP

          1.56600

          SL

          1.61042 +0.00179 +0.11%

          40.0

          Pips

          Profit

          1.55800

          TP

          1.55797

          Exit Price

          1.56200

          Entry Price

          1.56600

          SL

          Macro Overview

          The ECB cut interest rates by 25 basis points to 2% on June 5, but signaled a possible pause in its easing cycle as eurozone inflation fell to 1.9%, close to its 2% target. Christine Lagarde stressed that given current inflation levels and the economic outlook, the ECB is “well placed” to pause and cut only once more by the end of the year if needed. PMI figures on June 4 showed Germany’s services PMI fell to 49.8, dragging the region’s composite index down to 50.2, its lowest since February 2025, suggesting slowing economic growth in the region.
          In contrast, the Bank of Canada (BoC) on June 4, 2025 kept its base interest rate at 2.75% and made it clear that it would cut it if the economy weakened significantly due to uncertainty over US trade policy.. The BoC cited the US President's imposition of 50% steel and aluminum tariffs on Canada as the biggest "risk driver" for the Canadian economy. Canada's first-quarter GDP growth of just 2.2% in 2025, largely due to lower public spending and stable energy prices, shows the pressure to keep inflation steady around 3.1% and force the central bank to not raise interest rates again.
          Against this backdrop, the monetary policy divergence between the ECB pausing easing and the BoC maintaining interest rates, coupled with less positive eurozone and Canadian data, has kept EUR/CAD in a short-term sideways trend, lacking a strong enough push to break out of the 1.558–1.568 channel..

          Market psychology

          EUR/CAD market sentiment on 06/06/2025 shows cautious state: hedge funds reduce long EUR/CAD positions after ECB signals end of easing game and BoC warns of trade risks. The “Fear Greed” index of European currencies remains neutral, indicating investors are reluctant to open large positions until more data on Eurozone inflation and Canadian employment figures are available. In addition, institutional money did not suddenly turn to CAD despite the BoC holding interest rates, due to tariff concerns and the unclear economic outlook of Canada.

          Technical analysis

          EUR/CAD corrects slightly around 1.562 as ECB pauses easing cycle and BoC warns of trade risks_1
          Currently, EUR/CAD is trading around 1.5620, just below the MA20 (middle Bollinger Band) at 1.5632, with the upper Bollinger Band (20,0,2) around 1.5680 and the lower band around 1.5580. The price's failure to break above the MA20 and a slight decline suggests that sellers are still in control in the short term.
          The Ichimoku Kinko Hyo indicator (9,26,52) on M15 shows that the price is below the Kumo cloud, the Tenkan-sen line (9) at 1.5630 has crossed below the Kijun-sen (26) at 1.5645, generating a short-term sell signal. The front Kumo cloud is sloping down, with Senkou Span A at 1.5635 and Senkou Span B around 1.5660, creating a resistance zone of 1.5635–1.5660.
          The Stochastic Oscillator (5,3,3) indicator on the M15 chart is currently around 35, with %K trending down, not yet in the oversold zone (below 20), showing that selling pressure still has room to test the support at 1.5580. RSI M15 is estimated at around 42, below 50, confirming that the short-term downtrend is still dominant.

          Trading Recommendations

          Entry: 1,5620 
          Take Profit: 1,5580
          Stop Loss: 1,5660 
          EUR/CAD could fall to 1.5580 in the short term if it stays below MA20 and Tenkan-sen, and if the price breaks the support at 1.5580, it could continue to fall to 1.5530. Conversely, if the price bounces and closes above 1.5635 (with increased volume), the SELL strategy is no longer reasonable and a stop loss should be placed at 1.5660, waiting for a technical pullback to 1.5680 before assessing the new trend.
          Risk Warnings and Disclaimers
          You understand and acknowledge that there is a high degree of risk involved in trading. Following any strategies or investment methods may lead to potential losses. The content on the site is provided by our contributors and analysts for information purposes only. You are solely responsible for determining whether any trading assets, securities, strategy, or any other product is suitable for investing based on your own investment objectives and financial situation.
          Add to Favorites
          Share

          EUR/AUD under slight pressure as ECB cuts interest rates to 2%

          Adam

          Forex

          Economic

          Summary:

          EUR/AUD is trading around 1.7550 as the euro is under mild pressure from the European Central Bank (ECB) cutting interest rates to 2% and then signaling a possible end to its easing streak, while the Australian dollar is little changed after weak Q1 GDP growth data (0.2%)...

          SELL EURAUD
          Close Time
          CLOSED

          1.75750

          Entry Price

          1.75000

          TP

          1.76200

          SL

          1.75588 +0.00321 +0.18%

          20.9

          Pips

          Profit

          1.75000

          TP

          1.75541

          Exit Price

          1.75750

          Entry Price

          1.76200

          SL

          Macro Overview

          First, on June 5, 2025, the ECB cut its policy rate by 25 basis points to 2%, warning that the easing cycle may be coming to an end as eurozone inflation fell to 1.9% in May, close to the bank's 2% target. 
          Figures from the June 4 PMI survey also showed that services activity in the eurozone weakened for the first time since November 2024, when the services PMI fell to 49.8 points, pulling the PMI composite index down to 50.2, the lowest since February 2025.
          Against this backdrop, despite the ECB cutting interest rates, the euro only rose slightly as Lagarde reminded that further cuts would depend heavily on future data, limiting expectations of a more aggressive cutting cycle.
          On the other hand, Australia announced that its GDP in the first quarter of 2025 increased by only 0.2%, lower than the expected 0.4% and down from the previous quarter's 0.6%, largely due to a decline in public spending and obstacles from severe weather affecting the mining and tourism industries. 
          The RBA had already cut interest rates to 3.85% on 20 May 2025 and is under pressure to cut further as inflation in Australia cooled to 3.2% (below the target of 2-3%) and is forecast to fall further in the next two quarters. This information has left AUD with little incentive to increase when considering the balance between expectations of further easing and the weak recovery of the economy.

          Market psychology

          The market is currently maintaining a cautious sentiment towards the EUR/AUD pair. Hedge funds have reduced their long EUR/AUD positions over the past week, suggesting that institutional investors are not rushing to enter positions before there is a clear signal from the ECB and RBA. 
          Although the ECB has cut interest rates to 2%, President Lagarde's statements highlighting the possibility of a pause in cuts at the next meeting have limited broad-based buying of the euro. At the same time, the AUD is also under pressure as GDP growth in the first quarter is slow and the RBA is likely to cut interest rates again in July, so money is not willing to buy AUD strongly. 
          As a result, EUR/AUD has been broadly in a narrow range this week, with the Asia-Pacific currency group’s “Fear Greed” index remaining neutral, reflecting the wait for more key data.

          Technical analysis

          EUR/AUD under slight pressure as ECB cuts interest rates to 2%_1
          On the M15 chart of 06/06/2025, EUR/AUD is trading around 1.7850. Important technical levels are as follows:
          The middle band (MA20) on the M15 timeframe is estimated around 1.7600, the upper band around 1.7700 and the lower band around 1.7500, indicating that the price is currently close to the lower Bollinger band. The fact that EUR/AUD has repeatedly failed to surpass the MA20 at 1.7600 and turned down from 1.7580 suggests that the short-term downtrend is still dominant.
          On the M15 chart, EUR/AUD is currently below the Kumo cloud, with the Tenkan-sen (9) estimated at around 1.7575 crossing below the Kijun-sen (26) around 1.7590, sending a short-term sell signal. The front Kumo cloud is also sloping down, creating strong resistance in the range of 1.7580–1.7600. This highlights the possibility of the price continuing to retreat to the support zone of 1.7530 before a technical pullback.
          Stochastic (5,3,3) on the M15 chart is moving down to the oversold zone (below 20), but has not yet reached the bottom, indicating that there is still room for sellers when the price approaches support. If Stochastic drops below 20 and maintains, the price may break the support zone of 1.7530 to head towards 1.7500.
          Trading Recommendations
          Based on macro and technical analysis on M15 timeframe, the strategy to sell (SELL) EUR/AUD on 06/06/2025 is as follows:
          Entry: 1.7575 
          Take Profit: 1.7500
          Stop Loss: 1,7620
          Risk Warnings and Disclaimers
          You understand and acknowledge that there is a high degree of risk involved in trading. Following any strategies or investment methods may lead to potential losses. The content on the site is provided by our contributors and analysts for information purposes only. You are solely responsible for determining whether any trading assets, securities, strategy, or any other product is suitable for investing based on your own investment objectives and financial situation.
          Add to Favorites
          Share

          Gold Holds Firm as ECB Cuts Rates, U.S. Jobless Claims Rise, and Trade Tensions Deepen

          Warren Takunda

          Commodity

          Traders' Opinions

          Summary:

          Gold remains buoyant above $3,370 as escalating trade tensions, rising U.S. jobless claims, and a surprise ECB rate cut fuel safe-haven demand.

          BUY XAUUSD
          Close Time
          CLOSED

          3364.73

          Entry Price

          3435.00

          TP

          3320.00

          SL

          4211.36 +13.45 +0.32%

          447.3

          Pips

          Loss

          3320.00

          SL

          3319.93

          Exit Price

          3364.73

          Entry Price

          3435.00

          TP

          Gold prices (XAU/USD) steadied near elevated levels on Thursday as a cocktail of central bank easing, labor market weakness in the United States, and renewed geopolitical friction buoyed investor appetite for safe-haven assets. With spot prices holding above $3,370 after testing $3,400 in early European trade, bullion continues to find firm footing amid deepening macroeconomic and geopolitical uncertainty.
          The metal's latest gains are underpinned by a dovish pivot from the European Central Bank, which delivered a widely expected 25 basis-point interest rate cut—the first in nearly a year. Although the decision was priced in, market participants parsed ECB President Christine Lagarde’s cautious tone during the subsequent press conference. Lagarde flagged persistent financial stability risks in the euro area, acknowledging that while banks remain resilient, external threats—particularly trade-related—continue to cloud the outlook.
          “The risk environment remains fragile,” Lagarde said. “This is a precautionary step aimed at ensuring that monetary conditions remain accommodative enough to support growth as inflation eases.”
          The move comes just ahead of a pivotal meeting between German Chancellor Friedrich Merz and U.S. President Donald Trump in Washington. The two leaders are expected to hash out issues ranging from NATO funding to increasingly strained transatlantic trade ties. The diplomatic backdrop has shifted sharply in recent days as Washington doubled tariffs on European and Mexican steel and aluminum imports from 25% to 50%, prompting retaliatory warnings from global counterparts.
          Mexican President Claudia Sheinbaum was particularly forceful in her remarks, calling the new U.S. tariffs “unjust, unsustainable, and without legal grounds.” Canadian Prime Minister Justin Trudeau labeled the measures “illegal,” while EU officials have hinted that countermeasures could be imposed as soon as next week if talks fail to yield a resolution.
          Across the Atlantic, signs of economic deceleration are becoming harder to ignore. U.S. Initial Jobless Claims rose to 245,000 in the latest weekly reading, exceeding economist expectations of 235,000 and stoking concerns that the labor market is beginning to lose momentum. This followed Wednesday’s weak ADP employment print, which showed private payrolls increasing by just 37,000 in May—well below the 150,000 expected.
          All eyes are now on Friday’s closely watched Nonfarm Payrolls (NFP) report. Consensus forecasts suggest 130,000 jobs were added last month, down sharply from April’s 177,000 figure. While the unemployment rate is expected to remain unchanged at 4.2%, a surprise miss could reinforce market speculation that the Federal Reserve may opt for a rate cut as early as July, rather than waiting until September.
          Such a shift would be particularly supportive for gold, which tends to benefit when interest rates fall and the opportunity cost of holding non-yielding assets declines.
          “Gold is one of the few assets catching a safe-haven bid in a world where central banks are blinking,” said AvaTrade market strategist Naeem Aslam. “With the ECB cutting and the Fed under pressure from rising jobless claims and slower hiring, the path of least resistance for gold remains higher.”
          Technical AnalysisGold Holds Firm as ECB Cuts Rates, U.S. Jobless Claims Rise, and Trade Tensions Deepen_1
          Technically, gold remains on solid footing. The yellow metal continues to trade within a short-term bullish channel and recently confirmed a breakout above the key resistance level of $3,365. Momentum indicators, such as the Relative Strength Index (RSI), are flashing bullish signals, while the 50-day exponential moving average (EMA50) provides dynamic support to price action.
          As long as gold sustains above $3,365, traders are likely to target the next key resistance level at $3,435. A decisive break above this level could pave the way for a fresh leg higher, particularly if Friday’s U.S. employment data disappoints and further dampens the Fed’s tightening stance.
          For now, the short-term trading range is seen between support at $3,330 and resistance at $3,435. The outlook remains bullish, with any dips likely to attract fresh buying interest amid persistent global uncertainties.
          TRADE RECOMMENDATION
          BUY GOLD
          ENTRY PRICE: 3365
          STOP LOSS: 3320
          TAKE PROFIT: 3435
          Risk Warnings and Disclaimers
          You understand and acknowledge that there is a high degree of risk involved in trading. Following any strategies or investment methods may lead to potential losses. The content on the site is provided by our contributors and analysts for information purposes only. You are solely responsible for determining whether any trading assets, securities, strategy, or any other product is suitable for investing based on your own investment objectives and financial situation.
          Add to Favorites
          Share

          GBP/USD Rips Higher on Fed Rate Cut Bets and Rising US Labor Market Concerns

          Warren Takunda

          Economic

          Summary:

          Sterling surged to its highest level in over two years, breaking above 1.3600 against the dollar as weak US jobless claims data and hawkish signals from the ECB drove broad-based dollar selling.

          BUY GBPUSD
          Close Time
          CLOSED

          1.36002

          Entry Price

          1.39500

          TP

          1.35400

          SL

          1.33176 -0.00136 -0.10%

          60.2

          Pips

          Loss

          1.35400

          SL

          1.35398

          Exit Price

          1.36002

          Entry Price

          1.39500

          TP

          The British pound extended its bullish streak on Thursday, breaching the key 1.3600 mark against the US dollar for the first time since February 2022. The rally in GBP/USD gathered pace during the American session as mounting selling pressure on the greenback, triggered by softer-than-expected US economic data, sent investors scrambling for alternative majors. At the time of publication, the pair was trading at 1.3605, up 0.4% on the day, after rising steadily throughout the session.
          The key driver behind the pound’s ascent was the latest data from the US Department of Labor, which showed an unexpected increase in initial jobless claims. First-time applications for unemployment benefits rose to 247,000 for the week ending May 31, missing the market consensus of 235,000 and adding to evidence that the labor market may be losing momentum. This print reinforces concerns that the US economy, while still growing, is beginning to cool, particularly in the employment sector.
          This shift in sentiment came just hours after the European Central Bank delivered a 25-basis-point rate cut but offset the dovish action with assertive forward guidance. ECB President Christine Lagarde struck a notably hawkish tone in her post-decision remarks, suggesting that the central bank may now be close to ending its easing cycle. She noted that the ECB was in “a good place” and emphasized data-dependence going forward. Her comments sparked a rotation out of the dollar as traders interpreted the ECB’s stance as less dovish than previously anticipated, thereby narrowing interest rate differentials between the eurozone and the United States.
          Consequently, the US dollar came under renewed pressure across the board, with the dollar index (DXY) retreating to 98.45, down 0.4% on the day and near a multi-week low. With the dollar losing traction and global investors recalibrating expectations for the Federal Reserve’s next move, sterling emerged as one of the primary beneficiaries.
          Market focus now shifts to a barrage of scheduled speeches from Federal Reserve officials due later Thursday, followed by the US nonfarm payrolls report on Friday. Traders will be watching closely to gauge whether Fed policymakers acknowledge the weakening jobs data as reason enough to justify rate cuts in the coming months. According to the CME FedWatch Tool, markets are currently pricing in a 30% probability of a 25-basis-point rate cut as soon as July. Any dovish tilt in Thursday’s commentary or a downside surprise in Friday’s labor report could intensify rate cut expectations and further undermine the dollar.
          Technical AnalysisGBP/USD Rips Higher on Fed Rate Cut Bets and Rising US Labor Market Concerns_1
          From a technical standpoint, GBP/USD is forming a classic ascending triangle formation on the four-hour chart, often regarded as a bullish continuation pattern. The pair has been consolidating beneath a horizontal resistance zone between 1.36200 and 1.36300, while maintaining higher lows along an upward-sloping trendline. This pattern signals mounting pressure on the resistance zone, with an eventual breakout appearing increasingly likely.
          The distance between the base and the top of the triangle measures roughly 325 pips, calculated from the support level around 1.33000 to the resistance zone at 1.36250. A clean breakout above the 1.36300 region would project a target near the 1.39500 area, marking a potential continuation of the bullish trend and offering a compelling upside objective for momentum-driven traders. This level also coincides with a major technical barrier from early 2022, adding to its significance.
          Adding further support to the bullish outlook, GBP/USD remains comfortably above its 50-period exponential moving average, which is acting as dynamic support. The Relative Strength Index (RSI) is trending positively, suggesting there is still room for the rally to extend before the pair reaches overbought conditions.
          TRADE RECOMMENDATION
          BUY GBPUSD
          ENTRY PRICE: 1.3600
          STOP LOSS: 1.3540
          TAKE PROFIT: 1.3950
          Risk Warnings and Disclaimers
          You understand and acknowledge that there is a high degree of risk involved in trading. Following any strategies or investment methods may lead to potential losses. The content on the site is provided by our contributors and analysts for information purposes only. You are solely responsible for determining whether any trading assets, securities, strategy, or any other product is suitable for investing based on your own investment objectives and financial situation.
          Add to Favorites
          Share

          AUD/USD Rally Extends as Market Bets Against U.S. Economy and Embraces Risk

          Warren Takunda

          Economic

          Summary:

          The Australian Dollar has rebounded to weekly highs past 0.6500, buoyed by a weakening U.S. Dollar and rising global trade tensions, despite soft domestic GDP data and a dovish Reserve Bank of Australia.

          BUY AUDUSD
          Close Time
          CLOSED

          0.65349

          Entry Price

          0.69000

          TP

          0.64500

          SL

          0.66349 -0.00034 -0.05%

          31.5

          Pips

          Loss

          0.64500

          SL

          0.65034

          Exit Price

          0.65349

          Entry Price

          0.69000

          TP

          The Australian Dollar extended its rally for a second consecutive session on Thursday, breaking decisively above the 0.6500 level and marking a strong recovery from earlier losses this week. This move higher is largely being powered by a combination of U.S. Dollar weakness and growing market anxiety over trade policy under the looming specter of renewed tariffs. Investors appear increasingly willing to look past weaker-than-expected domestic growth data from Australia and the dovish messaging from the Reserve Bank of Australia, instead focusing on deteriorating sentiment around the U.S. economy.
          Much of the recent momentum in the Aussie stems not from strength at home, but from the growing cracks in the U.S. economic outlook. On Wednesday, the Institute for Supply Management’s Services PMI revealed a surprise contraction, falling below the crucial 50-mark that indicates whether activity is expanding or shrinking. This was compounded by a weaker-than-anticipated reading from the ADP private payrolls report, which showed that hiring in the private sector slowed last month. These disappointing numbers have cast a shadow over Friday’s upcoming Non-Farm Payrolls report and reignited speculation that the U.S. economy may be inching toward a recession.
          At the same time, trade tensions have surged back to the forefront. Former President Donald Trump, who remains an influential figure on economic policy expectations, declared that ongoing negotiations with Chinese Premier Xi Jinping have been "extremely hard," citing a lack of meaningful progress. Markets reacted nervously to the announcement that tariffs on steel and aluminum imports would double to 50% from 25%, stoking fears of a broader protectionist pivot. Ironically, this uncertainty is hurting the U.S. Dollar more than traditionally risk-sensitive currencies like the Aussie, which is defying its usual behavior under such conditions.
          Despite a weak set of domestic data released earlier in the week, the Australian Dollar has held its ground. Australia’s first-quarter GDP rose just 0.2%, missing consensus forecasts of 0.4% and marking a notable slowdown from the 0.6% pace seen in the previous quarter. The disappointing growth figures suggest that the Australian economy is struggling under the weight of soft household spending, stagnant wage growth, and slowing business investment. Ordinarily, such data might have weighed more heavily on the currency, but current global dynamics appear to be overriding local fundamentals.
          The dovish tone from the Reserve Bank of Australia adds another layer of complexity. Minutes from the central bank’s most recent policy meeting revealed that a 50 basis point rate cut was actively considered. Policymakers also signaled their readiness to implement further reductions if global trade conditions deteriorate due to escalating tariffs. While such a stance might normally pressure the Australian Dollar, the broader flight from U.S. assets is providing a supportive backdrop.
          Technical AnalysisAUD/USD Rally Extends as Market Bets Against U.S. Economy and Embraces Risk_1
          On the technical front, the price action in AUD/USD is encouraging for bulls. The pair has broken above a key resistance zone around 0.6550, signaling the potential for a broader breakout. The Relative Strength Index is showing bullish momentum, even as it edges into overbought territory, suggesting that strong buying interest remains in play. Additionally, the pair continues to trade above its 50-day Exponential Moving Average, which reinforces the view that the short-term trend remains upward. The Aussie is currently navigating a minor ascending channel that has kept price action relatively stable while guiding it higher.
          We are now closely watching the next major resistance levels, with the first significant upside target emerging near the 0.6680 area, a zone that previously acted as a strong barrier. A sustained break above that could pave the way for an eventual test of the 0.6900 region, a level not seen since late last year. These milestones, however, are contingent on a continued softening of U.S. data and a lack of hawkish surprises from the Federal Reserve or other major central banks.
          TRADE RECOMMENDATION
          BUY AUDUSD
          ENTRY PRICE: 0.6535
          STOP LOSS: 0.6450
          TAKE PROFIT: 0.6900
          Risk Warnings and Disclaimers
          You understand and acknowledge that there is a high degree of risk involved in trading. Following any strategies or investment methods may lead to potential losses. The content on the site is provided by our contributors and analysts for information purposes only. You are solely responsible for determining whether any trading assets, securities, strategy, or any other product is suitable for investing based on your own investment objectives and financial situation.
          Add to Favorites
          Share

          Deteriorating US Economic Outlook Boosts Gold Prices Further

          Eva Chen

          Economic

          Commodity

          Summary:

          The Institute for Supply Management (ISM) has indicated that the US service sector business activity has contracted for the first time in nearly a year. Meanwhile, according to the ADP National Employment Report, private sector hiring in the US saw a significant slowdown in May. The cooling US economy could lead to an early rate cut by the Federal Reserve, which is bullish for gold.

          BUY XAUUSD
          Close Time
          CLOSED

          3381.06

          Entry Price

          3500.00

          TP

          3300.00

          SL

          4211.36 +13.45 +0.32%

          810.6

          Pips

          Loss

          3300.00

          SL

          3299.83

          Exit Price

          3381.06

          Entry Price

          3500.00

          TP

          Fundamentals

          Gold prices surged past $3,390 on Thursday as concerns over the US economic slowdown intensified, bolstering demand for non-yielding safe-haven assets and driving the strength in gold prices.
          The ISM's report released on Wednesday revealed that the US service sector contracted for the first time in nearly a year, signaling a worrying sign of overall economic weakness.
          Moreover, the ADP employment report showed a marked slowdown in private sector hiring, with only 37,000 jobs added in May, significantly below the expected 111,000 and also lower than the 60,000 added in April.
          Nela Richardson, Chief Economist at ADP, acknowledged the hiring slowdown but noted that wage pressures have not yet significantly eased, indicating that while the overall momentum has weakened, certain parts of the labor market remain tight.
          These weak indicators have reinforced expectations that the Federal Reserve will cut rates at least twice this year. This outlook is typically bullish for gold, as the precious metal becomes more attractive in a low-interest-rate environment.
          Despite repeated calls for rate cuts by former President Trump, Federal Reserve officials have remained cautious, especially amid ongoing trade risks and a volatile global landscape.
          Currently, attention is turning to the US non-farm payrolls report due out on Friday. If the report continues to fall short of market expectations, it could further clarify the Federal Reserve's policy path. (Bullish for gold)
          Deteriorating US Economic Outlook Boosts Gold Prices Further_1

          Technical Analysis

          Since hitting a low on May 15, gold prices have been on a strong upward trend, forming a series of higher highs, signaling potential for further gains.
          From a technical standpoint, gold prices are in an upward trend, having broken above this week's high of $3,392 during trading hours. The Relative Strength Index (RSI) indicates that buying pressure is dominant.
          Given the clear daily upward trend, gold prices are expected to rise to the next resistance level at $3,415. Moreover, based on the continuation of the head-and-shoulders bottom pattern, a break above this level appears inevitable. The next resistance level is at $3,440.

          Trading Recommendations

          Trading Direction: Long
          Entry Price: 3374
          Target Price: 3500
          Stop Loss: 3300
          Valid Until: June 20, 2025, 23:55:00
          Support: 3385/3361/3343
          Resistance: 3415/3340/3480
          Risk Warnings and Disclaimers
          You understand and acknowledge that there is a high degree of risk involved in trading. Following any strategies or investment methods may lead to potential losses. The content on the site is provided by our contributors and analysts for information purposes only. You are solely responsible for determining whether any trading assets, securities, strategy, or any other product is suitable for investing based on your own investment objectives and financial situation.
          Add to Favorites
          Share

          Multiple Factors Keep the Asset Vulnerable

          Eva Chen

          Central Bank

          Forex

          Summary:

          The Bank of Canada (BoC) has kept its key interest rate unchanged, primarily focusing on inflation risks. A potential rate cut in the future cannot be ruled out.

          SELL USDCAD
          Close Time
          CLOSED

          1.36582

          Entry Price

          1.34000

          TP

          1.39100

          SL

          1.38215 +0.00068 +0.05%

          81.7

          Pips

          Loss

          1.34000

          TP

          1.37399

          Exit Price

          1.36582

          Entry Price

          1.39100

          SL

          Fundamentals

          The BoC maintained its key benchmark interest rate at 2.75% on Wednesday, citing the need to assess the impact of U.S. trade policies. However, it noted that further rate cuts might be necessary if the economy weakens due to tariffs.
          This decision marks the second consecutive hold by the BoC, following a significant rate-cutting cycle over the past nine months that saw rates reduced by 225 basis points.
          The BoC highlighted that overall inflation, excluding tax effects, accelerated to 2.3%, above the central bank's expectations.
          The Liberal government's repeal of the consumer carbon tax will impact inflation data for April and the following 11 months.
          Core inflation reached its highest level in nearly a year. BoC Governor Tiff Macklem stated, "There are some unusual fluctuations in inflation, but these measures indicate that underlying inflation may be stronger than we thought."
          Moreover, Macklem emphasized that "the trade conflicts initiated by the U.S. remain the biggest headwind for the Canadian economy." He described U.S. trade policies as highly unpredictable. He added, "As we gather more information, we have a clear consensus to keep policy on hold."
          Multiple Factors Keep the Asset Vulnerable_1

          Technical Analysis

          USDCAD has broken below last week's low and continues to trade within a downward channel, with strong selling momentum. The Relative Strength Index (RSI) has dipped to around 33.00, indicating robust bearish sentiment.
          There are currently few factors that could prevent it from breaking below the 1.3600 level. If it holds above this level, it could pave the way for the demand zone at 1.3470 or the 100% Fibonacci retracement level at 1.3349. As long as the 1.3860 resistance level holds, the outlook remains bearish.
          However, if it breaks above the May 29 high of 1.3860, the near-term trend would turn neutral, opening the door to the May 21 high of 1.3920, followed by the May 15 high of 1.4000.

          Trading Recommendations

          Trading Direction: Sell
          Entry Price: 1.3679
          Target Price: 1.3400
          Stop Loss: 1.3910
          Valid Until: June 20, 2025, 23:55:00
          Support: 1.3677/1.3647/1.3542
          Resistance: 1.3743/1.3750/1.3862
          Risk Warnings and Disclaimers
          You understand and acknowledge that there is a high degree of risk involved in trading. Following any strategies or investment methods may lead to potential losses. The content on the site is provided by our contributors and analysts for information purposes only. You are solely responsible for determining whether any trading assets, securities, strategy, or any other product is suitable for investing based on your own investment objectives and financial situation.
          Add to Favorites
          Share
          FastBull
          Copyright © 2025 FastBull Ltd

          728 RM B 7/F GEE LOK IND BLDG NO 34 HUNG TO RD KWUN TONG KLN HONG KONG

          TelegramInstagramTwitterfacebooklinkedin
          App Store Google Play Google Play
          Products
          Charts

          Chats

          Q&A with Experts
          Screeners
          Economic Calendar
          Data
          Tools
          Membership
          Features
          Function
          Markets
          Copy Trading
          Latest Signals
          Contests
          News
          Analysis
          24/7
          Columns
          Education
          Company
          Careers
          About Us
          Contact Us
          Advertising
          Help Center
          Feedback
          User Agreement
          Privacy Policy
          Business

          White Label

          Data API

          Web Plug-ins

          Poster Maker

          Affiliate Program

          Risk Disclosure

          The risk of loss in trading financial instruments such as stocks, FX, commodities, futures, bonds, ETFs and crypto can be substantial. You may sustain a total loss of the funds that you deposit with your broker. Therefore, you should carefully consider whether such trading is suitable for you in light of your circumstances and financial resources.

          No decision to invest should be made without thoroughly conducting due diligence by yourself or consulting with your financial advisors. Our web content might not suit you since we don't know your financial conditions and investment needs. Our financial information might have latency or contain inaccuracy, so you should be fully responsible for any of your trading and investment decisions. The company will not be responsible for your capital loss.

          Without getting permission from the website, you are not allowed to copy the website's graphics, texts, or trademarks. Intellectual property rights in the content or data incorporated into this website belong to its providers and exchange merchants.

          Not Logged In

          Log in to access more features

          FastBull Membership

          Not yet

          Purchase

          Become a signal provider
          Help Center
          Customer Service
          Dark Mode
          Price Up/Down Colors

          Log In

          Sign Up

          Position
          Layout
          Fullscreen
          Default to Chart
          The chart page opens by default when you visit fastbull.com